3d. Consumer and producer surplus
0.0(0)
0.0(0)
Card Sorting
1/7
Earn XP
Description and Tags
Last updated 1:01 AM on 4/9/23
Name | Mastery | Learn | Test | Matching | Spaced | Call with Kai |
|---|
No analytics yet
Send a link to your students to track their progress
8 Terms
1
New cards
Diminishing marginal utility
As you consume more of a good, the marginal utility from each extra unit will decrease.
E.g. as you eat more cupcakes, the marginal benefit of the next cupcake goes down each time as you become less hungry
E.g. as you eat more cupcakes, the marginal benefit of the next cupcake goes down each time as you become less hungry
2
New cards
Marginal utility
The additional benefit received from consuming an extra unit of a good.
3
New cards
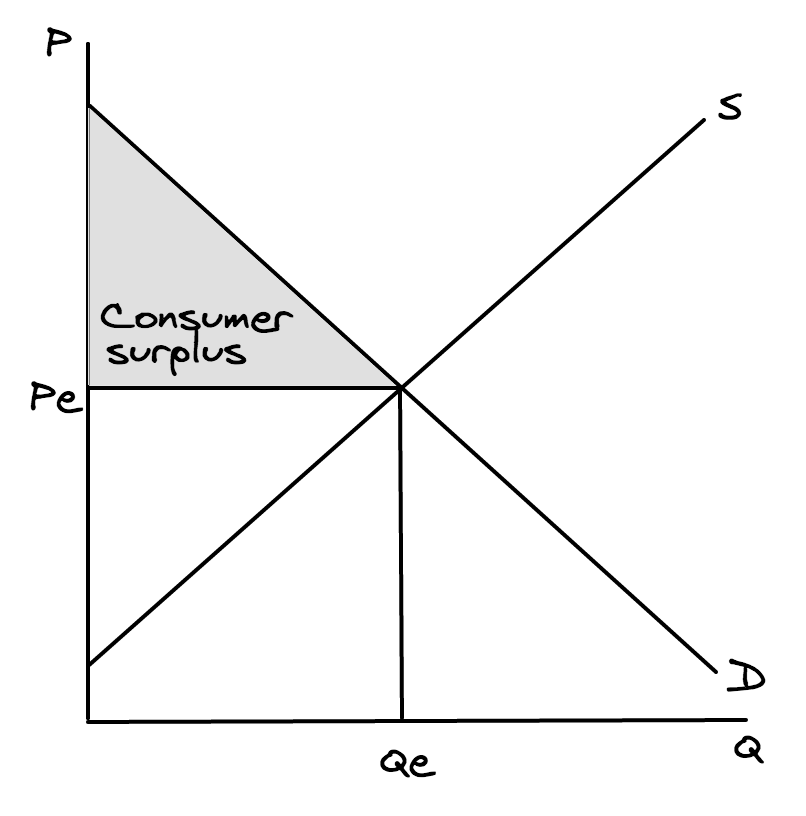
Consumer surplus
The difference between what consumers are willing to pay and what they actually pay.
4
New cards
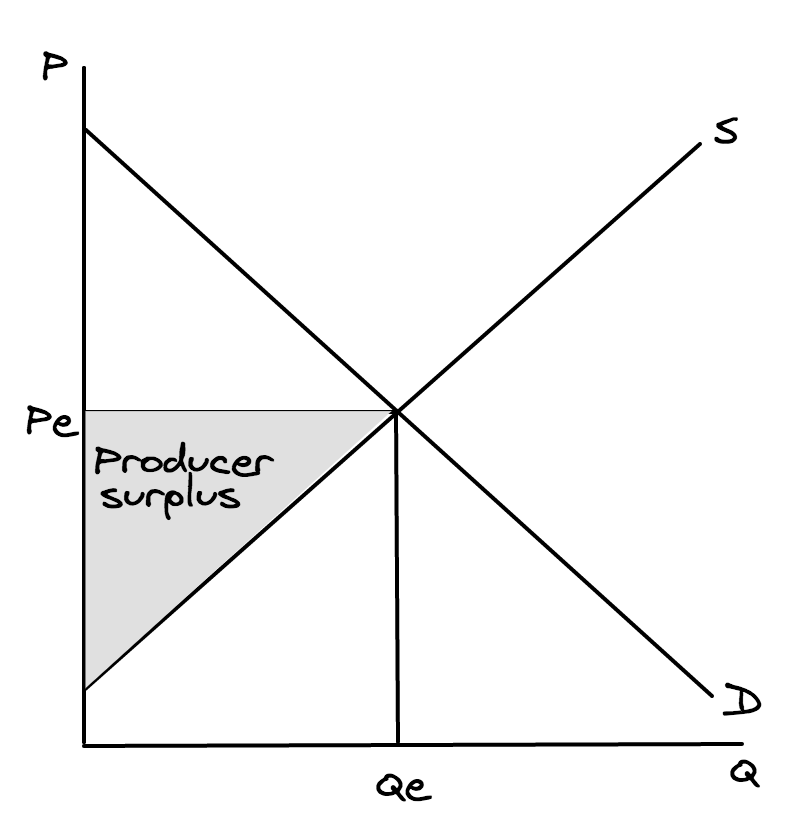
Producer surplus
The difference between what producers are willing to sell for and what they actually sell for.
5
New cards
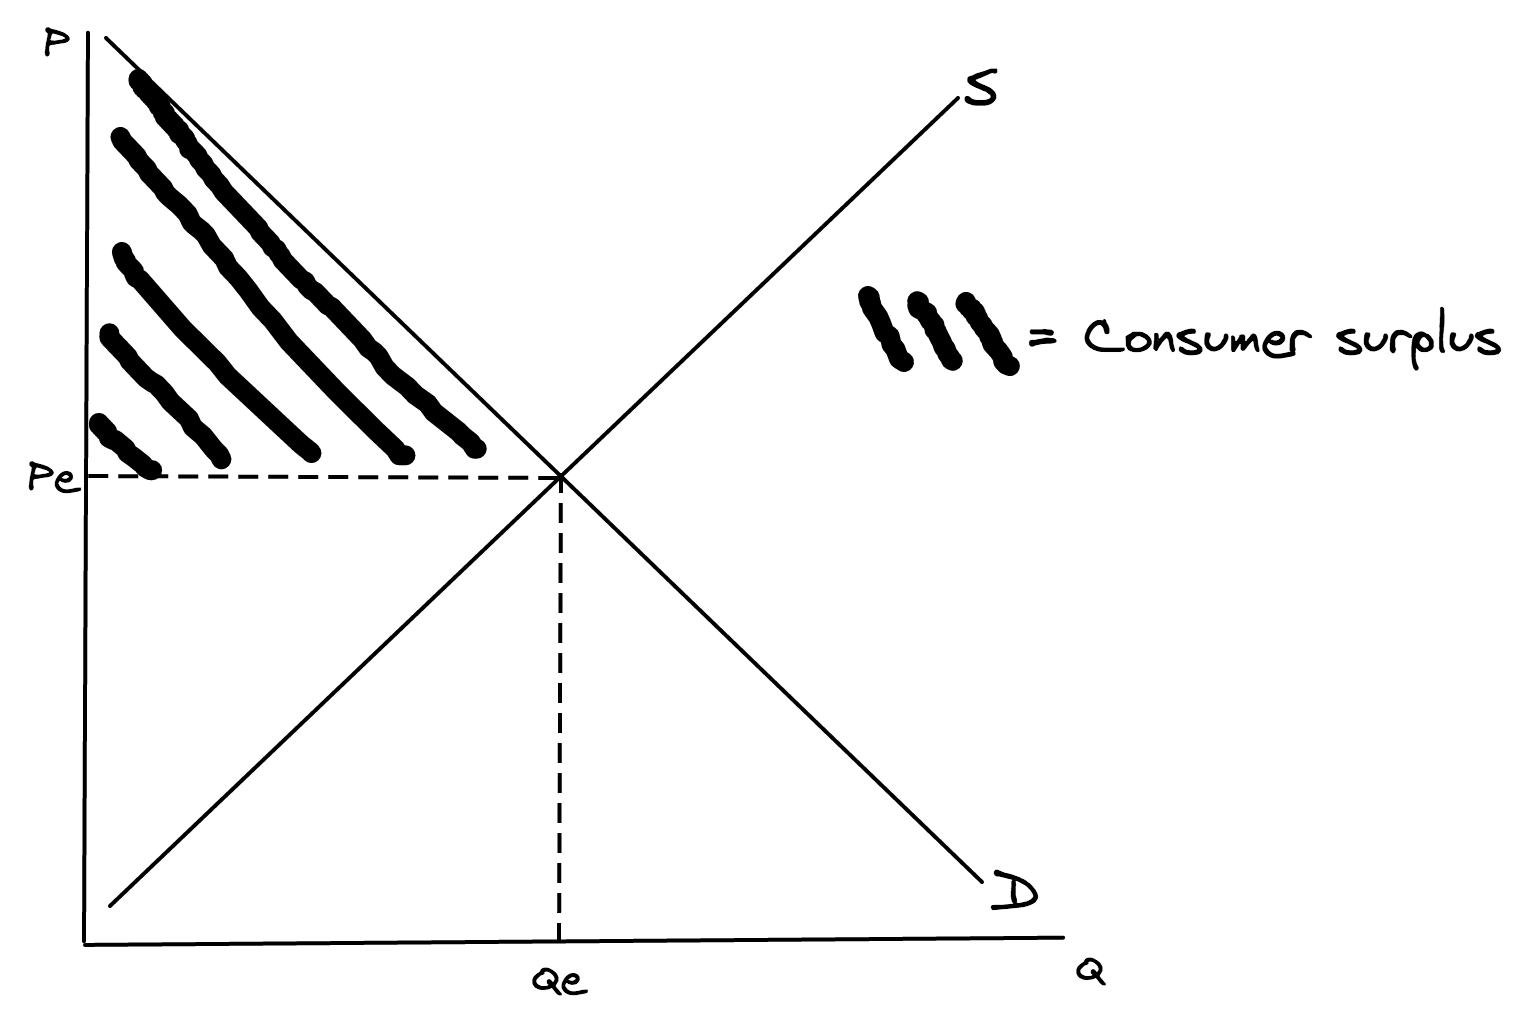
Draw a diagram showing consumer surplus.
To score full marks in your exam, make sure your diagram includes ALL of the following (you will lose marks if you miss any of these out):
\- Labelled axes (P and Q)
\- Labelled curves (S and D)
\- Equilibrium price (Pe)
\- Equilibrium quantity (Qe)
\- Consumer surplus shaded in
\- Consumer surplus labelled or a key provided (as below)
\- Labelled axes (P and Q)
\- Labelled curves (S and D)
\- Equilibrium price (Pe)
\- Equilibrium quantity (Qe)
\- Consumer surplus shaded in
\- Consumer surplus labelled or a key provided (as below)
6
New cards
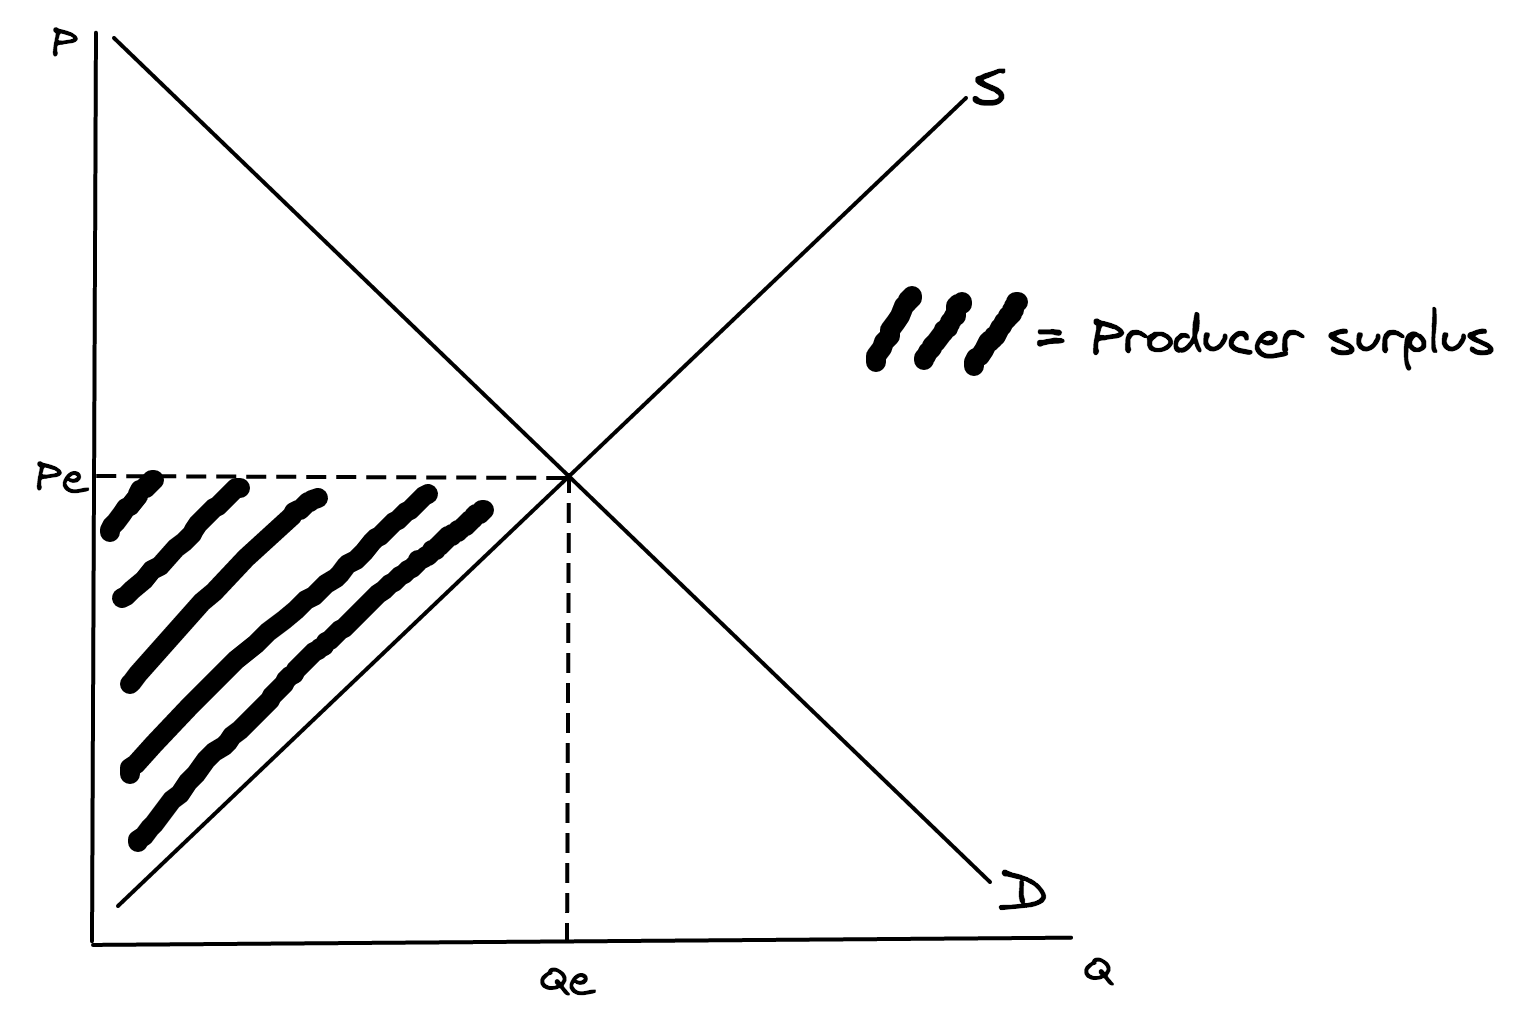
Draw a diagram showing producer surplus.
To score full marks in your exam, make sure your diagram includes ALL of the following (you will lose marks if you miss any of these out):
\- Labelled axes (P and Q)
\- Labelled curves (S and D)
\- Equilibrium price (Pe)
\- Equilibrium quantity (Qe)
\- Producer surplus shaded in
\- Producer surplus labelled or a key provided (as below)
\- Labelled axes (P and Q)
\- Labelled curves (S and D)
\- Equilibrium price (Pe)
\- Equilibrium quantity (Qe)
\- Producer surplus shaded in
\- Producer surplus labelled or a key provided (as below)
7
New cards
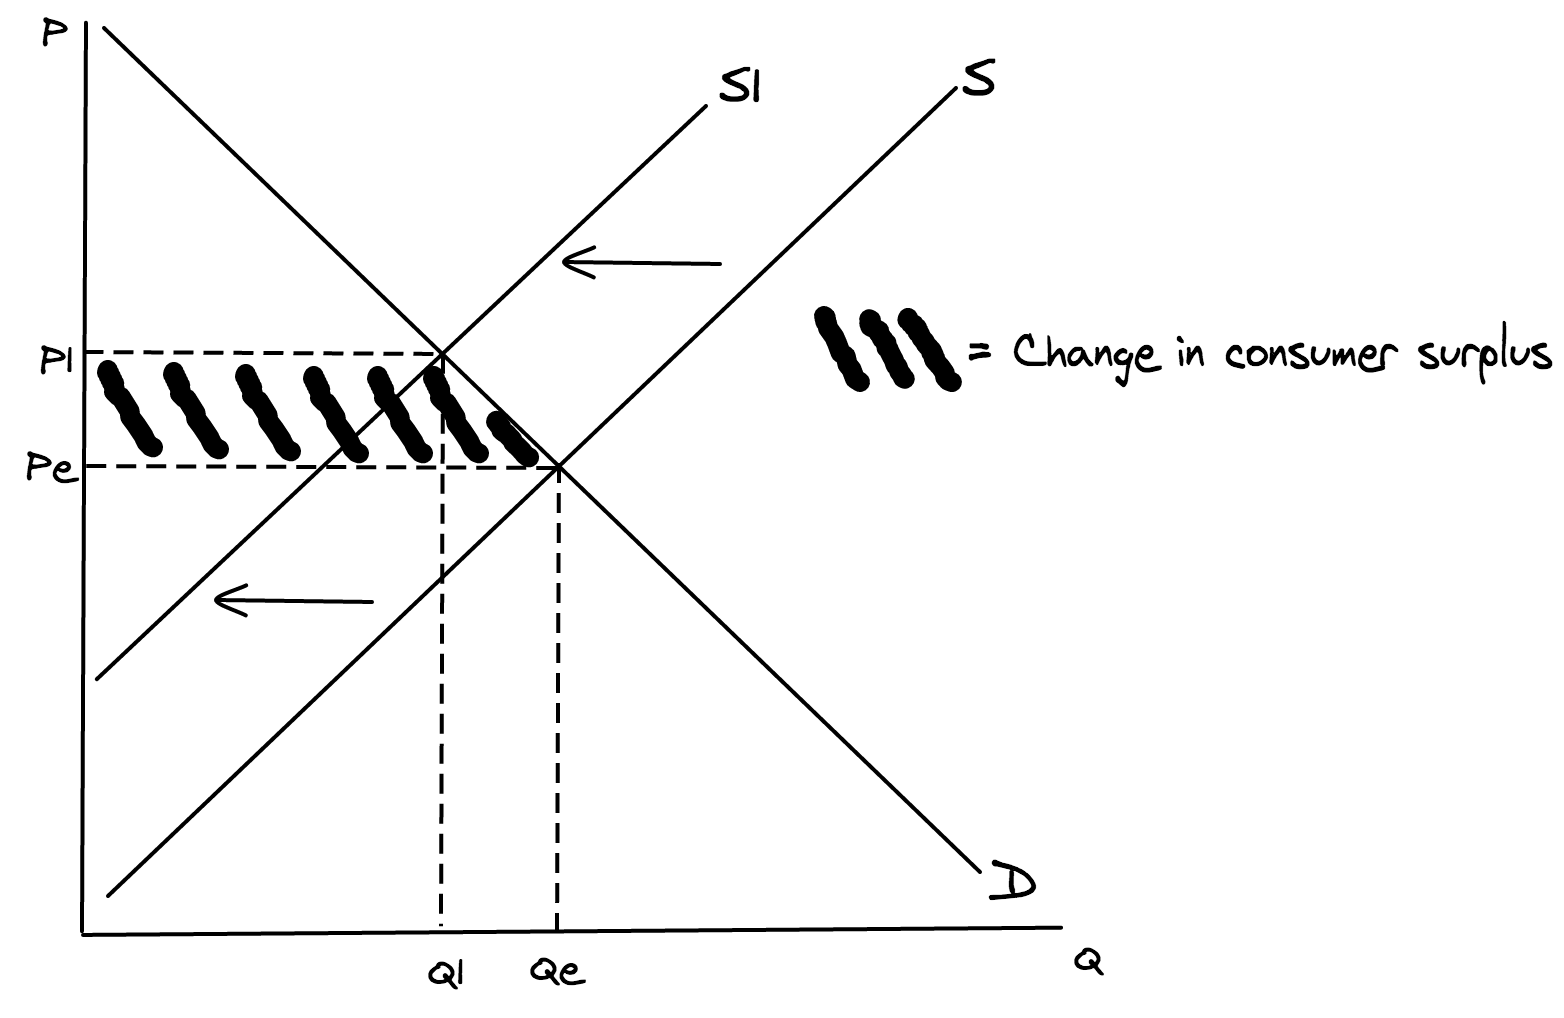
A nuclear power plant implodes, destroying a local strawberry field. Sketch a diagram to show the effect of the implosion on consumer surplus in the strawberry market.
Supply of strawberries will decrease if a local strawberry field is destroyed.
To score full marks in your exam, make sure your diagram includes ALL of the following (you will lose marks if you miss any of these out):
\- Labelled axes (P and Q)
\- Labelled curves (S and D)
\- Equilibrium price (Pe)
\- Equilibrium quantity (Qe)
\- New supply curve, S1 shifted in, to the left
\- Arrows showing direction of shift from S to S1
\- New price (P1)
\- New quantity (Q1)
\- Change in consumer surplus shaded in
\- Change in consumer surplus labelled or a key provided (as below)
8
New cards
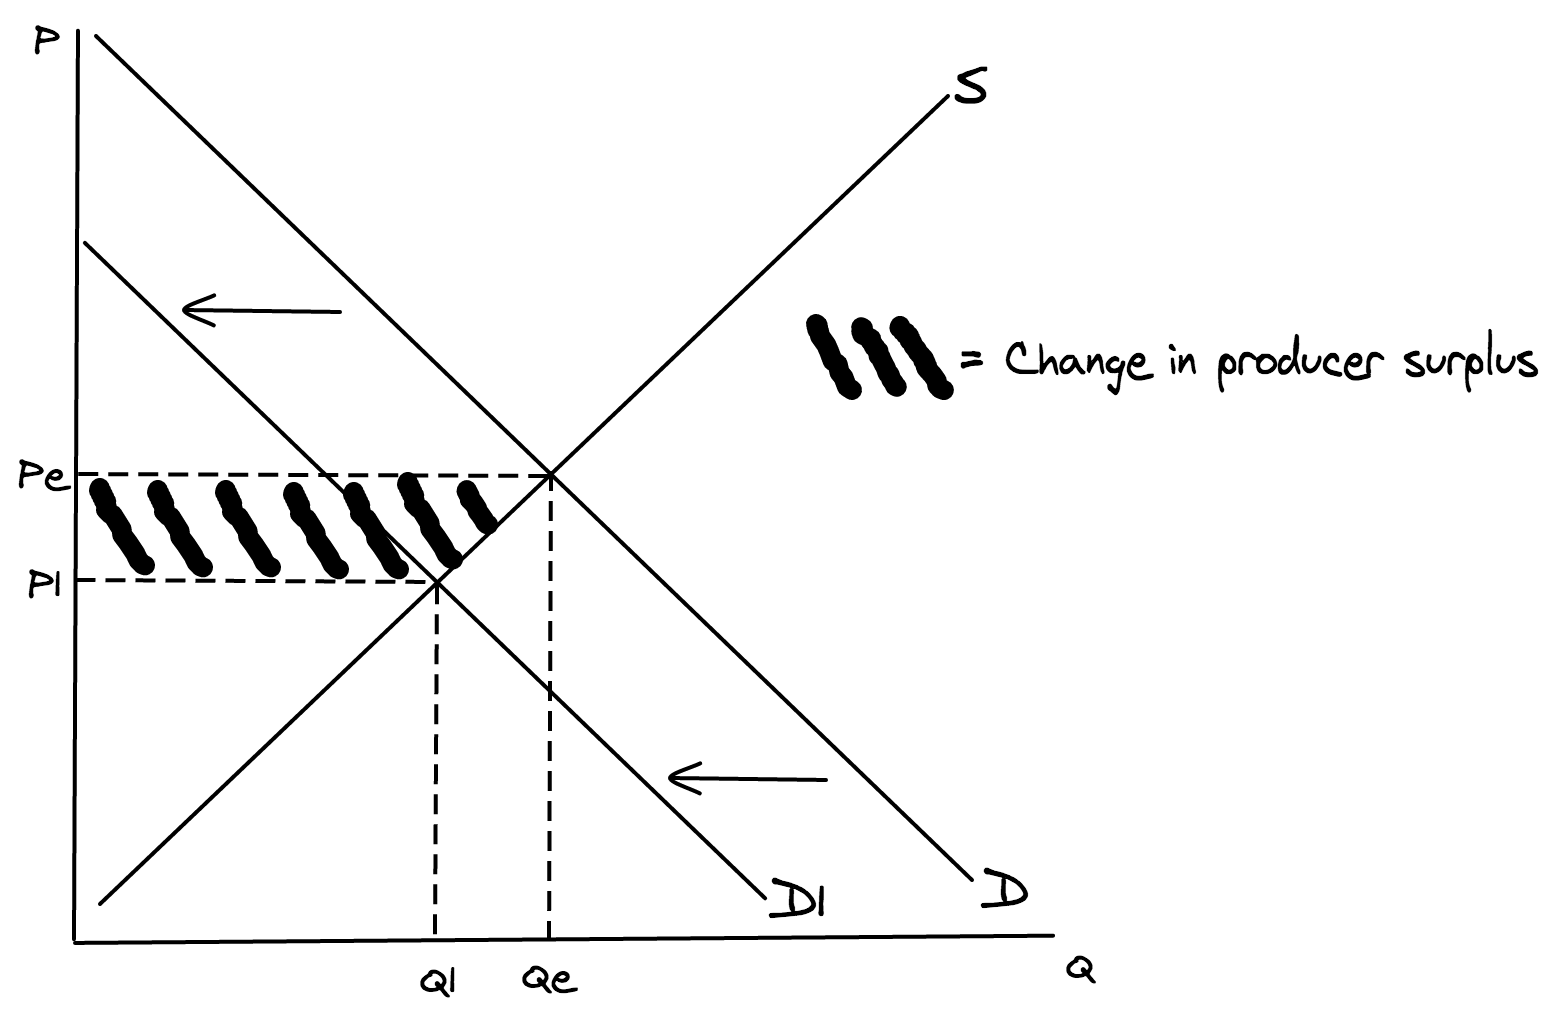
Terrorist attacks in Turkey have scared away prospective tourists from booking plane flights to Turkey. Sketch a diagram to show the effect of the terrorist attacks on producer surplus in the market for plane flights.
Demand for plane flights will decrease if consumers are worried about flying to Turkey, due to the recent terrorist attacks.
To score full marks in your exam, make sure your diagram includes ALL of the following (you will lose marks if you miss any of these out):
\- Labelled axes (P and Q)
\- Labelled curves (S and D)
\- Equilibrium price (Pe)
\- Equilibrium quantity (Qe)
\- New demand curve, D1 shifted in, to the left
\- Arrows showing direction of shift from D to D1
\- New price (P1)
\- New quantity (Q1)
\- Change in producer surplus shaded in
\- Change in producer surplus labelled or a key provided (as below)
