Pop and Community Ecology Exam II
1/37
There's no tags or description
Looks like no tags are added yet.
Name | Mastery | Learn | Test | Matching | Spaced |
|---|
No study sessions yet.
38 Terms
The Optimal Defense Hypothesis states which of the following?
Plants allocate resources to defenses against herbivores in a way that maximizes plant fitness
Which of the following correctly describes the Resource Availability Hypothesis?
All of these
T/F
Secondary plant substances are by-products of the primary metabolic pathways and are not found in all plants.
True
Define the Plant Vigor Hypothesis
herbivores prefer to attack fast-growing, vigorous plants rather than slow-growing, stressed plants
Define the Plant Stress Hypothesis
herbivores prefer to attack stressed plants, which produce leaves that are higher in nitrogen
Which of the following statements is consistent with the Overcompensation Hypothesis?
As grazing pressure increases from very low to very high levels, plant production will increase at first and then decrease
Define Grazing facilitation
Grazing by one herbivore species improves the food supply available to another herbivore species
T/F
Chemicals that defend plants against herbivory are confined primarily to plants in the tropical and sub-tropical regions
False
T/F
Plants within the same species will exhibit the same set of chemical defenses against herbivory.
False
T/F
Some plants can produce both chemical and physical defenses against herbivory.
True
T/F
Resource availability affects the ability of plants to produce both chemical and physical defenses against herbivory.
True
T/F
Plants within the same species may exhibit different sets of defenses against herbivory depending on the suite of herbivore species to which they are exposed.
True
Grazing can benefit plants depending on which of the following?
All of these
What are mycorrhizae?
fungi
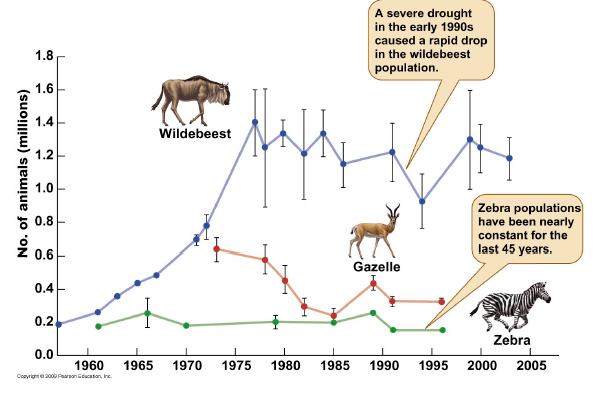
T/F
The following figure indicates strong grazing facilitation among the herbivores on the Serengeti Plains.
False
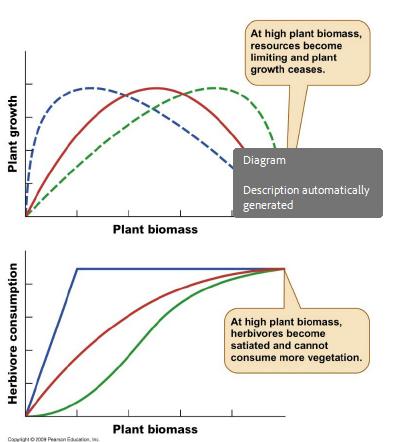
Which of the following statements about the grazing model are correct?
All of these
T/F
When an individual of one animal species kills (and may eat) an individual of a second animal species, this is defined as predation
True
Which of the following are among the most important findings of the “classical” laboratory experiments on predator-prey systems?
Predator-prey systems never were sustainable in the laboratory
Which of the following played an important role in sustaining predator-prey cycles in the “classical” laboratory experiments on predator-prey systems?
Spatial heterogeneity in habitat suitability
Which of the following population dynamics can be generated by the Lotka-Volterra predator-prey equations?
All of these
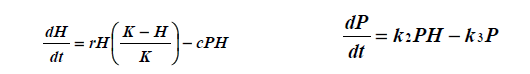
In the Lotka-Volterra predator prey equations, the k2 term represents
The ability of predators to convert prey into more predators

In the Lotka-Volterra predator prey equations, the k3 term represents
The per capita mortality rate of predators in the absence of prey
Which of the following are the types of functional responses of predators to changes in prey abundance?
Type 1, Type 2, & Type 3
Among the types of numerical responses of predators to changes in prey abundance are:
Aggregative response
Evolutionary change in two or more interacting species is called
Co-evolution
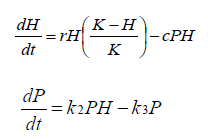
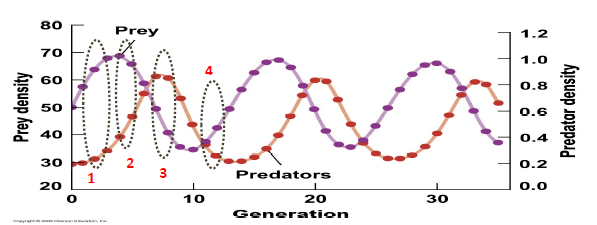
What do these represent?
mathematical representations of predator-prey interactions
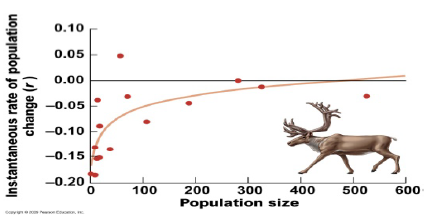
Consider the graph below of woodland caribou population growth rates observed at various population sizes. How does this graph contradict the basic theory of density-dependent population growth?
As population size increases, the population growth rate should decrease

Consider the graph above of woodland caribou population growth rates observed at various population sizes. What does this graph demonstrate?
The Allee effect
T/F
Generalist predators tend to stabilize prey numbers
True
T/F
Specialist predators tend to cause instability in prey numbers
True
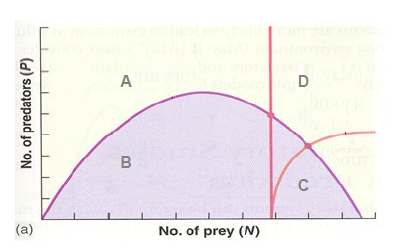
In the figure, in which area do both predator and prey populations increase?
C
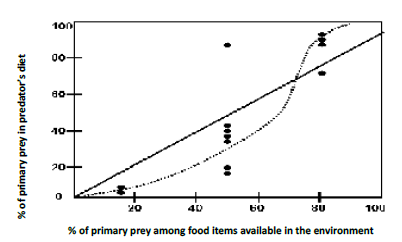
What does the graph represent?
Predator “switching” to alternative prey as a function of relative prey abundance
What does the graph represent?
All of these
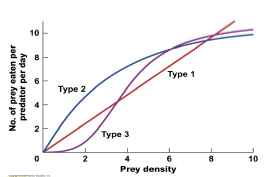
Which statements about the graph are correct?
The Type 1 curve represents a linear numerical response of predators to changes in prey density
Which of the following are among the most important aspects of predator-prey relationships that are ignored or simplified in both the mathematical theory and the classic laboratory experiments, which make the theoretical and laboratory results difficult to apply in field?
All of these
T/F
If the percent mortality imposed by the predator population on the prey population increases as prey population density increases, then the predator population may control the prey population.
True
T/F
For predators to play an important role in the evolution of prey characteristics, they must be able to limit the density of their prey species
True
The hypothetical example of the sticky-tongued frog and the slippery-footed fly serves to demonstrate which of the following?
Co-evolution