AS BIOLOGY PAST PAPER QUESTIONS
1/87
There's no tags or description
Looks like no tags are added yet.
Name | Mastery | Learn | Test | Matching | Spaced |
|---|
No study sessions yet.
88 Terms
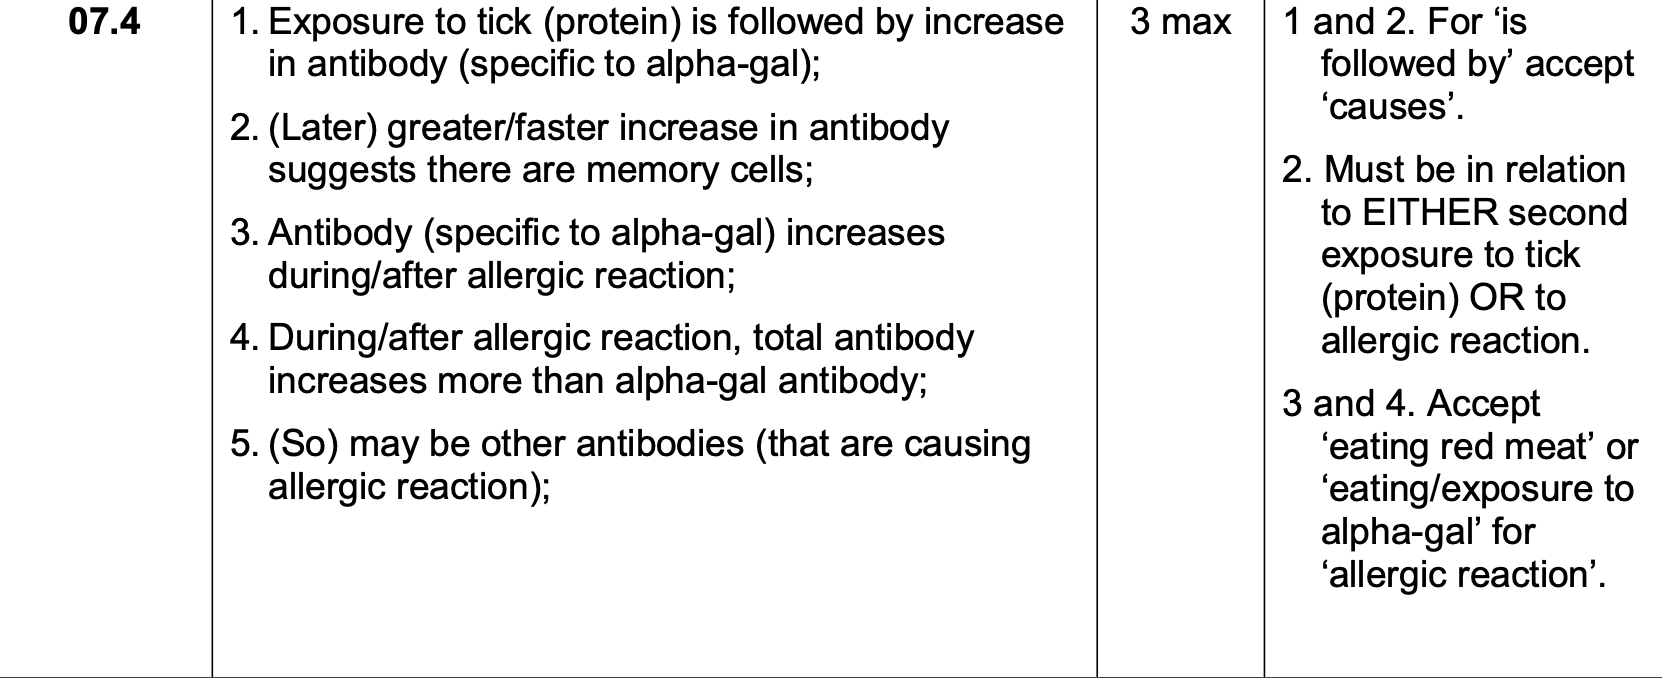
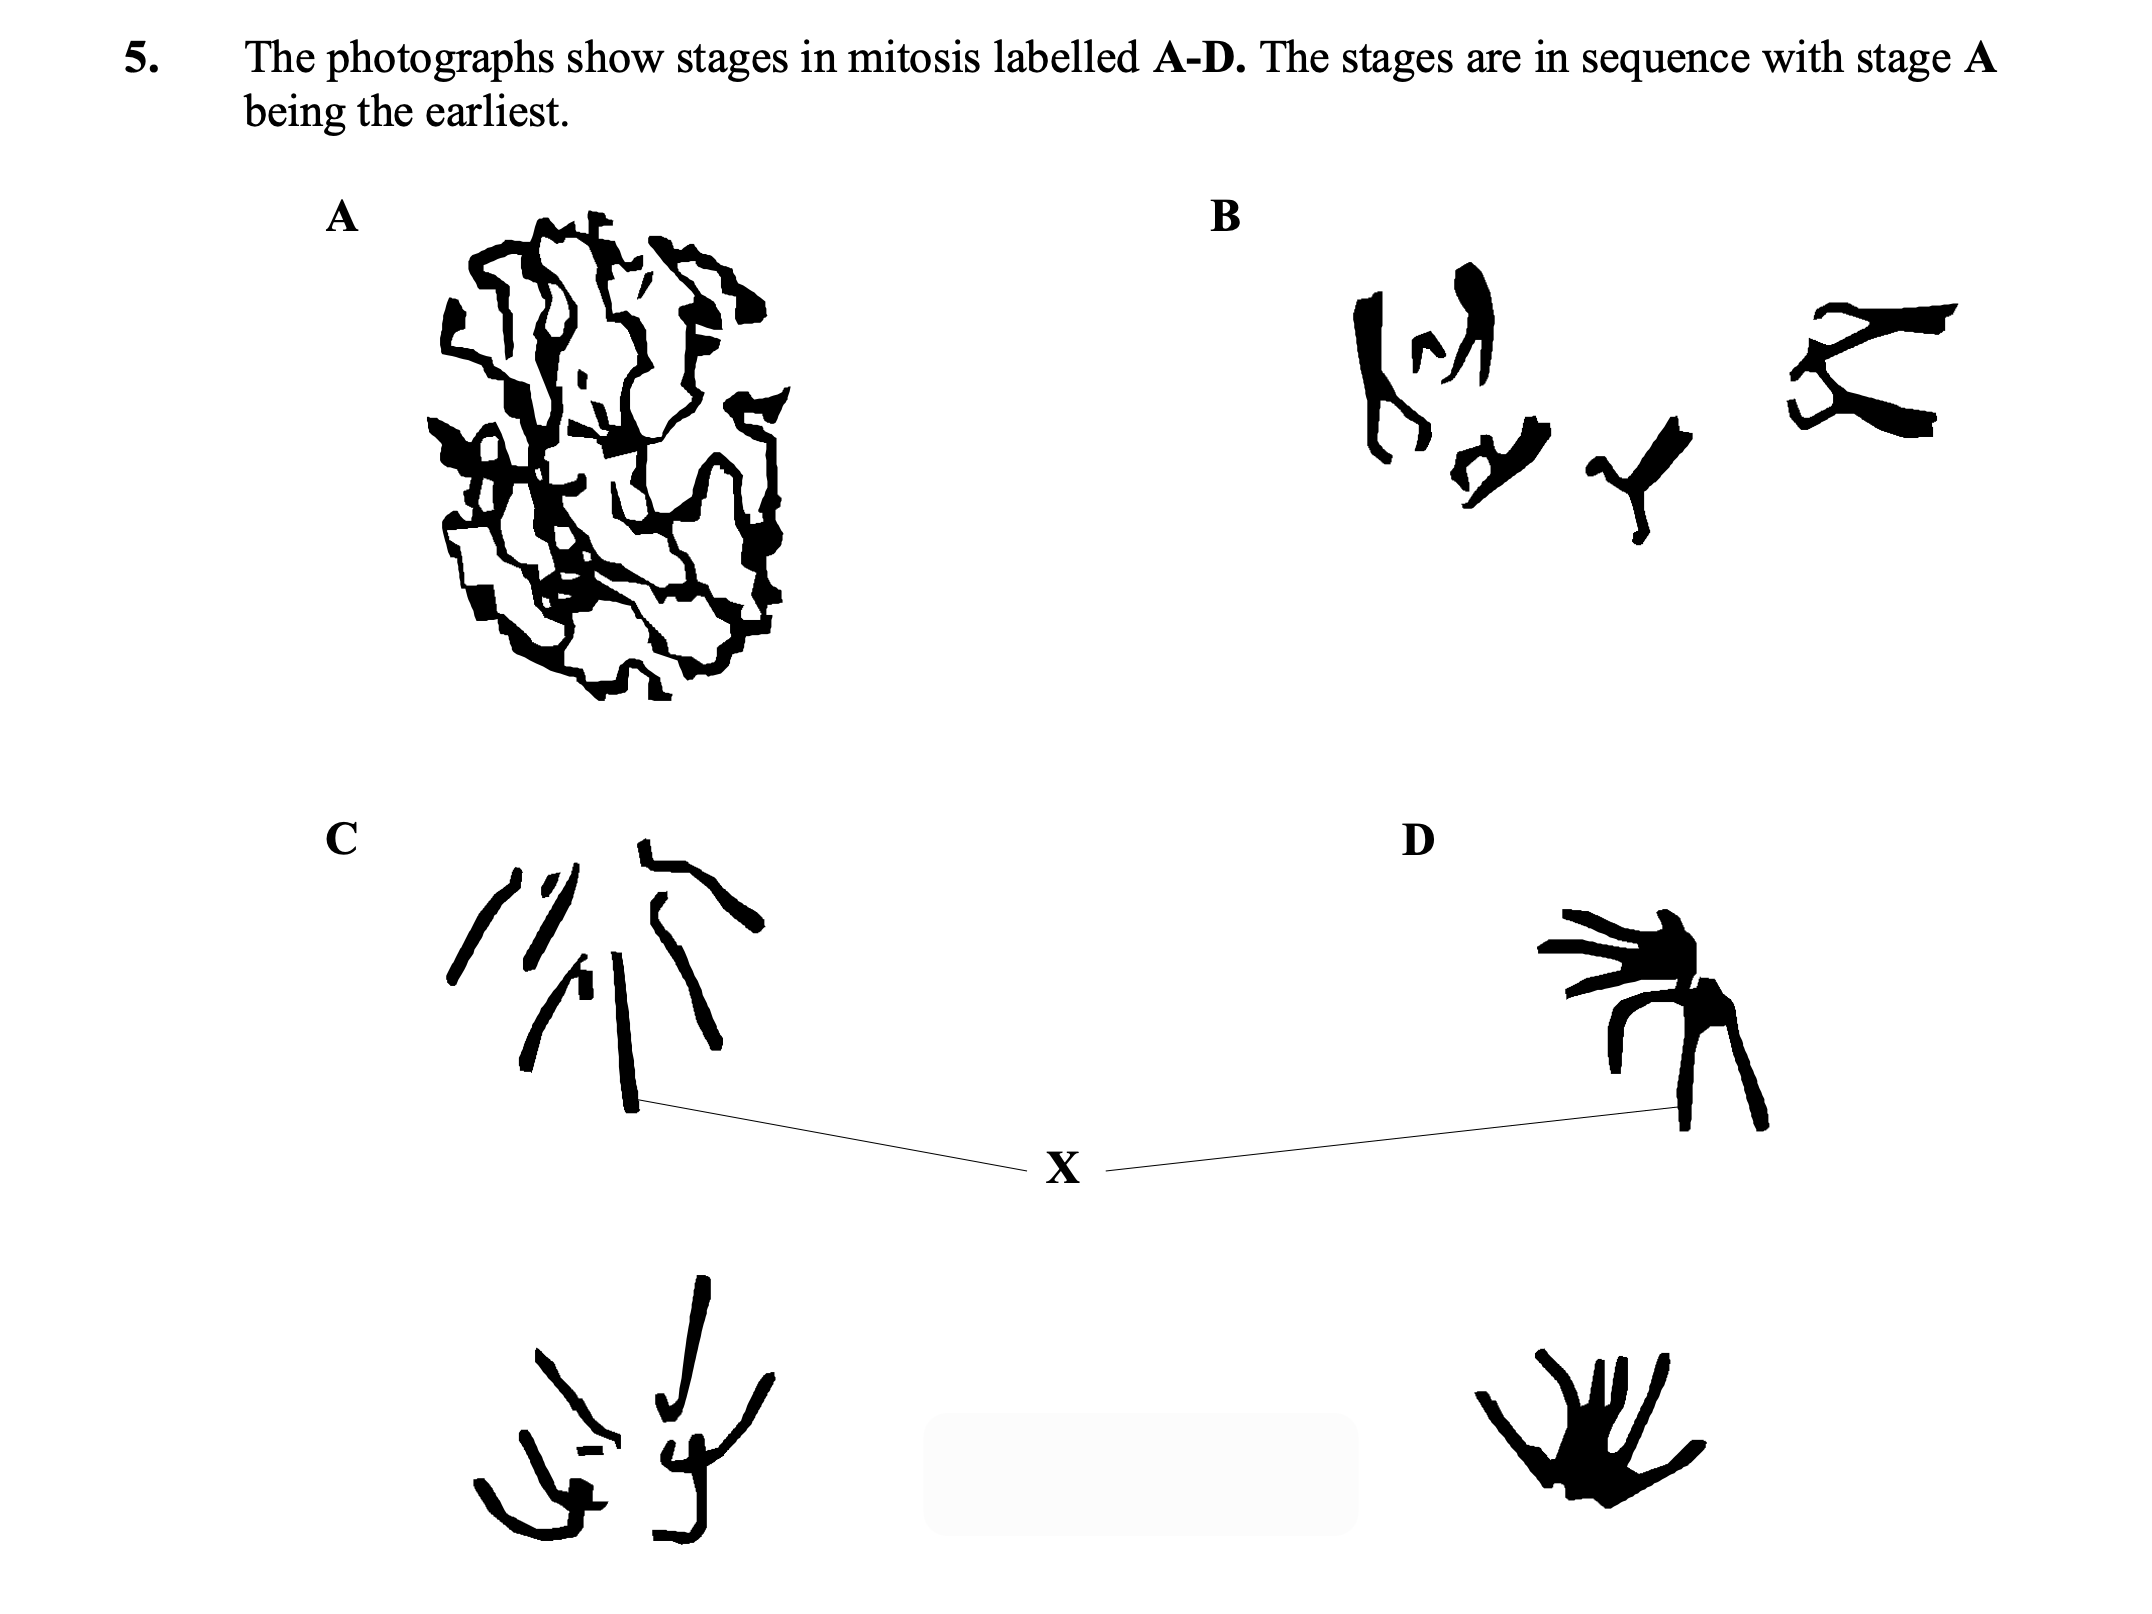
Name the three phases of mitosis shown by C, D and E on the figure
above.
Describe the role of the spindle fibres and the behaviour of the
chromosomes during each of these phases.
b) 1. C = prophase and
D = metaphase and
E = anaphase;
2. (In) prophase, chromosomes condense;
Accept chromatin for ‘chromosomes’ and for
‘condense’, shorten and thicken
3. (In) prophase OR metaphase, centromeres attach to spindle fibres;
4. (In) metaphase, chromosomes/pairs of chromatids at
equator/centre of spindle/cell;
5. (In) anaphase, centromeres divide;
6. (In) anaphase, chromatids (from each pair) pulled to (opposite)
poles/ends (of cell);
Accept for ‘chromatids’, chromosomes but reject
homologous chromosomes
7. (In) prophase/metaphase/anaphase, spindle fibres shorten;
If mark point 1 is not credited = 4 max
Do not carry forward error from 1.
Accept letters for stages as indicated in 1.
Accept for ‘shorten’, contract
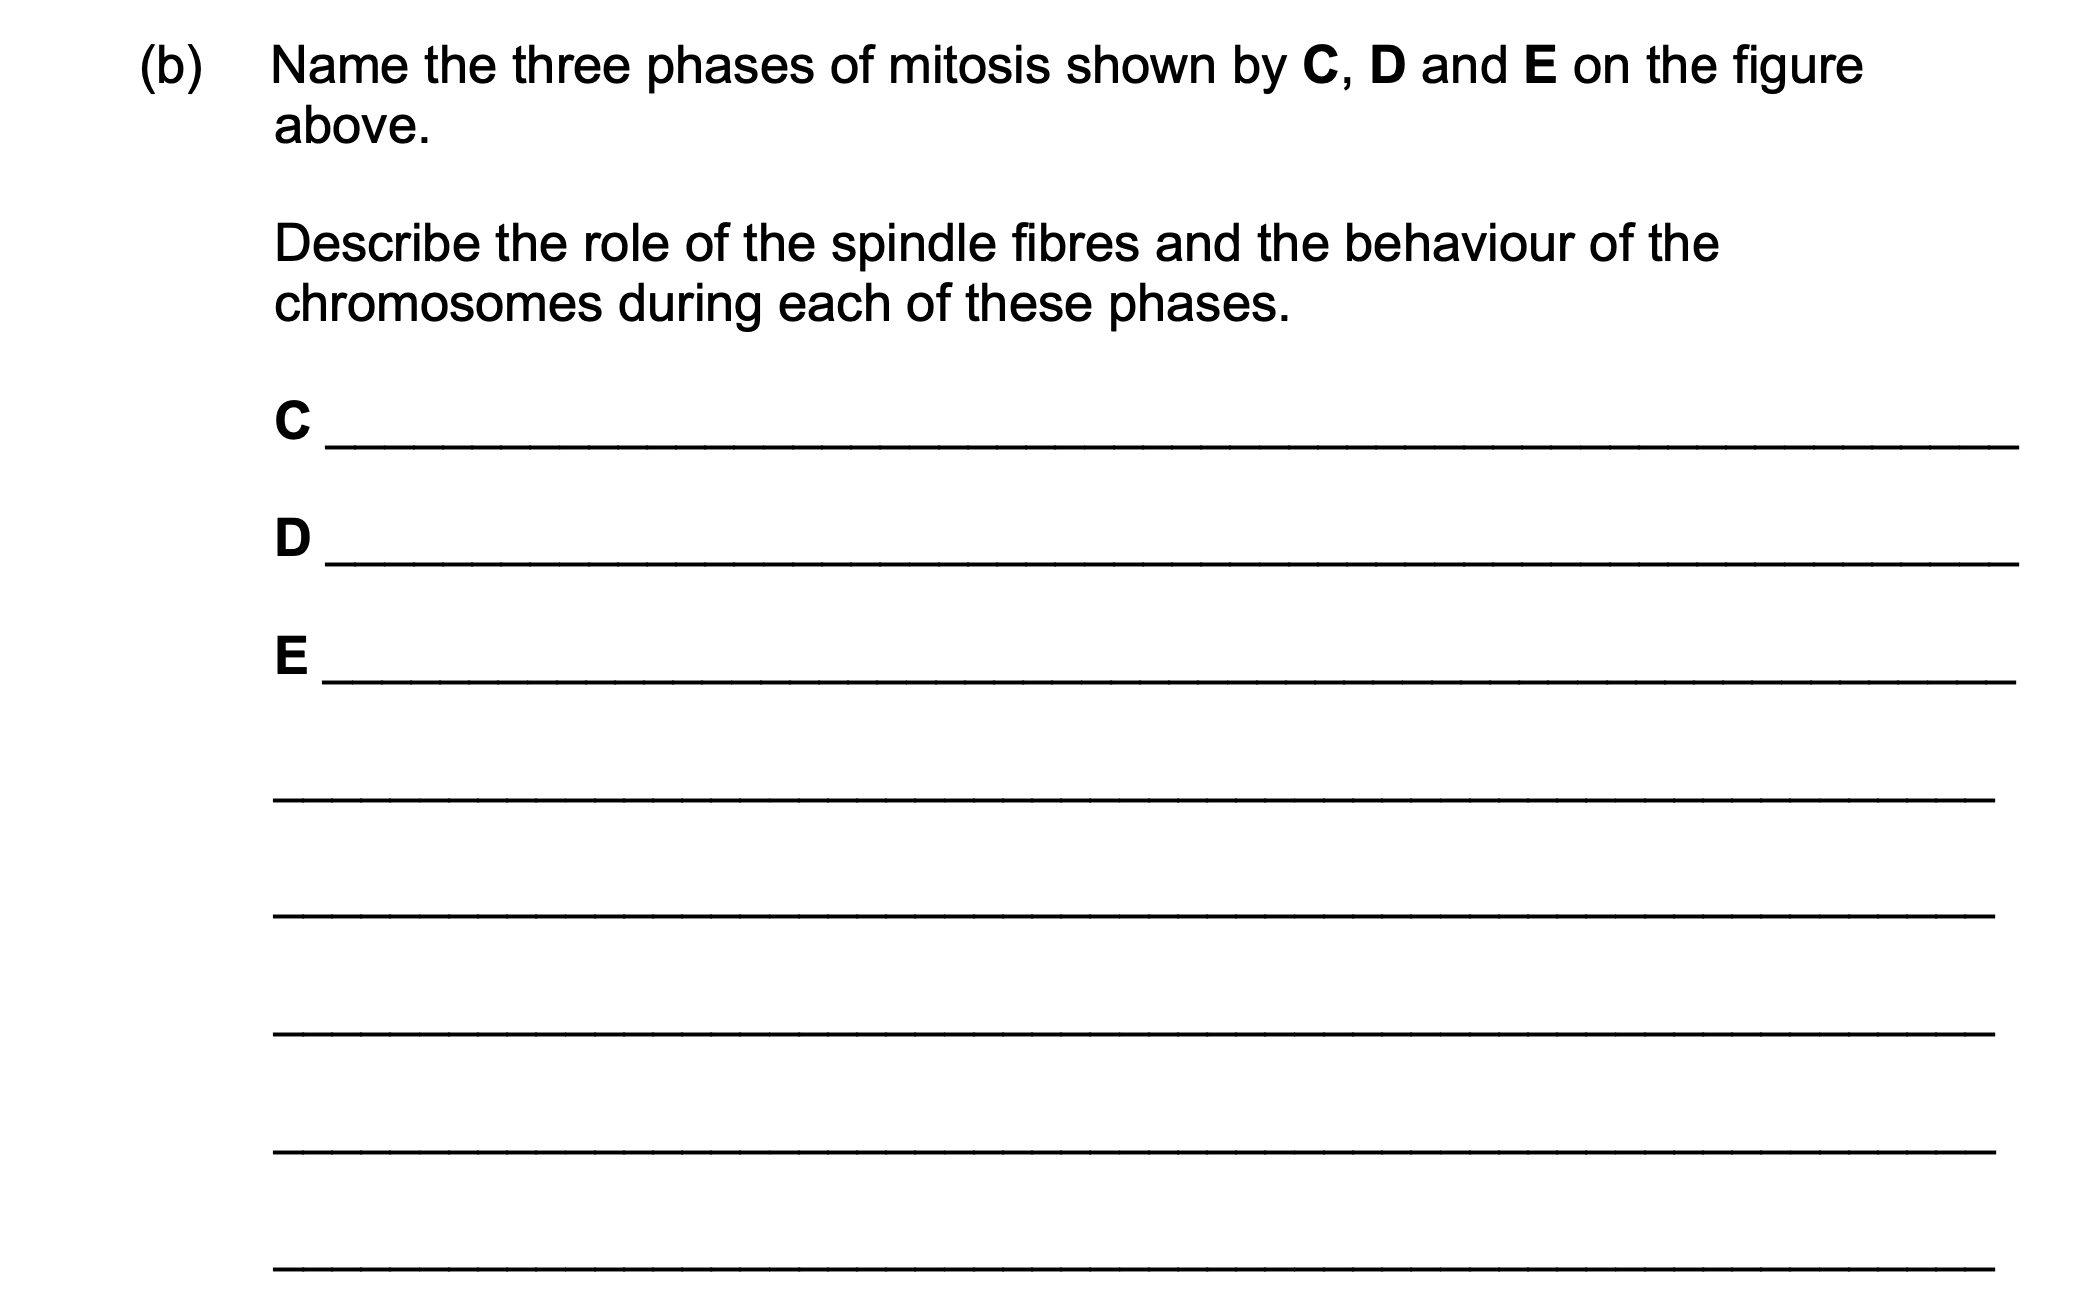
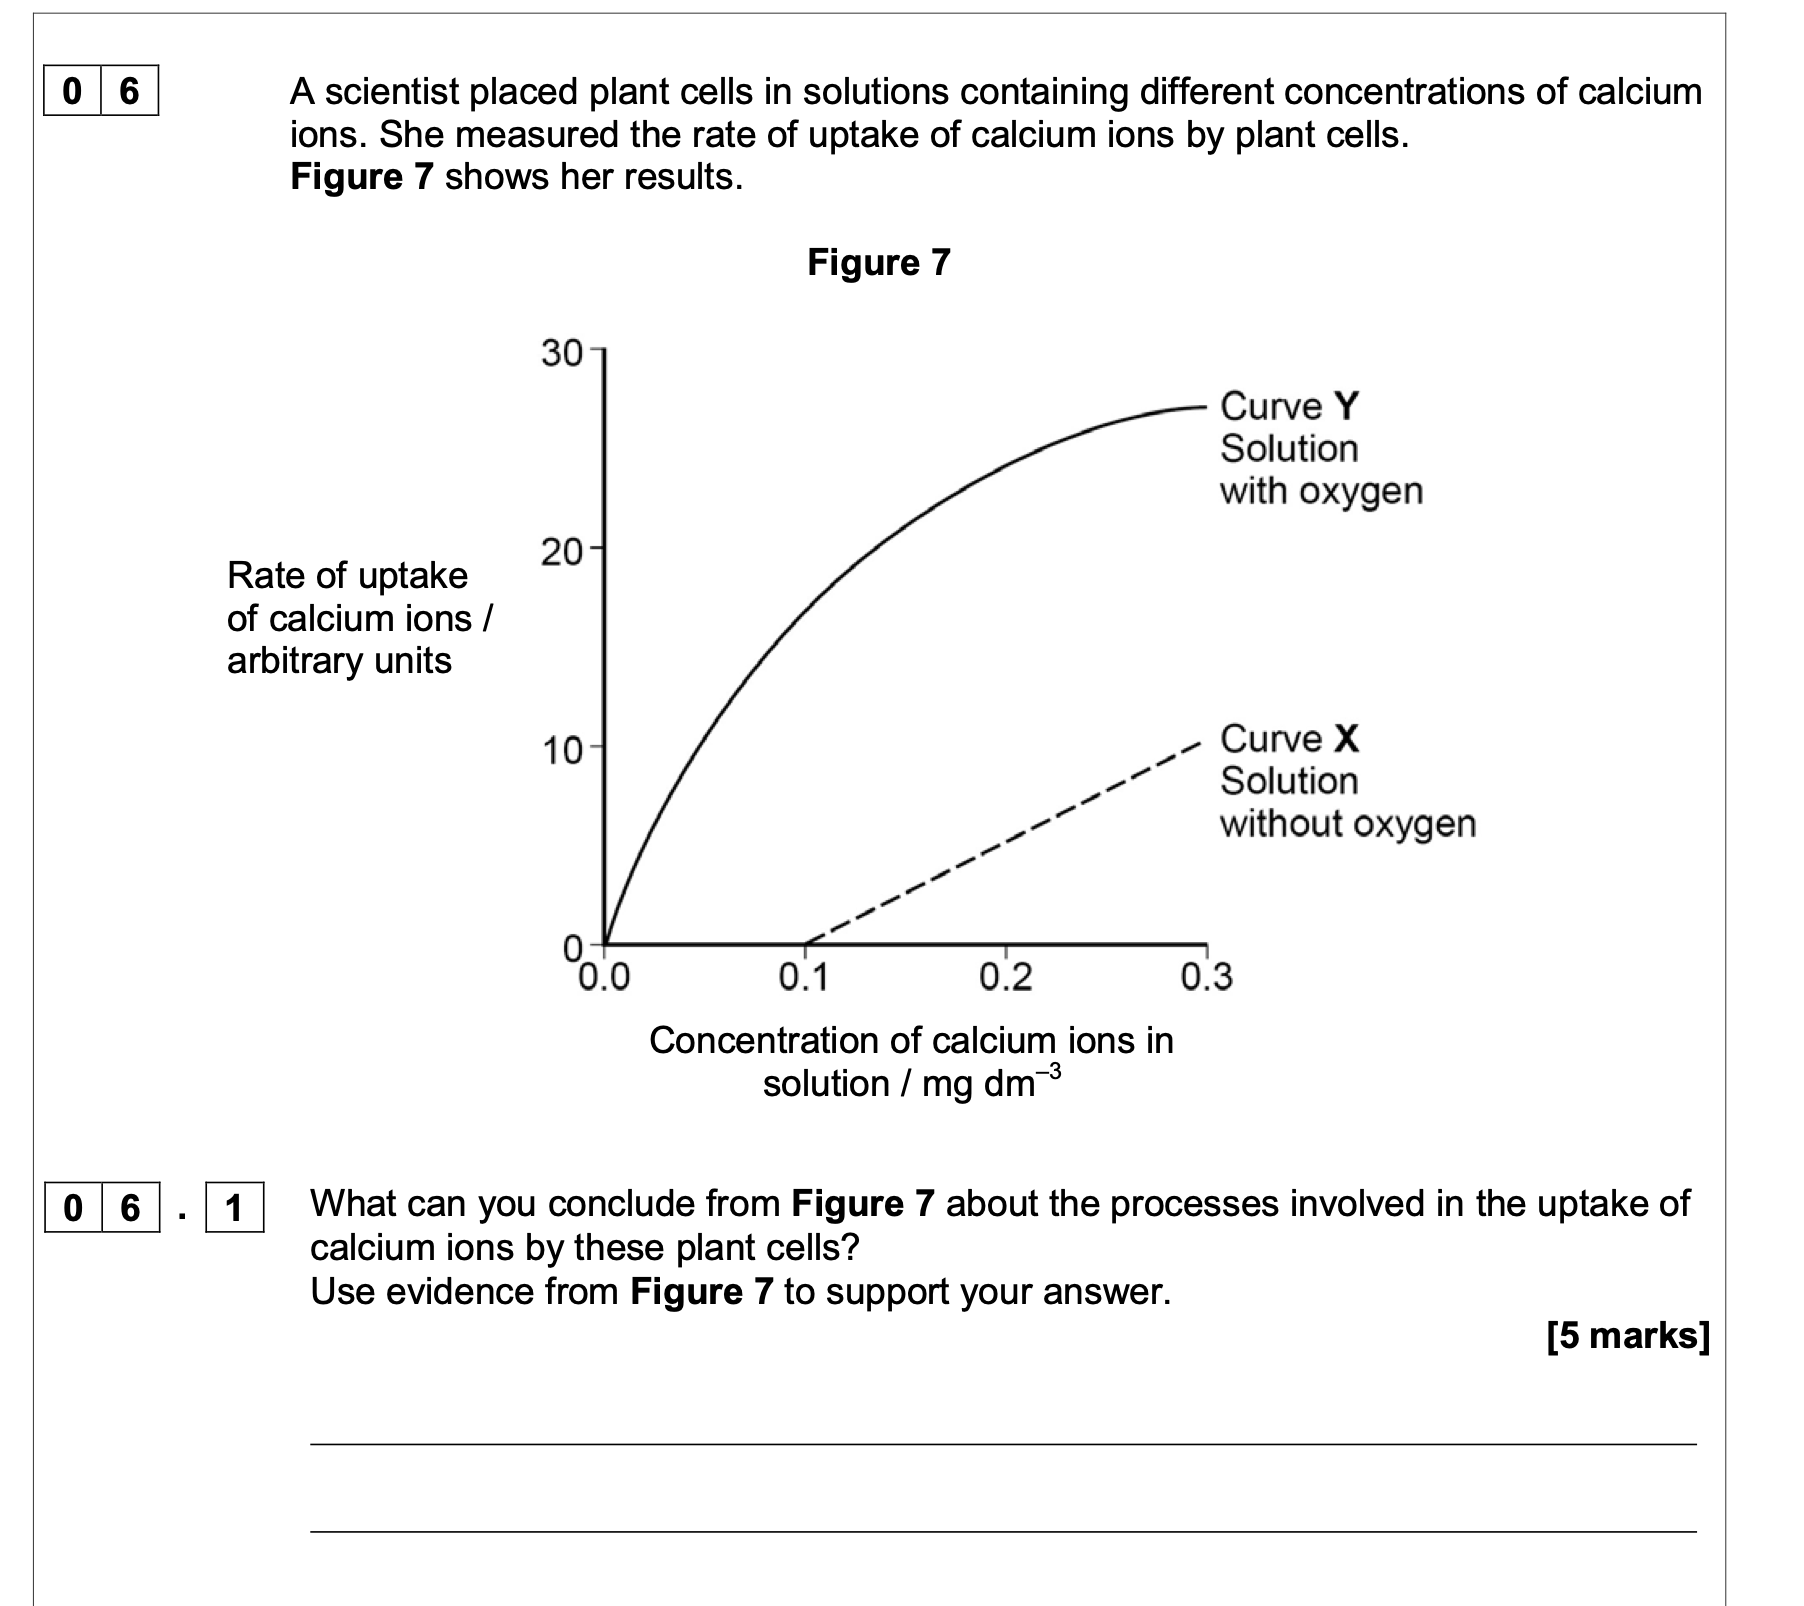
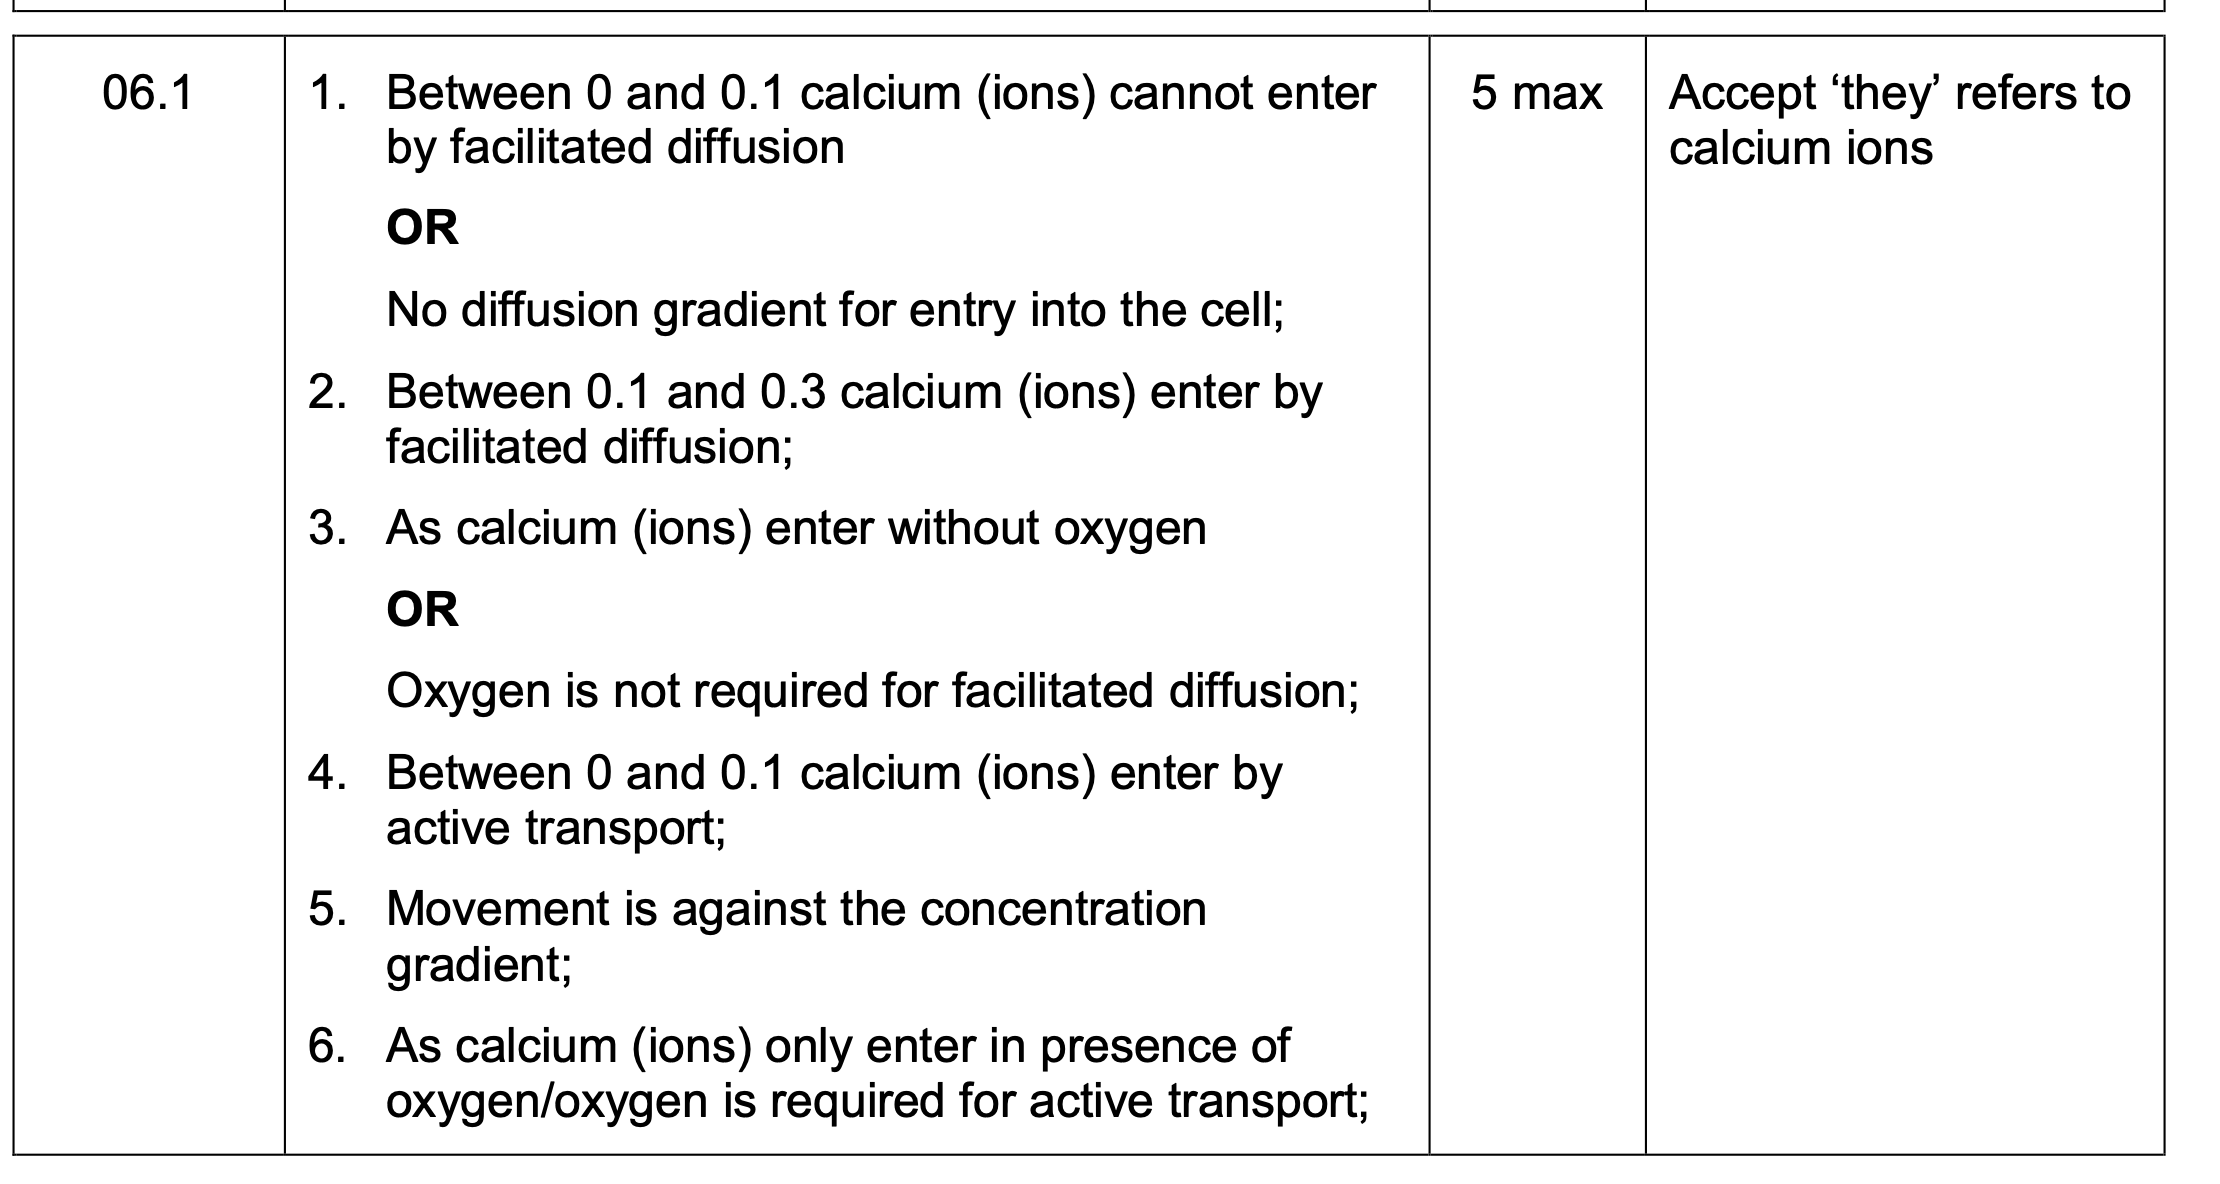
explain results shown in figure above
Group A – initial uptake slower because by diffusion (only);
Group A – levels off because same concentrations inside cells
and outside cells / reached equilibrium;
Group B – uptake faster because by diffusion plus active
transport;
Group B fails to level off because uptake against gradient / no
equilibrium to be reached;
Group B – rate slows because few / fewer chloride ions in
external solution / respiratory substrate used up.
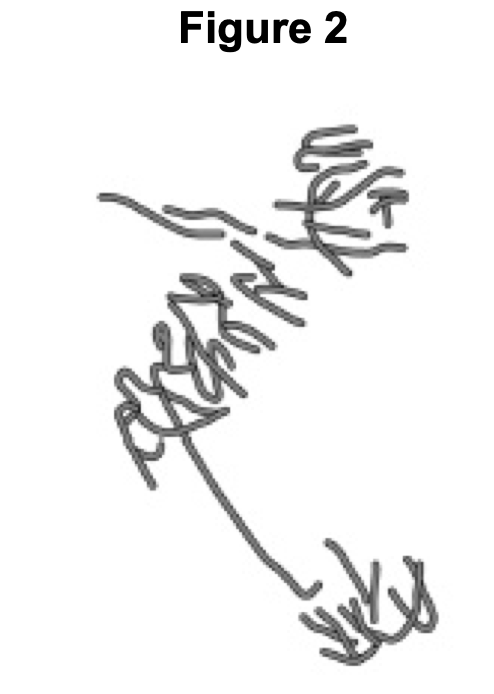
A scientist treated growing tips of onion roots with a chemical that stops roots growing. After 24 hours, he prepared a stained squash of these root
tips. Figure 2 is a drawing showing the chromosomes in a single cell observed in the squash of one of these root tips in anaphase. This cell was typical of other cells in anaphase in these root tips. Use all of this information to suggest how the chemical stops the growth of roots
1. Stops anaphase / cell division / mitosis;
Accept prevents telophase / cytokinesis
2. 3. 4. (By) stopping / disrupting / spindle fibres forming / attaching / pulling;
Ignore affects anaphase
Preventing separation of (sister) chromatids;
Ignore chromosomes separate / split
Accept chromatids split
(So) no new cells added (to root tip);
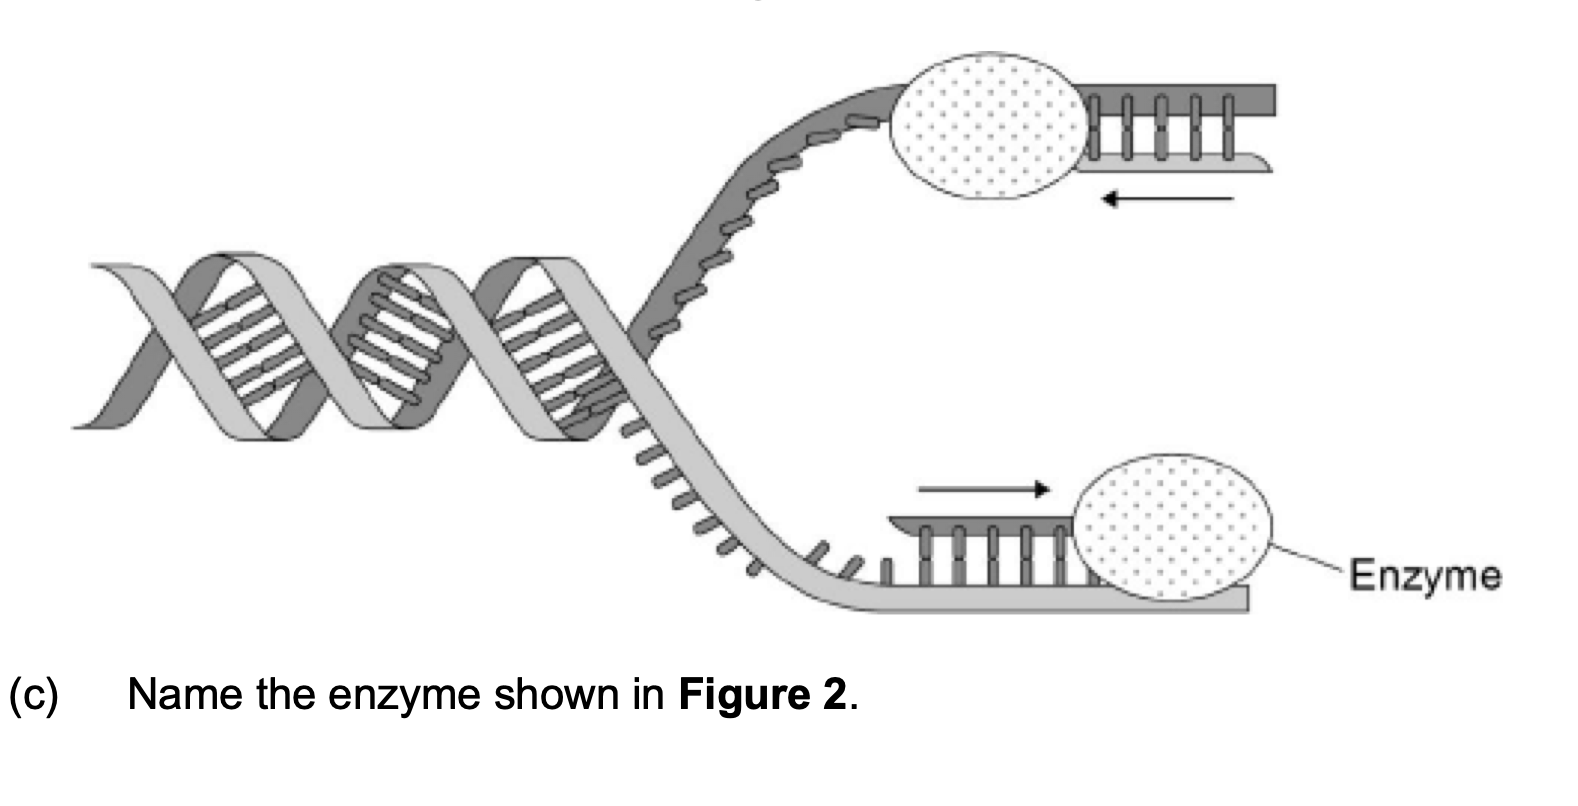
The arrows in Figure 2
show the directions in which
each new DNA strand is
being produced.
(d) Use Figure 1,
Figure 2 and your knowledge
of enzyme action to explain
why the arrows point in opposite directions.
______________________________________
1. 2. 3. 4. (Figure 1 shows) DNA has antiparallel strands / described;
(Figure 1 shows) shape of the nucleotides is different /
nucleotides aligned differently;
Enzymes have active sites with specific shape;
Only substrates with complementary shape / only the 3’ end
can bind with active site of enzyme / active site of DNA
polymerase.
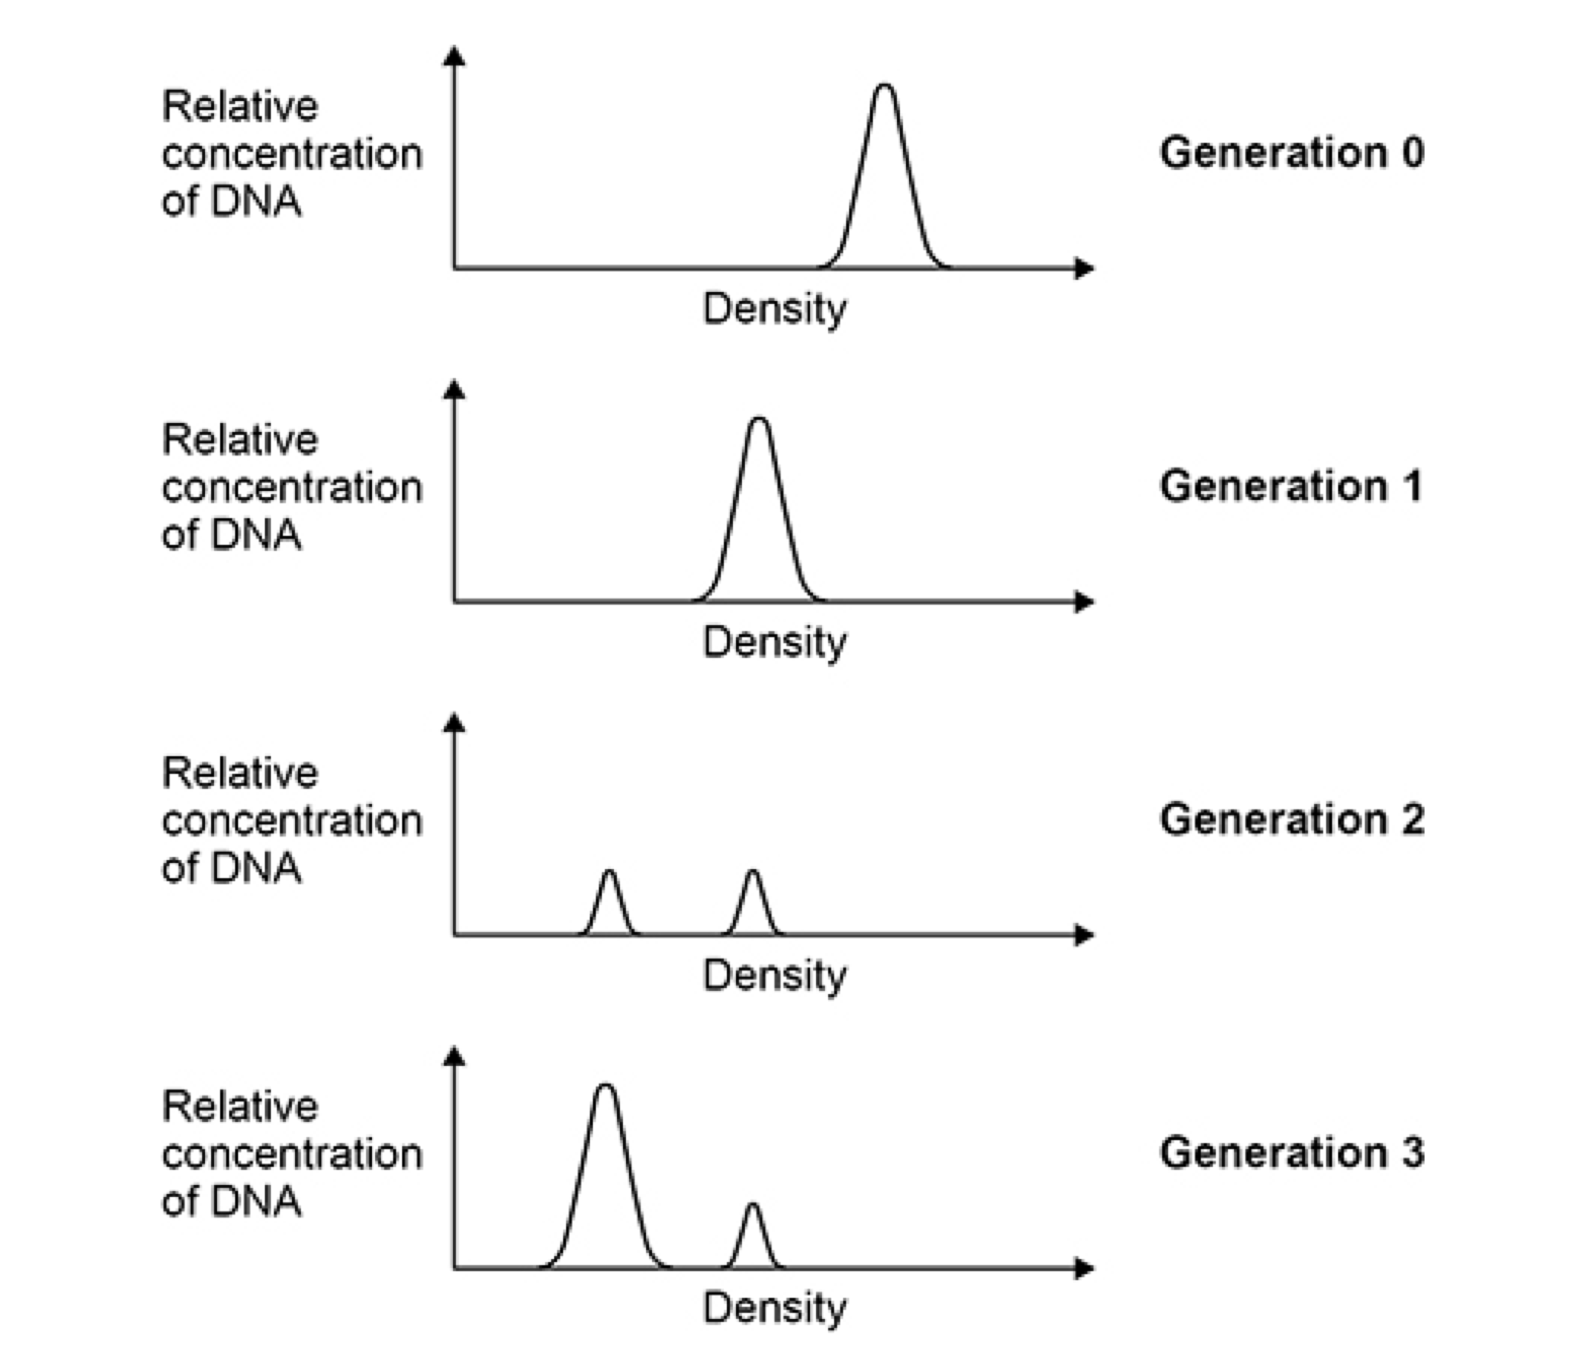
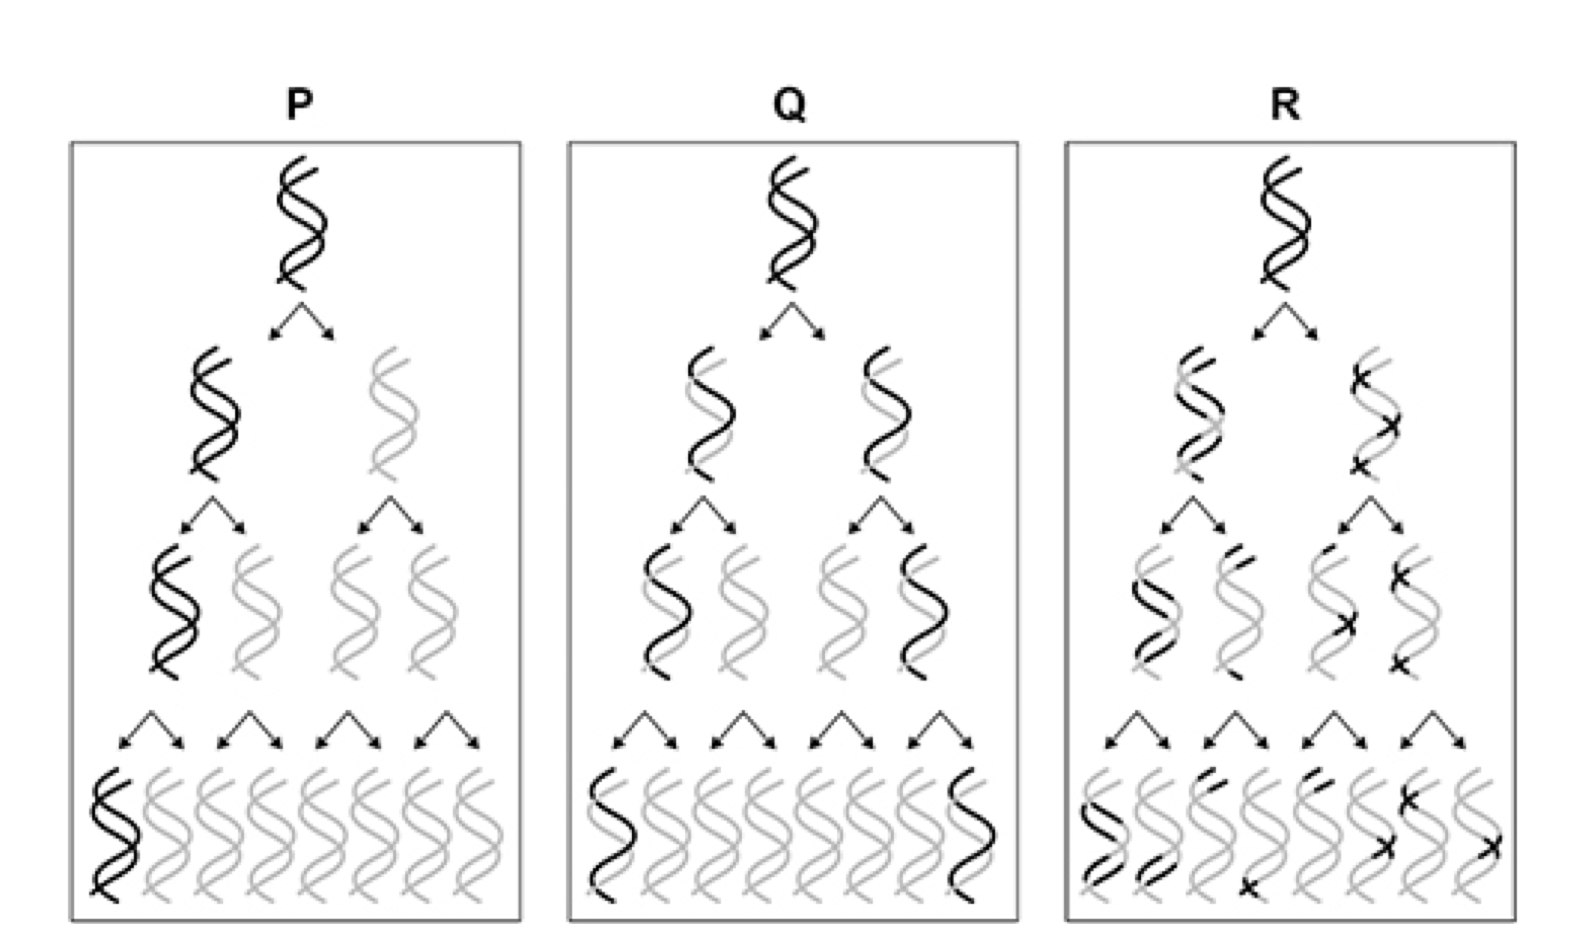
(c) Which of these models, P, Q or R, is supported by the results shown in
Figure 2?
Give the letter and name of the model supported and explain why the
results do not support the other models.
(b) Correct answer for 2 marks, 0.8376308/0.84/0.8 (hours);;
Accept for 1 mark,
Evidence of 4 x 10⁶ and 3 x 10⁹ (written in any format, for correct readings
from graph)
OR
Evidence of 9.550746785 (correct number of generations)
OR
Evidence of 1.1938443348 (correct generations/ hour)
OR
Evidence of 50.26 (correct generation time in minutes)
AQA Biology A-Level - Nucleic Acids MS PhysicsAndMathsTutor.com
Incorrect reading of graph, 3 x 10⁶ and 2 x 10⁹
Accept for 1 mark, calculation carried out correctly
Evidence of 9.380821784 (correct calculation of number of generations)
OR
Evidence of 1.172602723 (correct calculation of generations/ hour)
OR
Evidence of 51.16822503 (correct calculation of generation time in
minutes)
OR
Evidence of 0.8528037505 (correct calculation of generation time in hours)
Incorrect reading of graph, 106.4 and 109.3 OR 106.3 and 109.2
Accept for 1 mark, calculation carried out correctly
Evidence of 9.633591475 (correct calculation of number of generations)
OR
Evidence of 1.204198934 (correct calculation of generations/ hour)
OR
Evidence of 49.82565445 (correct calculation of generation time in
minutes)
OR
Evidence of 0.8304275742 (correct calculation of generation time in hours)
OR
Evidence of 0.83, with no other working
Accept correct rounding to any number of decimal
places
2
(c) 1. (Model) Q and
(Name) Semi-conservative (replication);
Explanation
2. (Model) P (is unsupported because)
There should be two peaks in generation 1
OR
AQA Biology A-Level - Nucleic Acids MS PhysicsAndMathsTutor.com
(Only) one peak is shown in generation 1
3. OR
There should be 3:1 (ratio) of peaks in generation 2
OR
There should not be an intermediate/15N 14N peak in generation 1/2/3
OR
The original/generation 0/15N peak should be in generation 1/2/3;
(Model) R (is unsupported because)
There should be >2 peaks in generation 2/3
OR
There should be one wide/overlapping peak in generation 3;
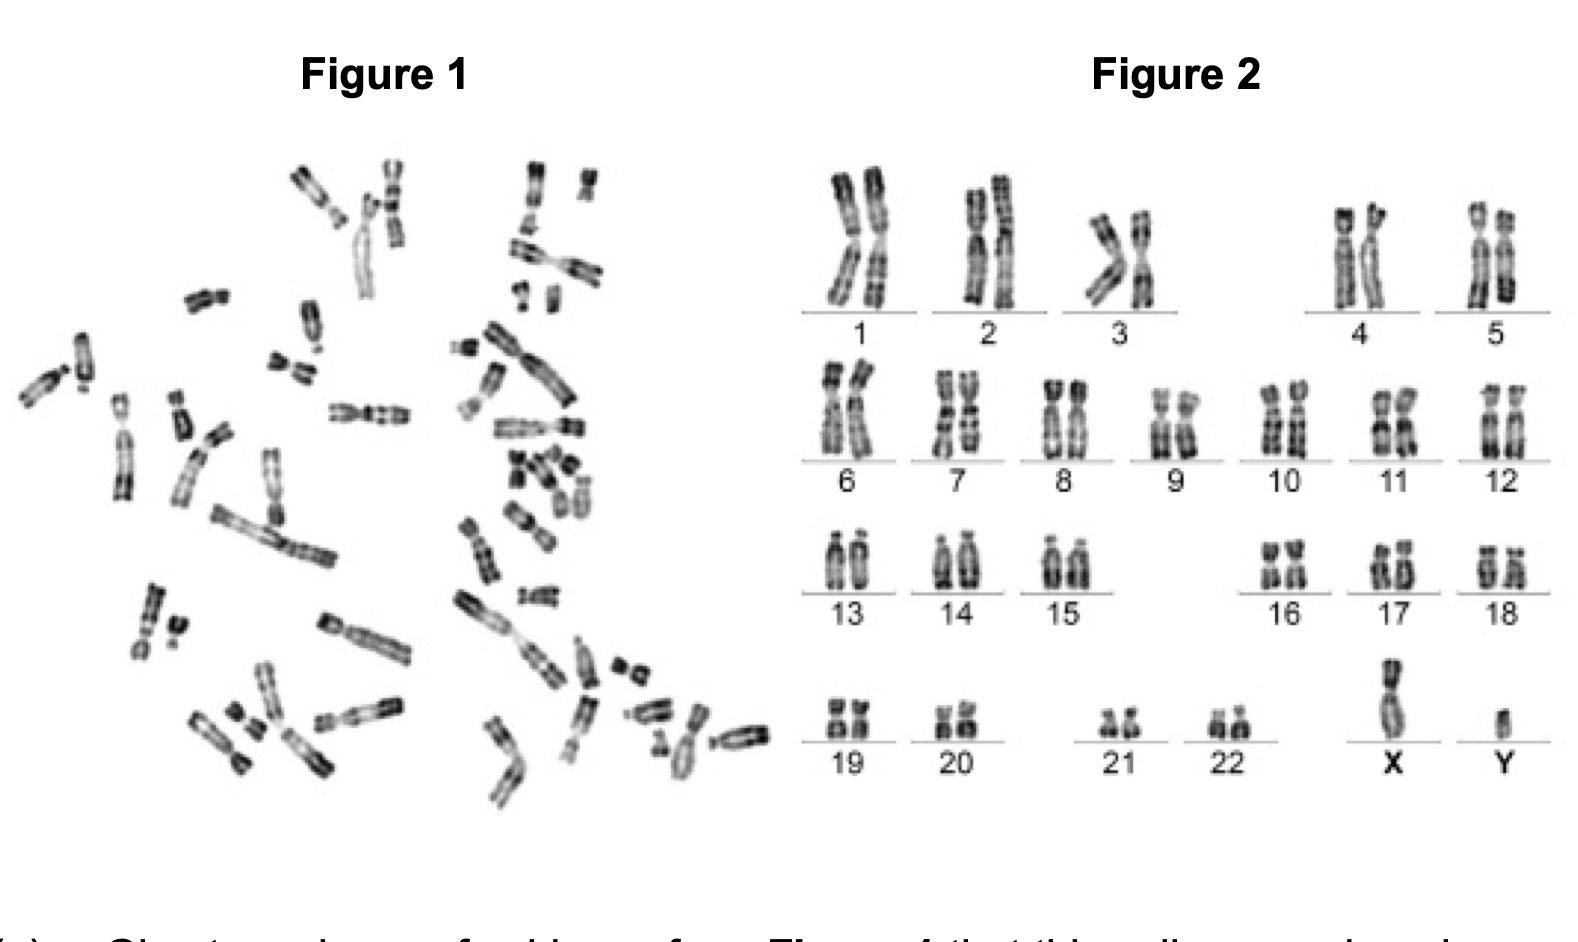
Give two pieces of evidence from Figure 1 that this cell was undergoing
mitosis. Explain your answers.
(a) 1. 2. 3. The (individual) chromosomes are visible because they have
condensed;
Both parts of each answer are required – evidence
and explanation.
For ‘they’ accept ‘chromosomes/chromatin/DNA’
Accept ‘tightly coiled’ or ‘short and thick’ for
condensed but do not accept ‘contracted’.
Ignore references to nucleus/nucleolus/nuclear
membrane.
(Each) chromosome is made up of two chromatids because DNA has
replicated;
Both parts of each answer are required – evidence
and explanation.
Accept ‘sister chromatids’ for ‘two chromatids’.
Ignore references to nucleus/nucleolus/nuclear
membrane.
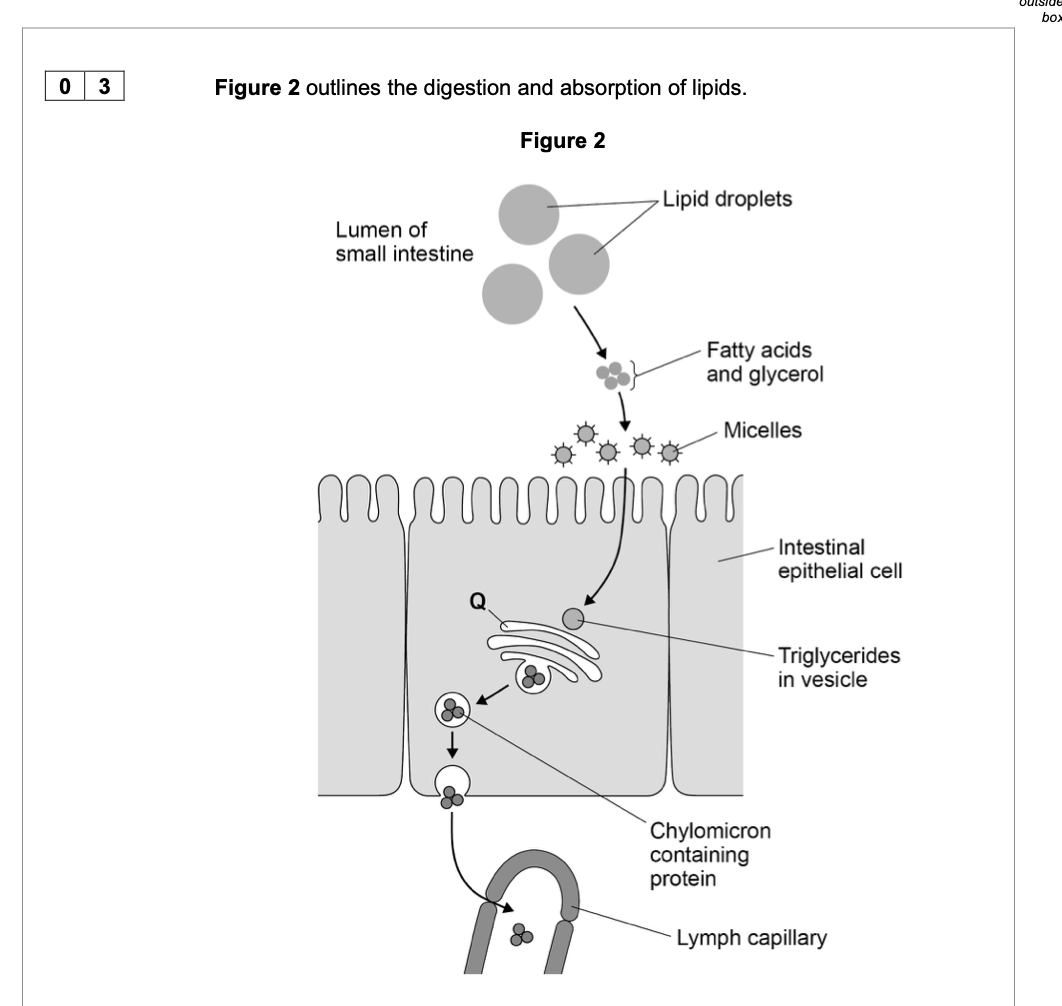
Name structure Q in Figure 2 and suggest how it is involved in the absorption of
lipids.
1. Golgi (apparatus);
2. Modifies / processes triglycerides;
3. Combines triglycerides with proteins;
4. Packaged for release / exocytosis
OR
Forms vesicles;
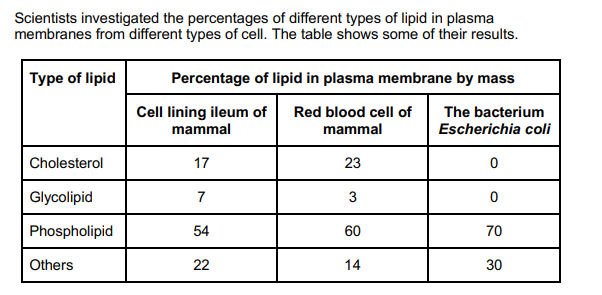
The scientists expressed their results as Percentage of lipid in plasma membrane by mass. Explain how they would find these values.
1. Divide mass of each lipid by total mass of all lipids (in that type of cell); 2. Multiply answer by 100.
(d) Use the information in the table above to calculate the number of polypeptides:
6 amino acids
20 amino acids
(d) 1. (6 amino acids in length) 1; 2. (20 amino acids in length) 2; Accept for 1 mark, 55 (2 5 + 3 15) if no other mark awarded.
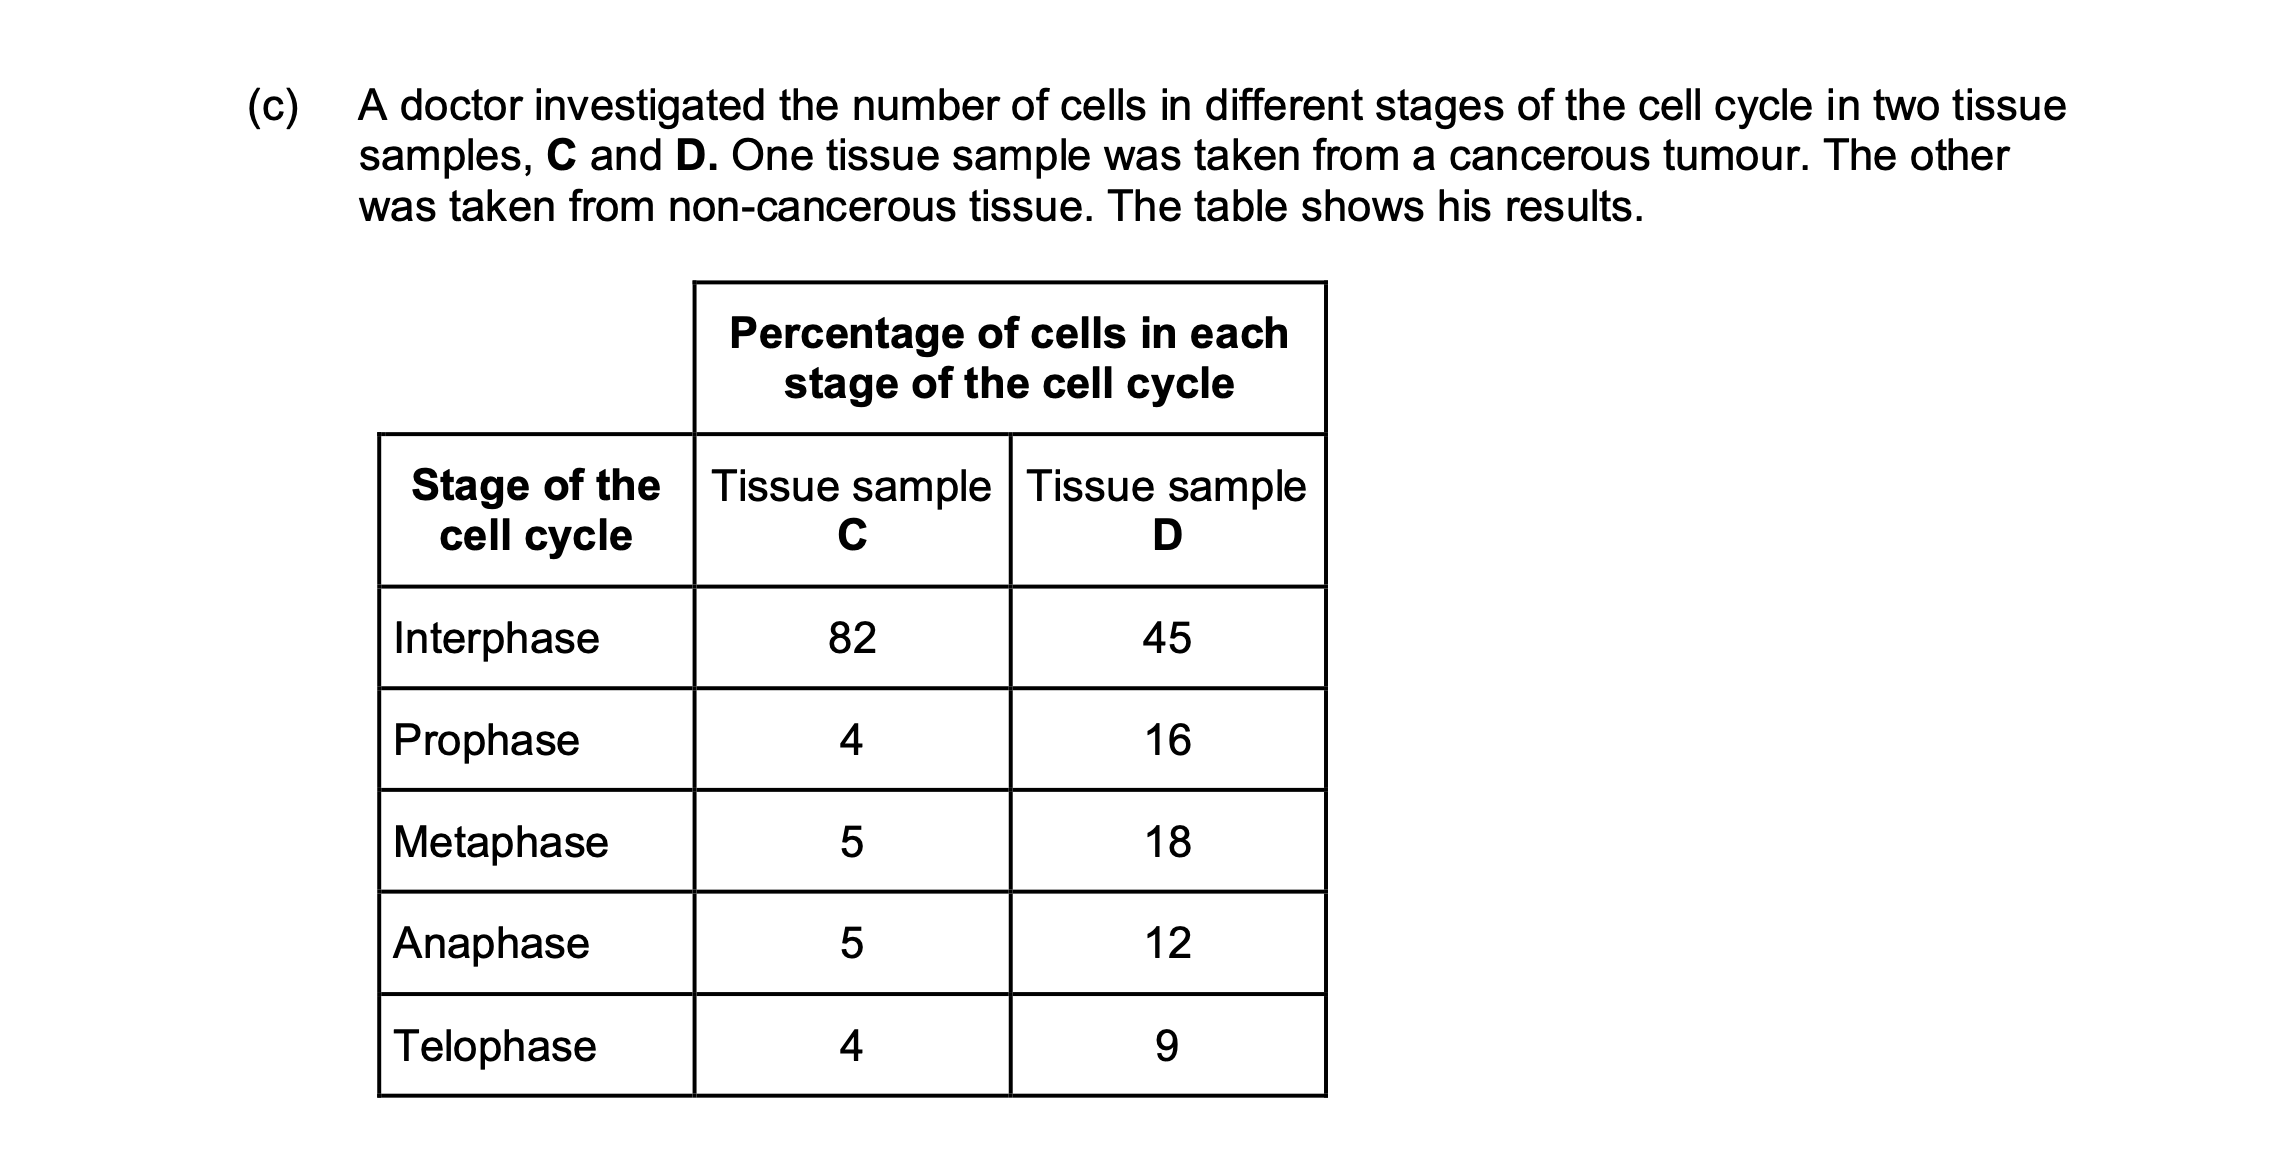
Which tissue sample, C or D, was taken from a cancerous tumour?
Use information in the table to explain your answer.
(iii) D (no mark)
1. 2. Lower % (of cells) in interphase / higher % (of cells) in mitosis / named
stage of mitosis;
1. Accept: ‘less’ or ‘more’ instead of ‘%’
1. Do not accept: higher % (of cells) in each / all stage(s)
(So) more cells dividing / cells are dividing quicker;
2. Accept: uncontrolled cell division
2. Do not award if Tissue C is chosen
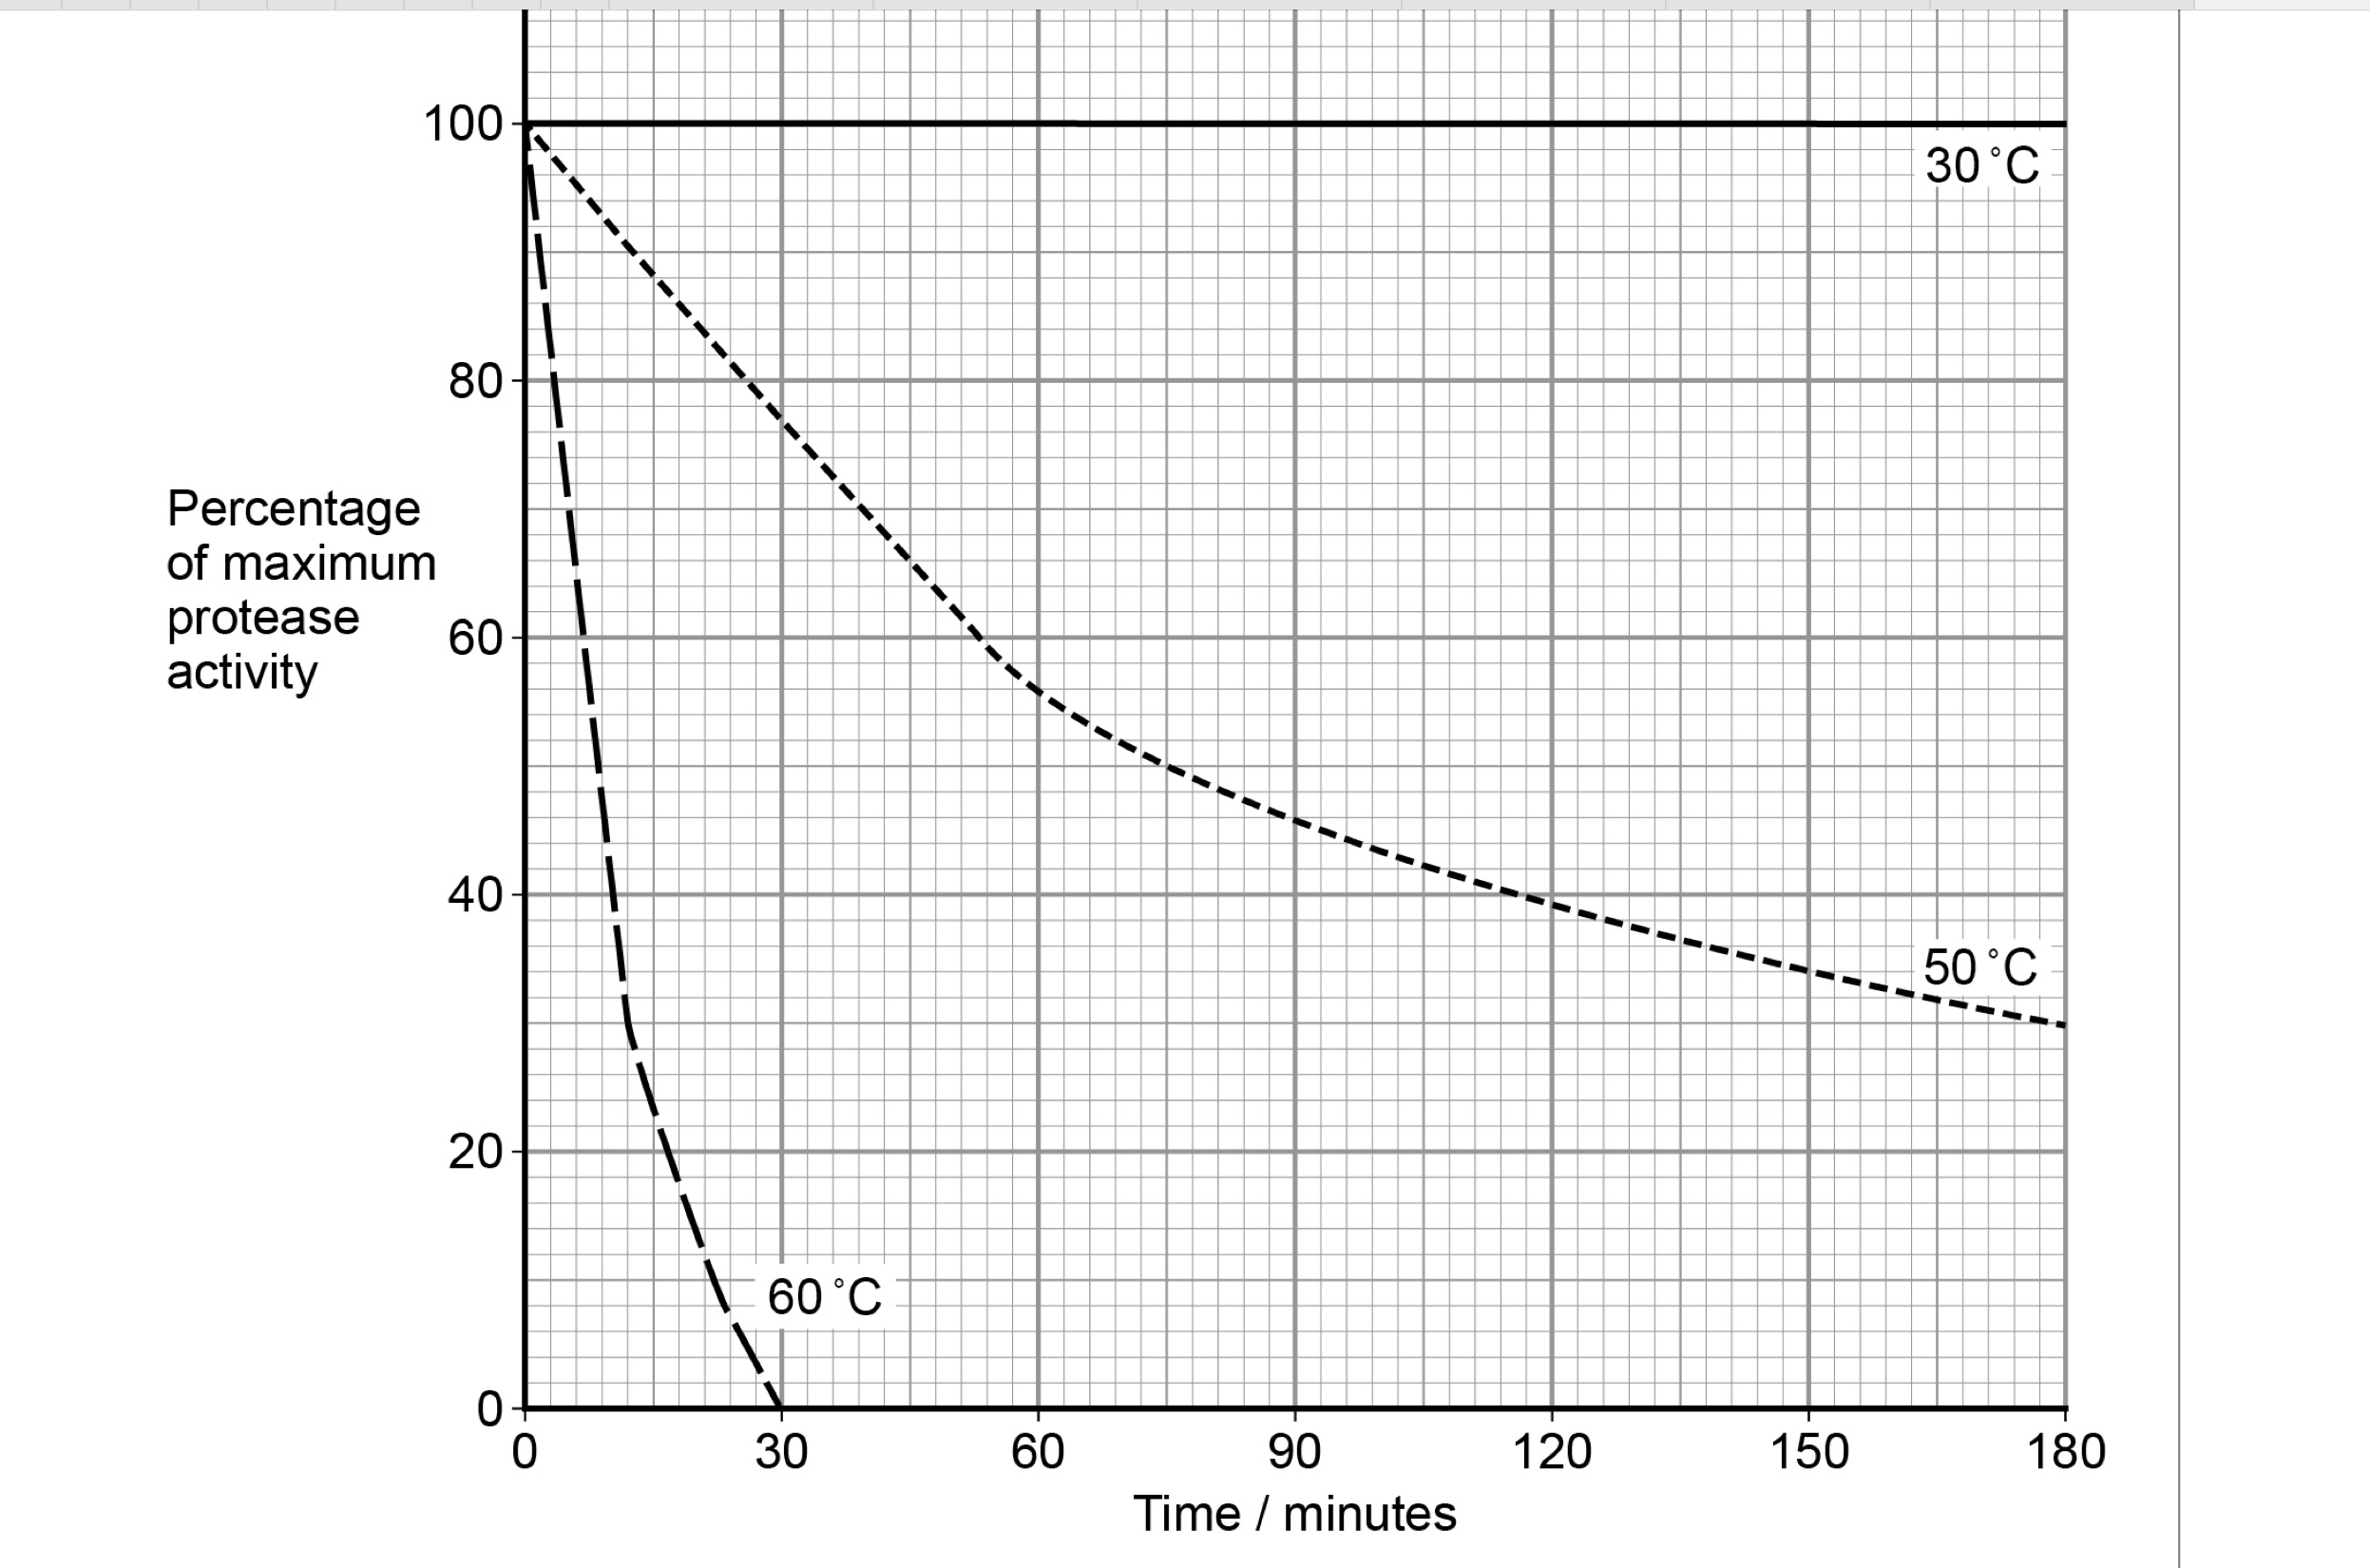
Washing powders often contain enzymes from bacteria. These enzymes include
proteases that hydrolyse proteins in clothing stains.
Figure 1 shows the effect of temperature on a protease that could be used in
washing powder.
1. Both denatured (by high temperature);
2. Denaturation faster at 60 °C due to more
(kinetic) energy;
3. Breaks hydrogen/ionic bonds (between amino
acids/R groups);
4. Change in shape of the active site/active site no
longer complementary so fewer enzyme-
substrate complexes formed/substrate does not
fit;
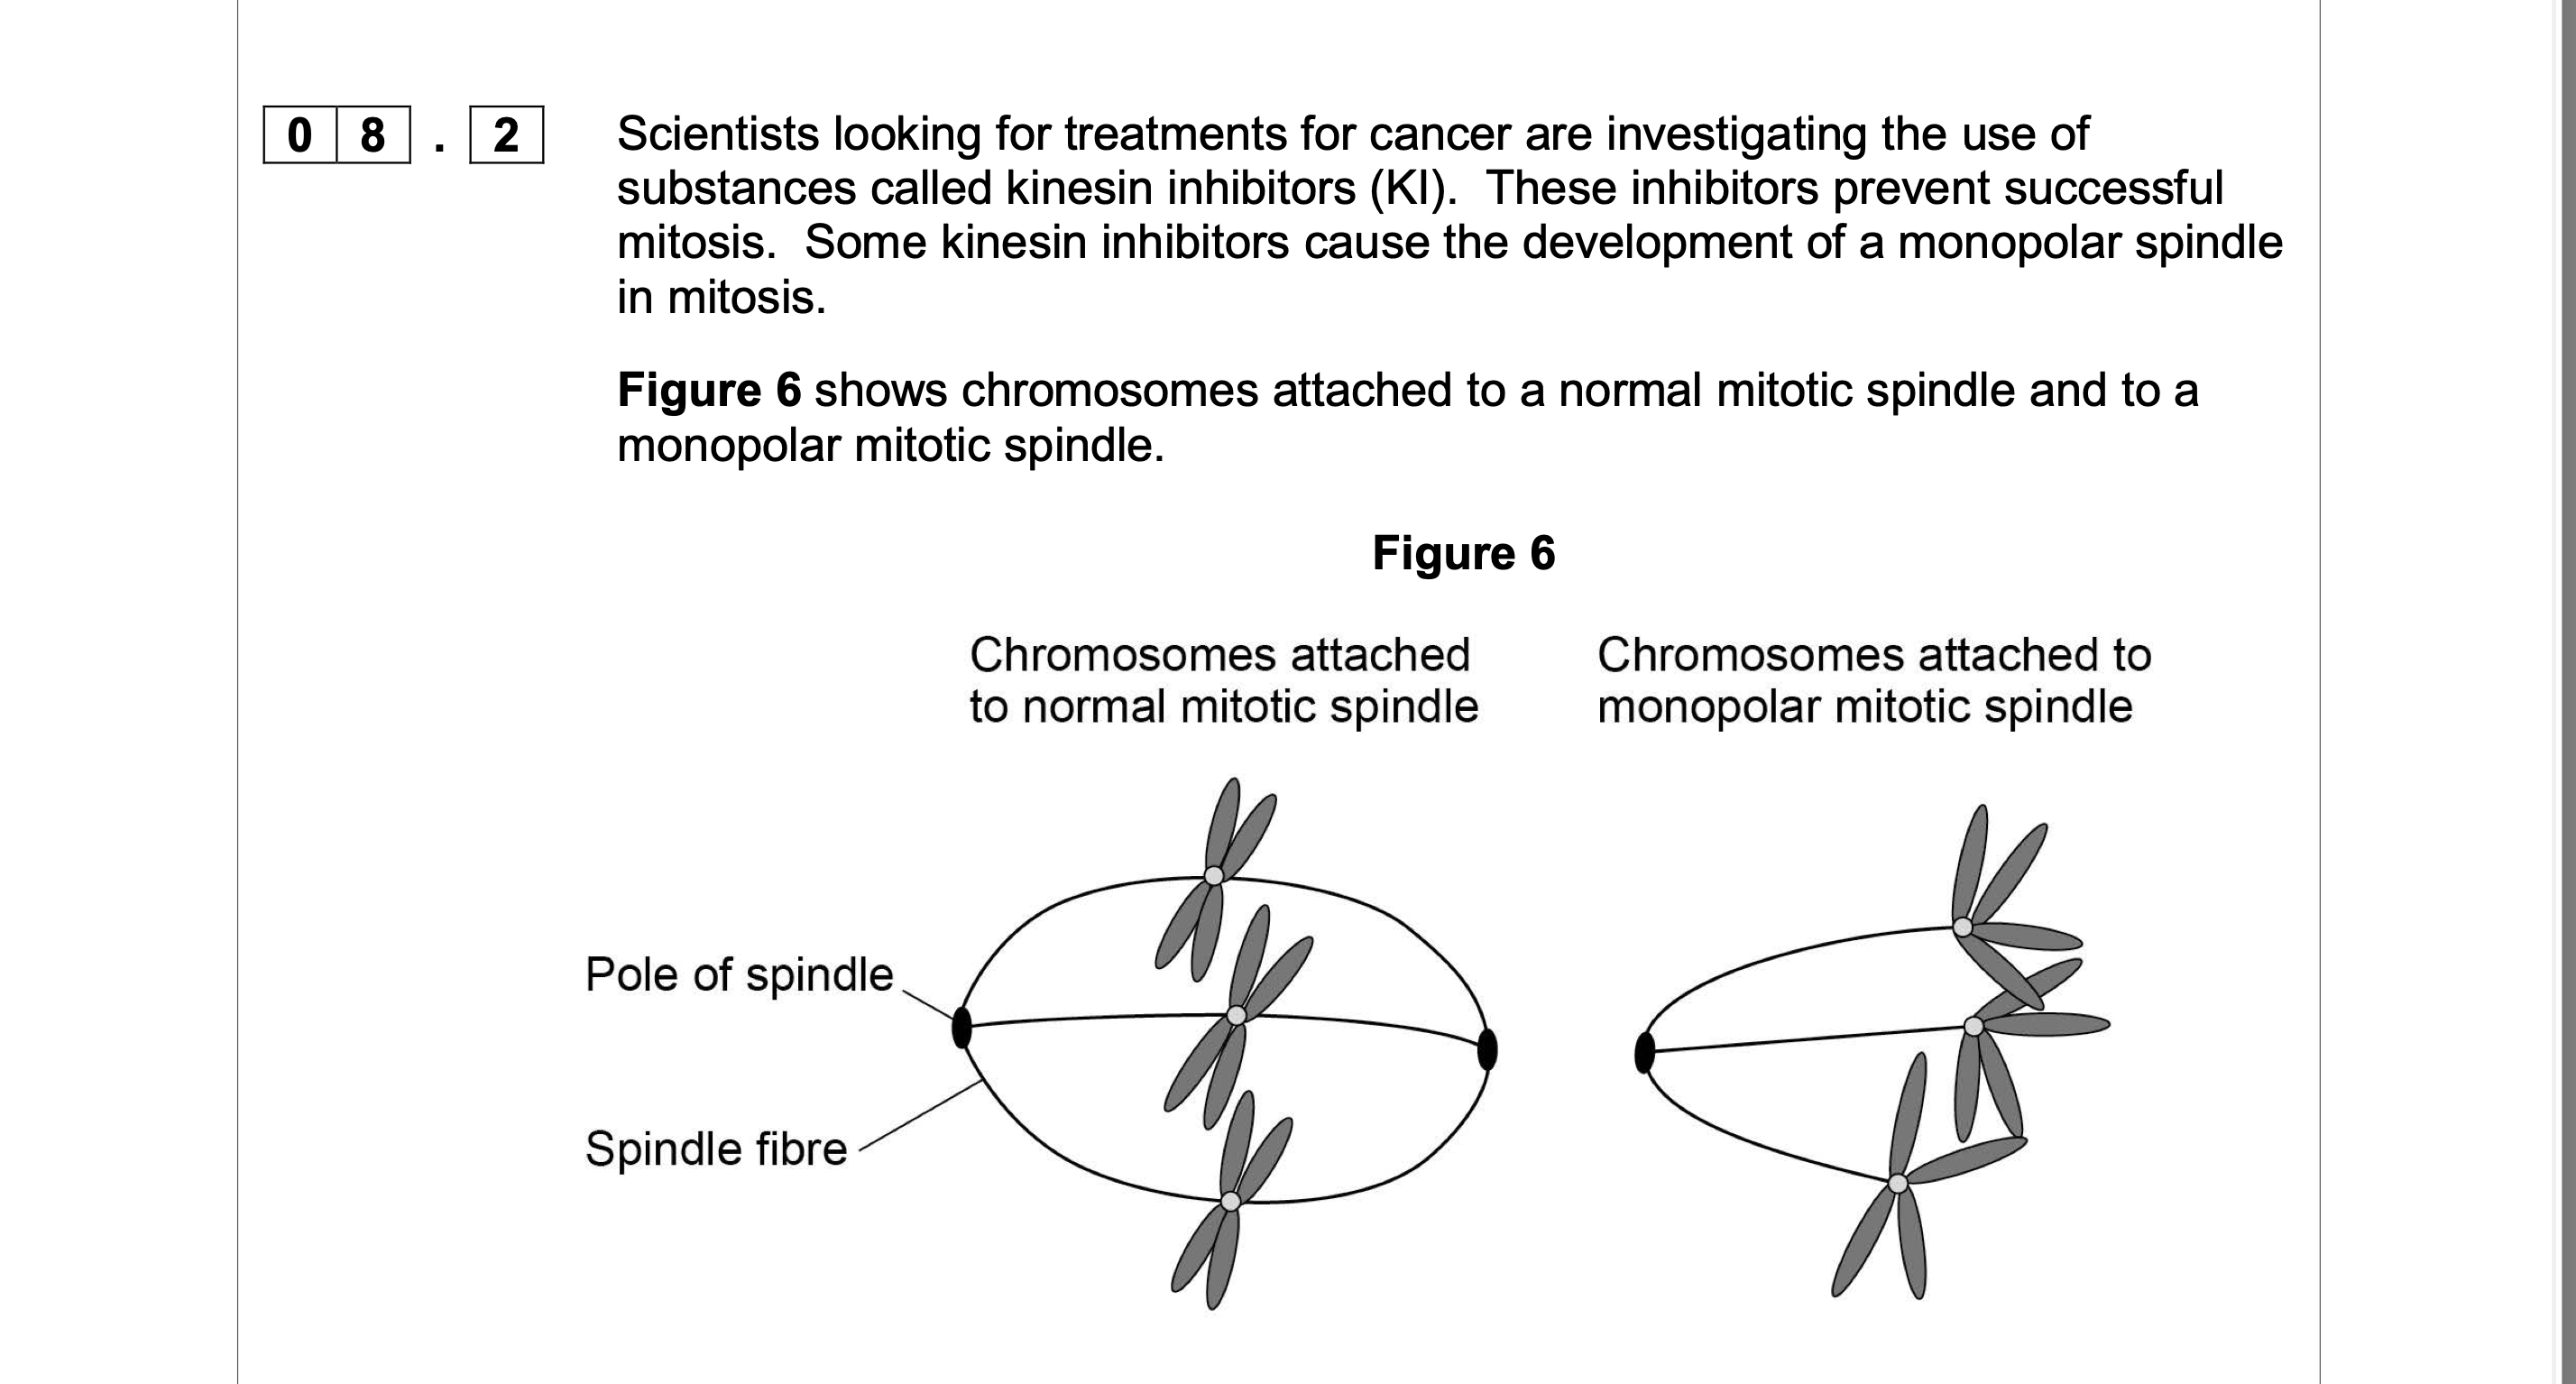
Suggest why the development of a monopolar mitotic spindle would prevent
successful mitosis.
1. No separation of
chromatids/chromosomes/centromeres;
2. Chromatids/chromosomes all go to one
pole/end/sides of cell/not pulled to
opposite poles;
3. Doubles chromosome number in
cell/one daughter cell gets no
chromosomes or chromatids
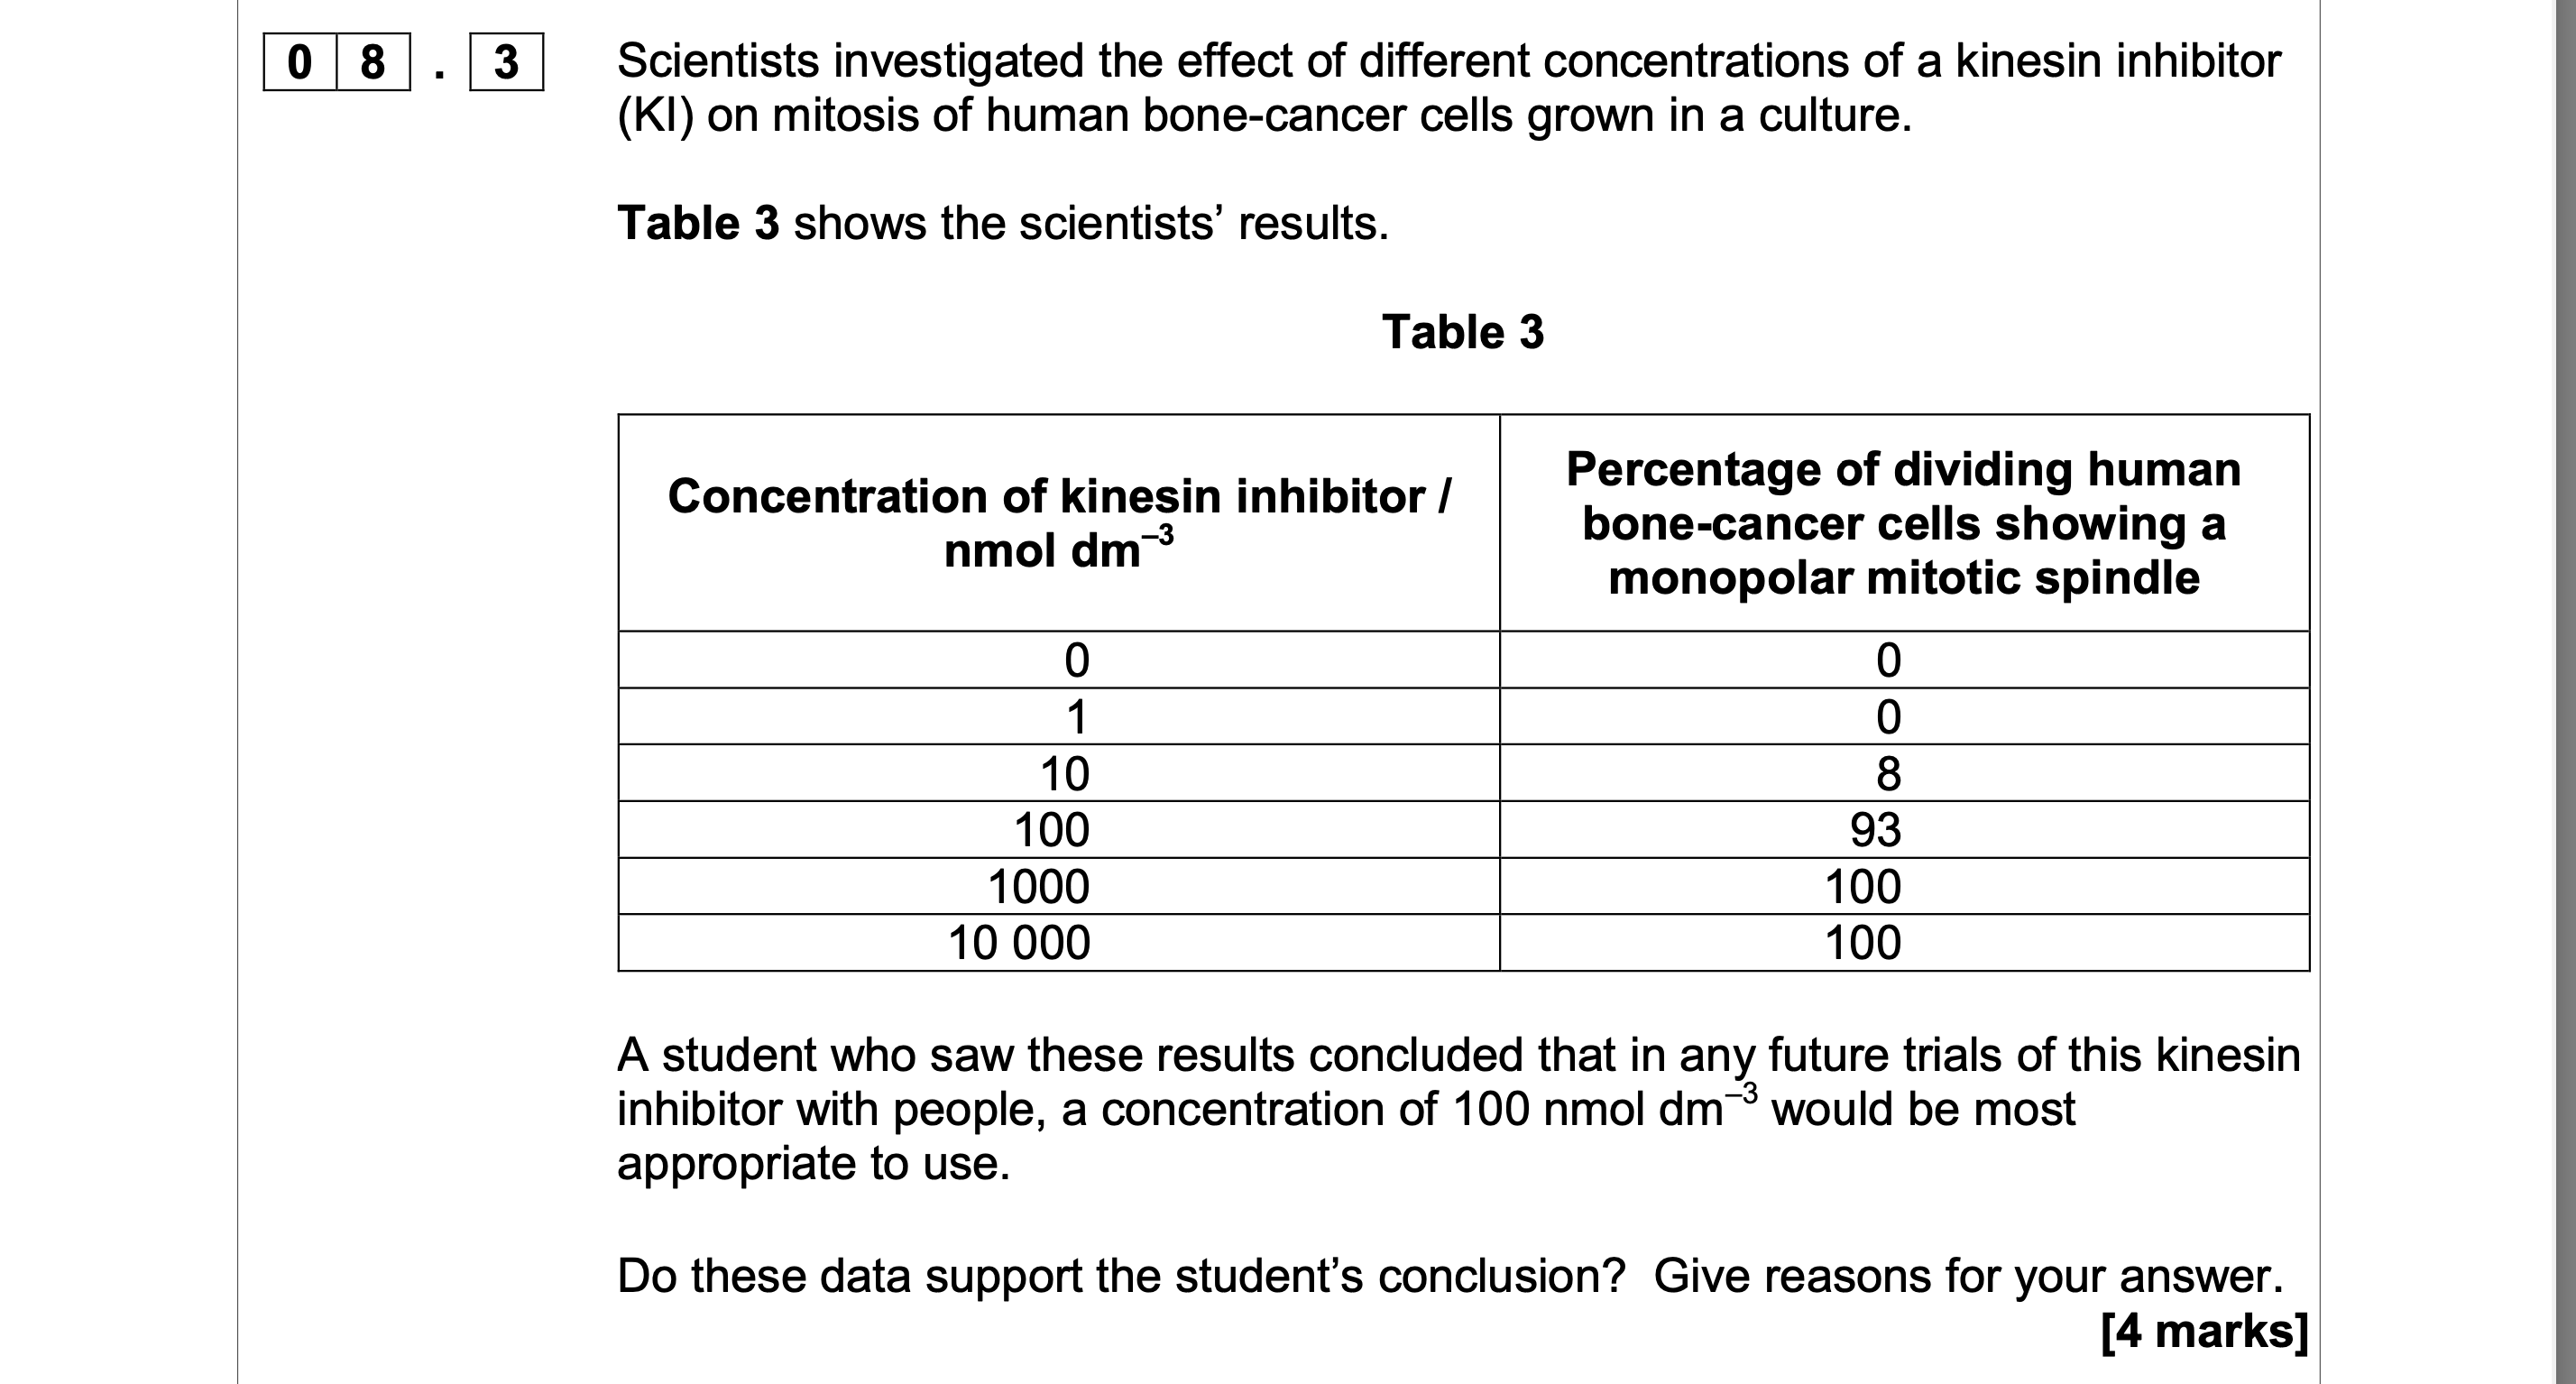
1. (No, because) at 100 there are still
some (7%) cancer cells
dividing/undergoing mitosis;
2. 3. 4. 5. 6. So, cancer not destroyed/may continue
to grow/spread/form tumours;
Best concentration may be between
100 and 1000/need trials between 100
and 1000;
This research in culture, don’t know
effect of KI on people;
(Yes, because) above 100 produces
little increase in % of cells not
dividing/undergoing mitosis/at 100,
most (93%) cancer cells unable to
divide/dead;
Above 100 may be harmful (to body);
7. Higher concentrations more expensive;
8. (above 100) will have more effect on
(rapidly dividing) cancer cells;
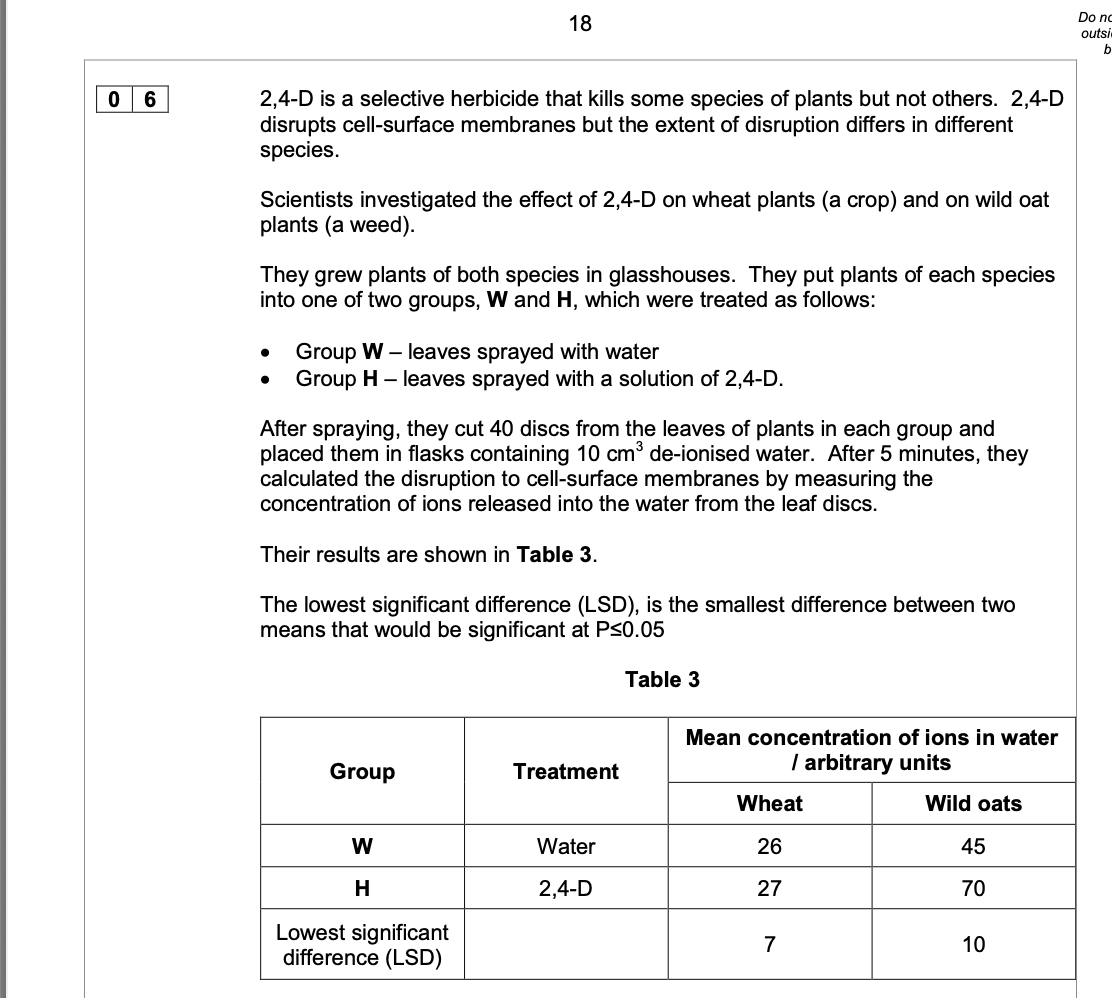
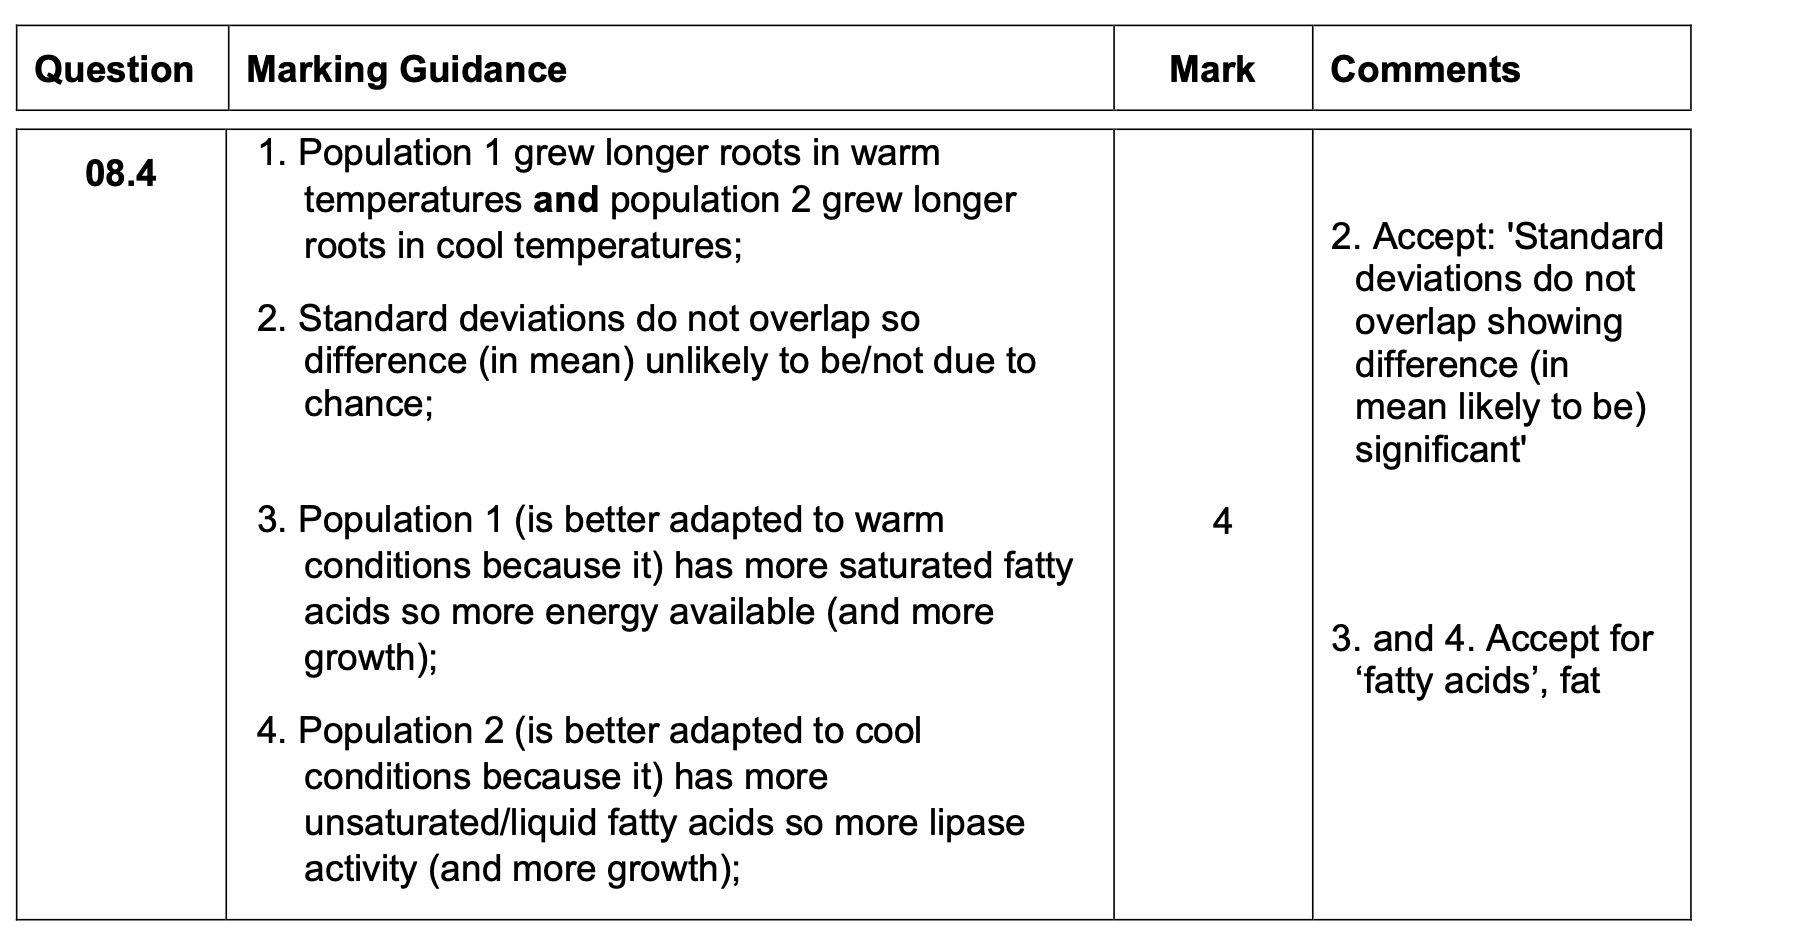
Evaluate the use of 2,4-D as a herbicide on a wheat crop that contains wild oats as
a weed. Use all the information provided.
1. 2. 3. 4. 5. MARK SCHEME – A-LEVEL BIOLOGY – 7402/1 – JUNE 2017
2,4-D causes an increase in release of ions
from wild oat cells and 2,4-D does not
affect/has little effect on the release of ions
from wheat cells;
(For wheat) Difference is less than LSD/7 so
difference is not significant;
OR
(For wild oats) Difference is more than LSD/10
so difference is significant;
Loss of ions from cells (likely to) lead to
cell/plant death/damage;
OR
Disruption of cell membrane (likely to) lead to
cell/plant death/damage;
No evidence here about death of plants as a
result of this ion loss;
No evidence here of other
ecological/environmental impact;
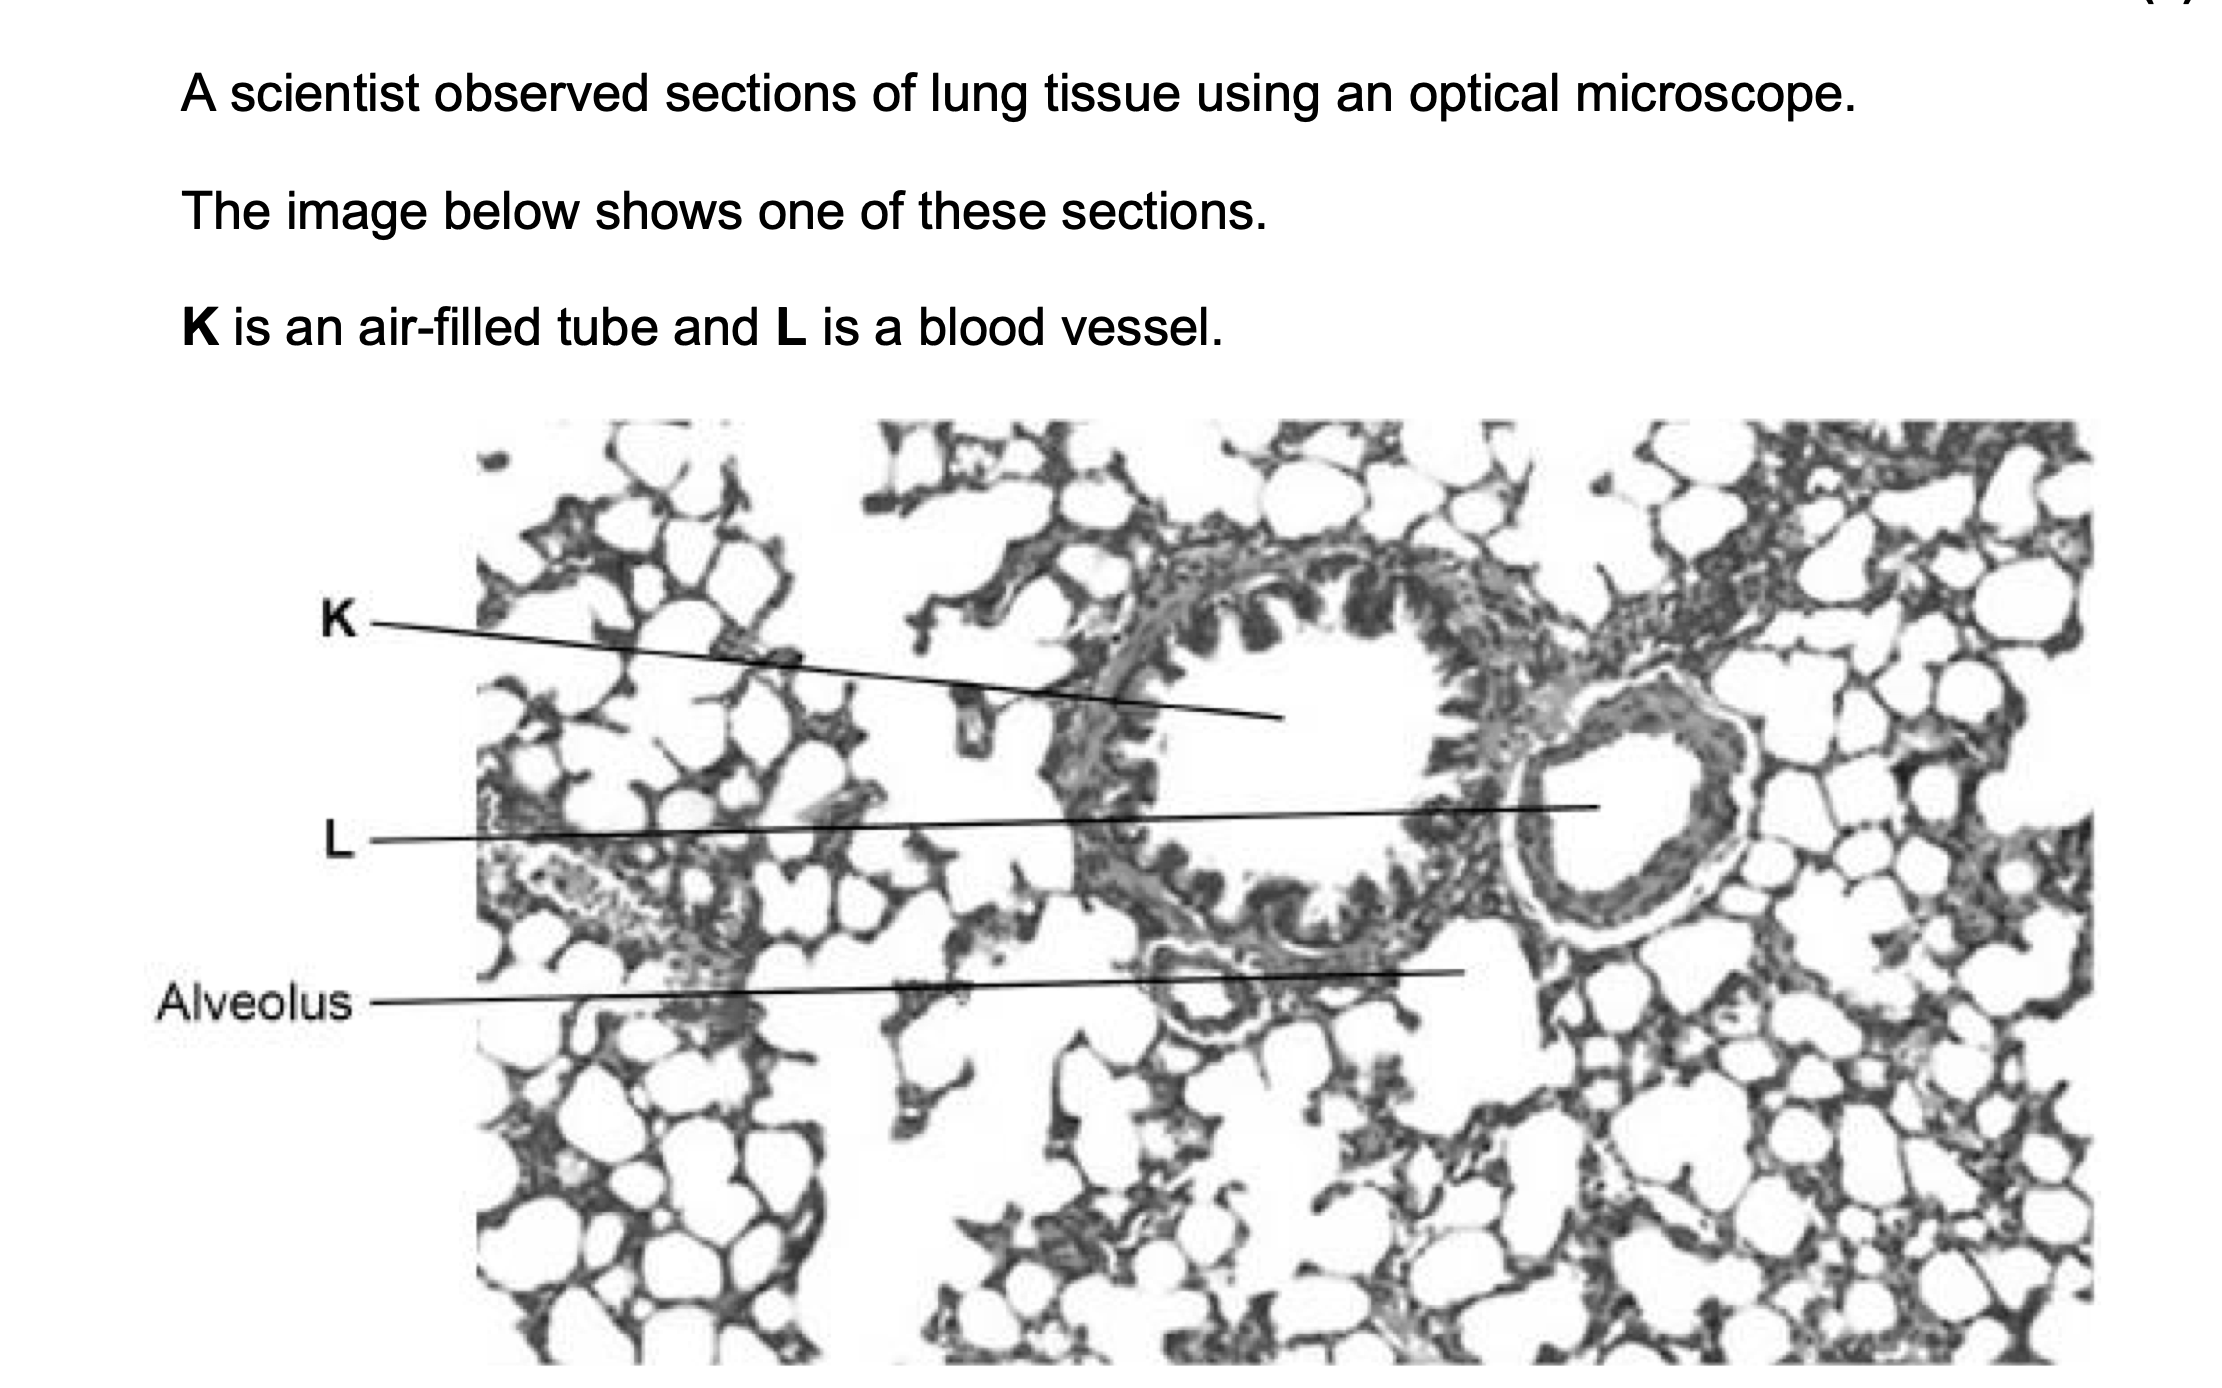
Two solutions often used to stain tissues are haematoxylin solution and
iodine solution.
• Haematoxylin solution stains DNA a blue colour.
• Iodine solution stains starch a blue-black colour.
The scientist used haematoxylin solution and not iodine solution to stain
the lung tissue.
Suggest why.
1. This/animal/lung tissue does not contain starch;
Accept cell(s) for ‘tissue’
2. (Makes) nucleus visible;
OR
Nucleus contains DNA;
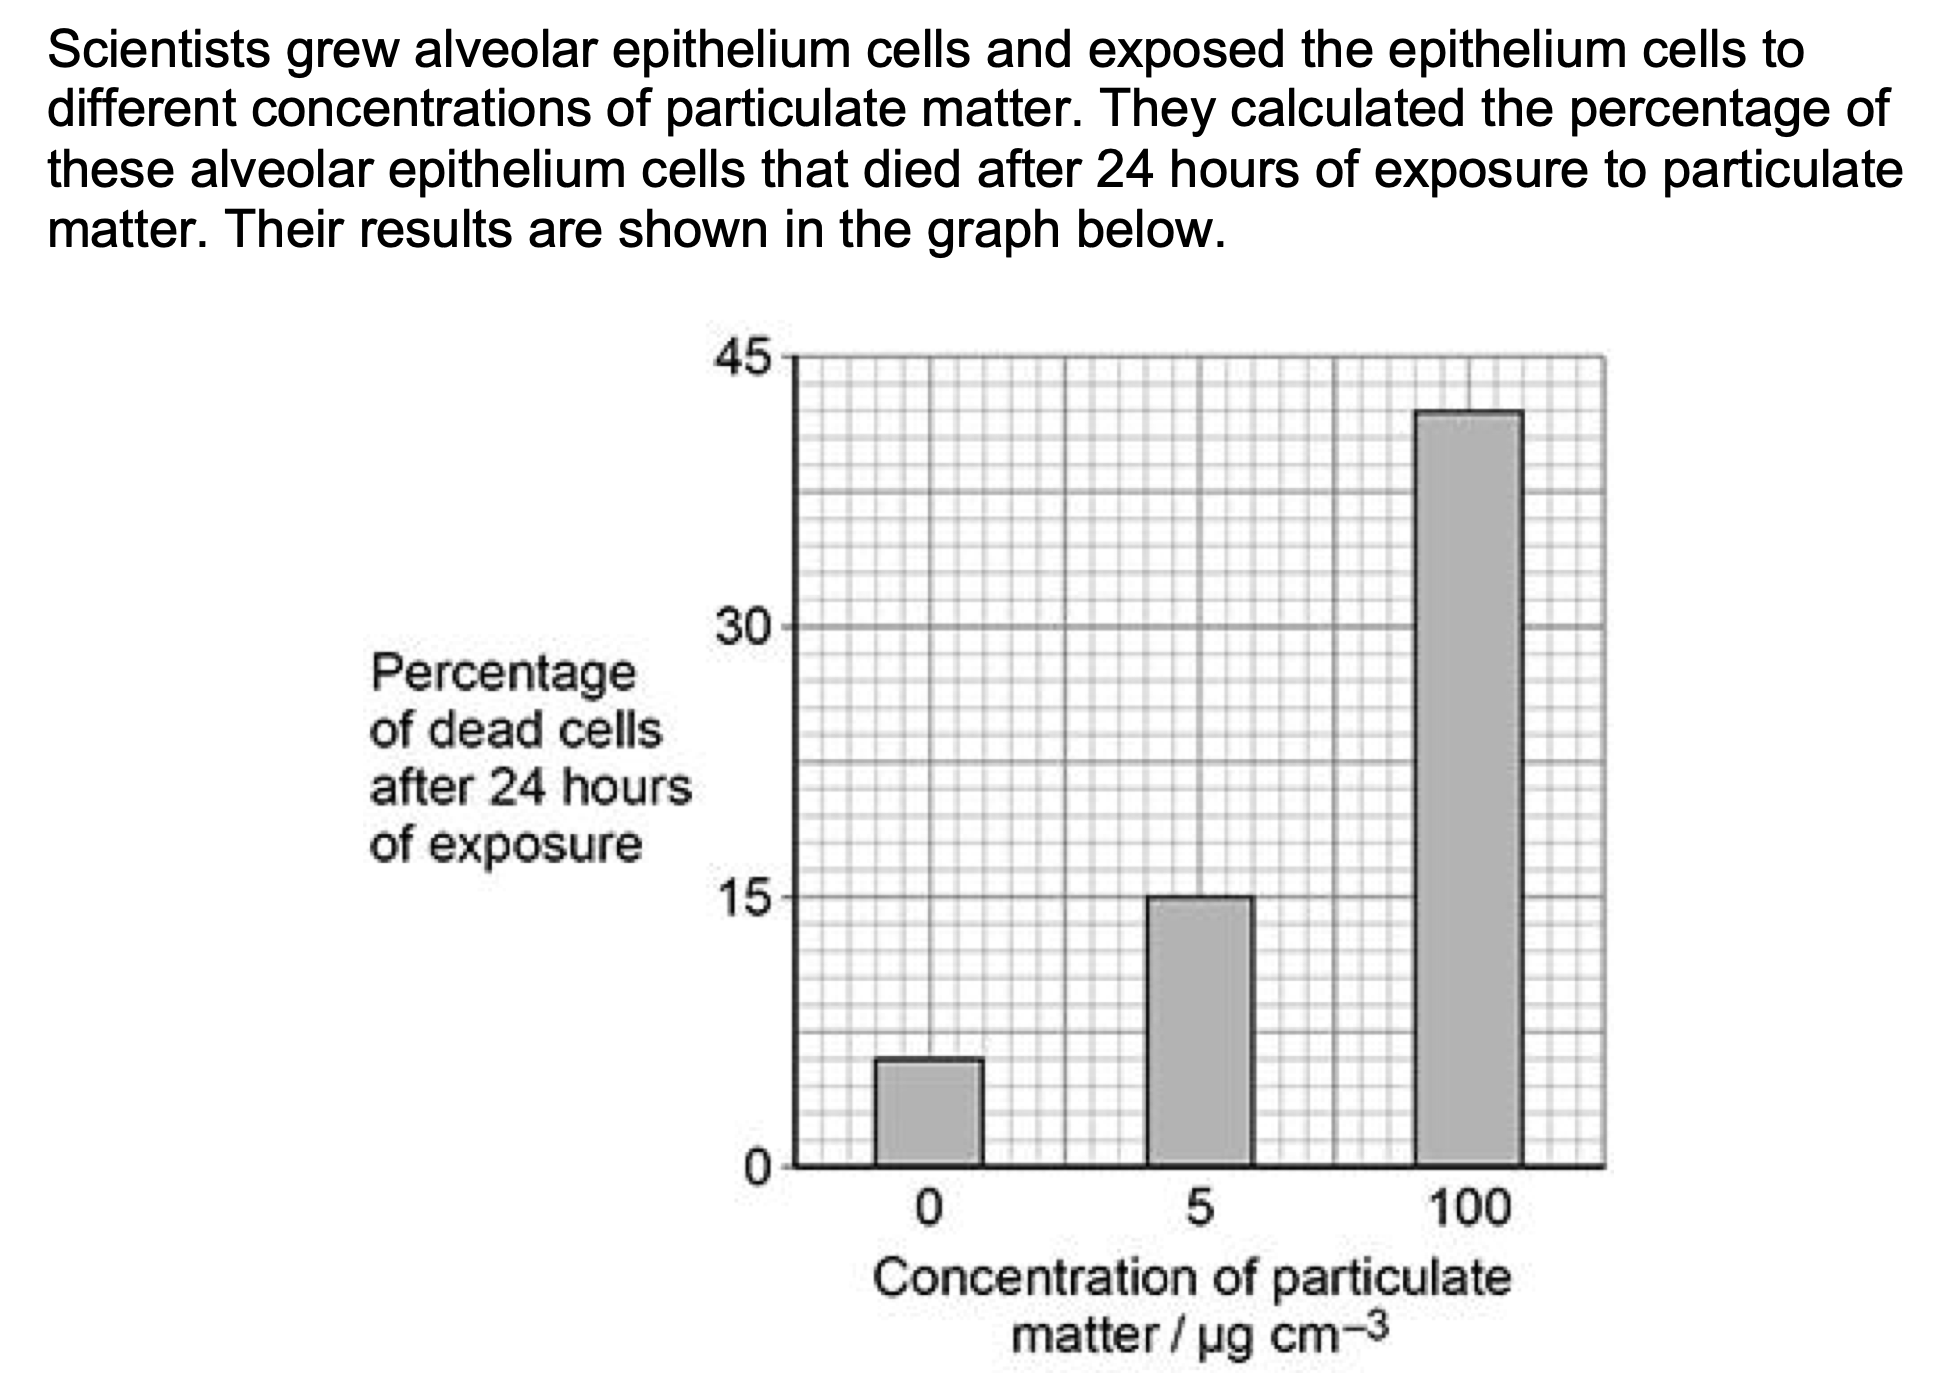
Do the data in the graph above show a linear relationship between
concentration of particulate matter and percentage of dead cells?
Use suitable calculations to justify your answer.
No)
EITHER
1. 2. 9 (percent per 5 µg cm–3);
1.42/1.8 (percent per 5 µg cm–3);
Accept any number of significant figures as long as
rounding correct, full answer for mp2 is
1.42105263.
OR
3. 4. 1.8 (percent per 1 µg cm–3);
0.28/0.36 (percent per 1 µg cm–3);
Accept any number of significant figures as long as
rounding correct, full answer for mp4 is
0.28421053.
OR
5. 6. 9% and 36/27% increase here;
(To be linear) 100 (µg cm–3) would be 180/171% (increase)
OR
(To be linear) 5 (µg cm–3) would be 1.8% (increase)
OR
% increase is x4 (0-5 µg cm–3 compared with 0-100 µg cm–3) but 5-
100 is more than x4
OR
AQA Biology A-Level - Gas Exchange MS PhysicsAndMathsTutor.com
% increase is x3 (0-5 µg cm–3 compared with 5-100 µg cm–3) but 5-
100 is more than x3;
OR
7. (Using y = mx + c) at 5 (µg cm–3) m = 1.8;
8. (Using y = mx + c) at 100 (µg cm–3) m = 0.36;
9. At 100 (µg cm–3) y would be 186%;
10. At 5 (µg cm–3) y would be 7.8%;;
If no correct answers accept for one mark
Evidence of incorrect graph reading but division by 19
OR
Evidence of incorrect graph reading but division by 95
Accept 1 and 2 OR 3 and 4
OR 5 and 6
OR 7 and 8
OR 7 and 9
OR 8 and 10
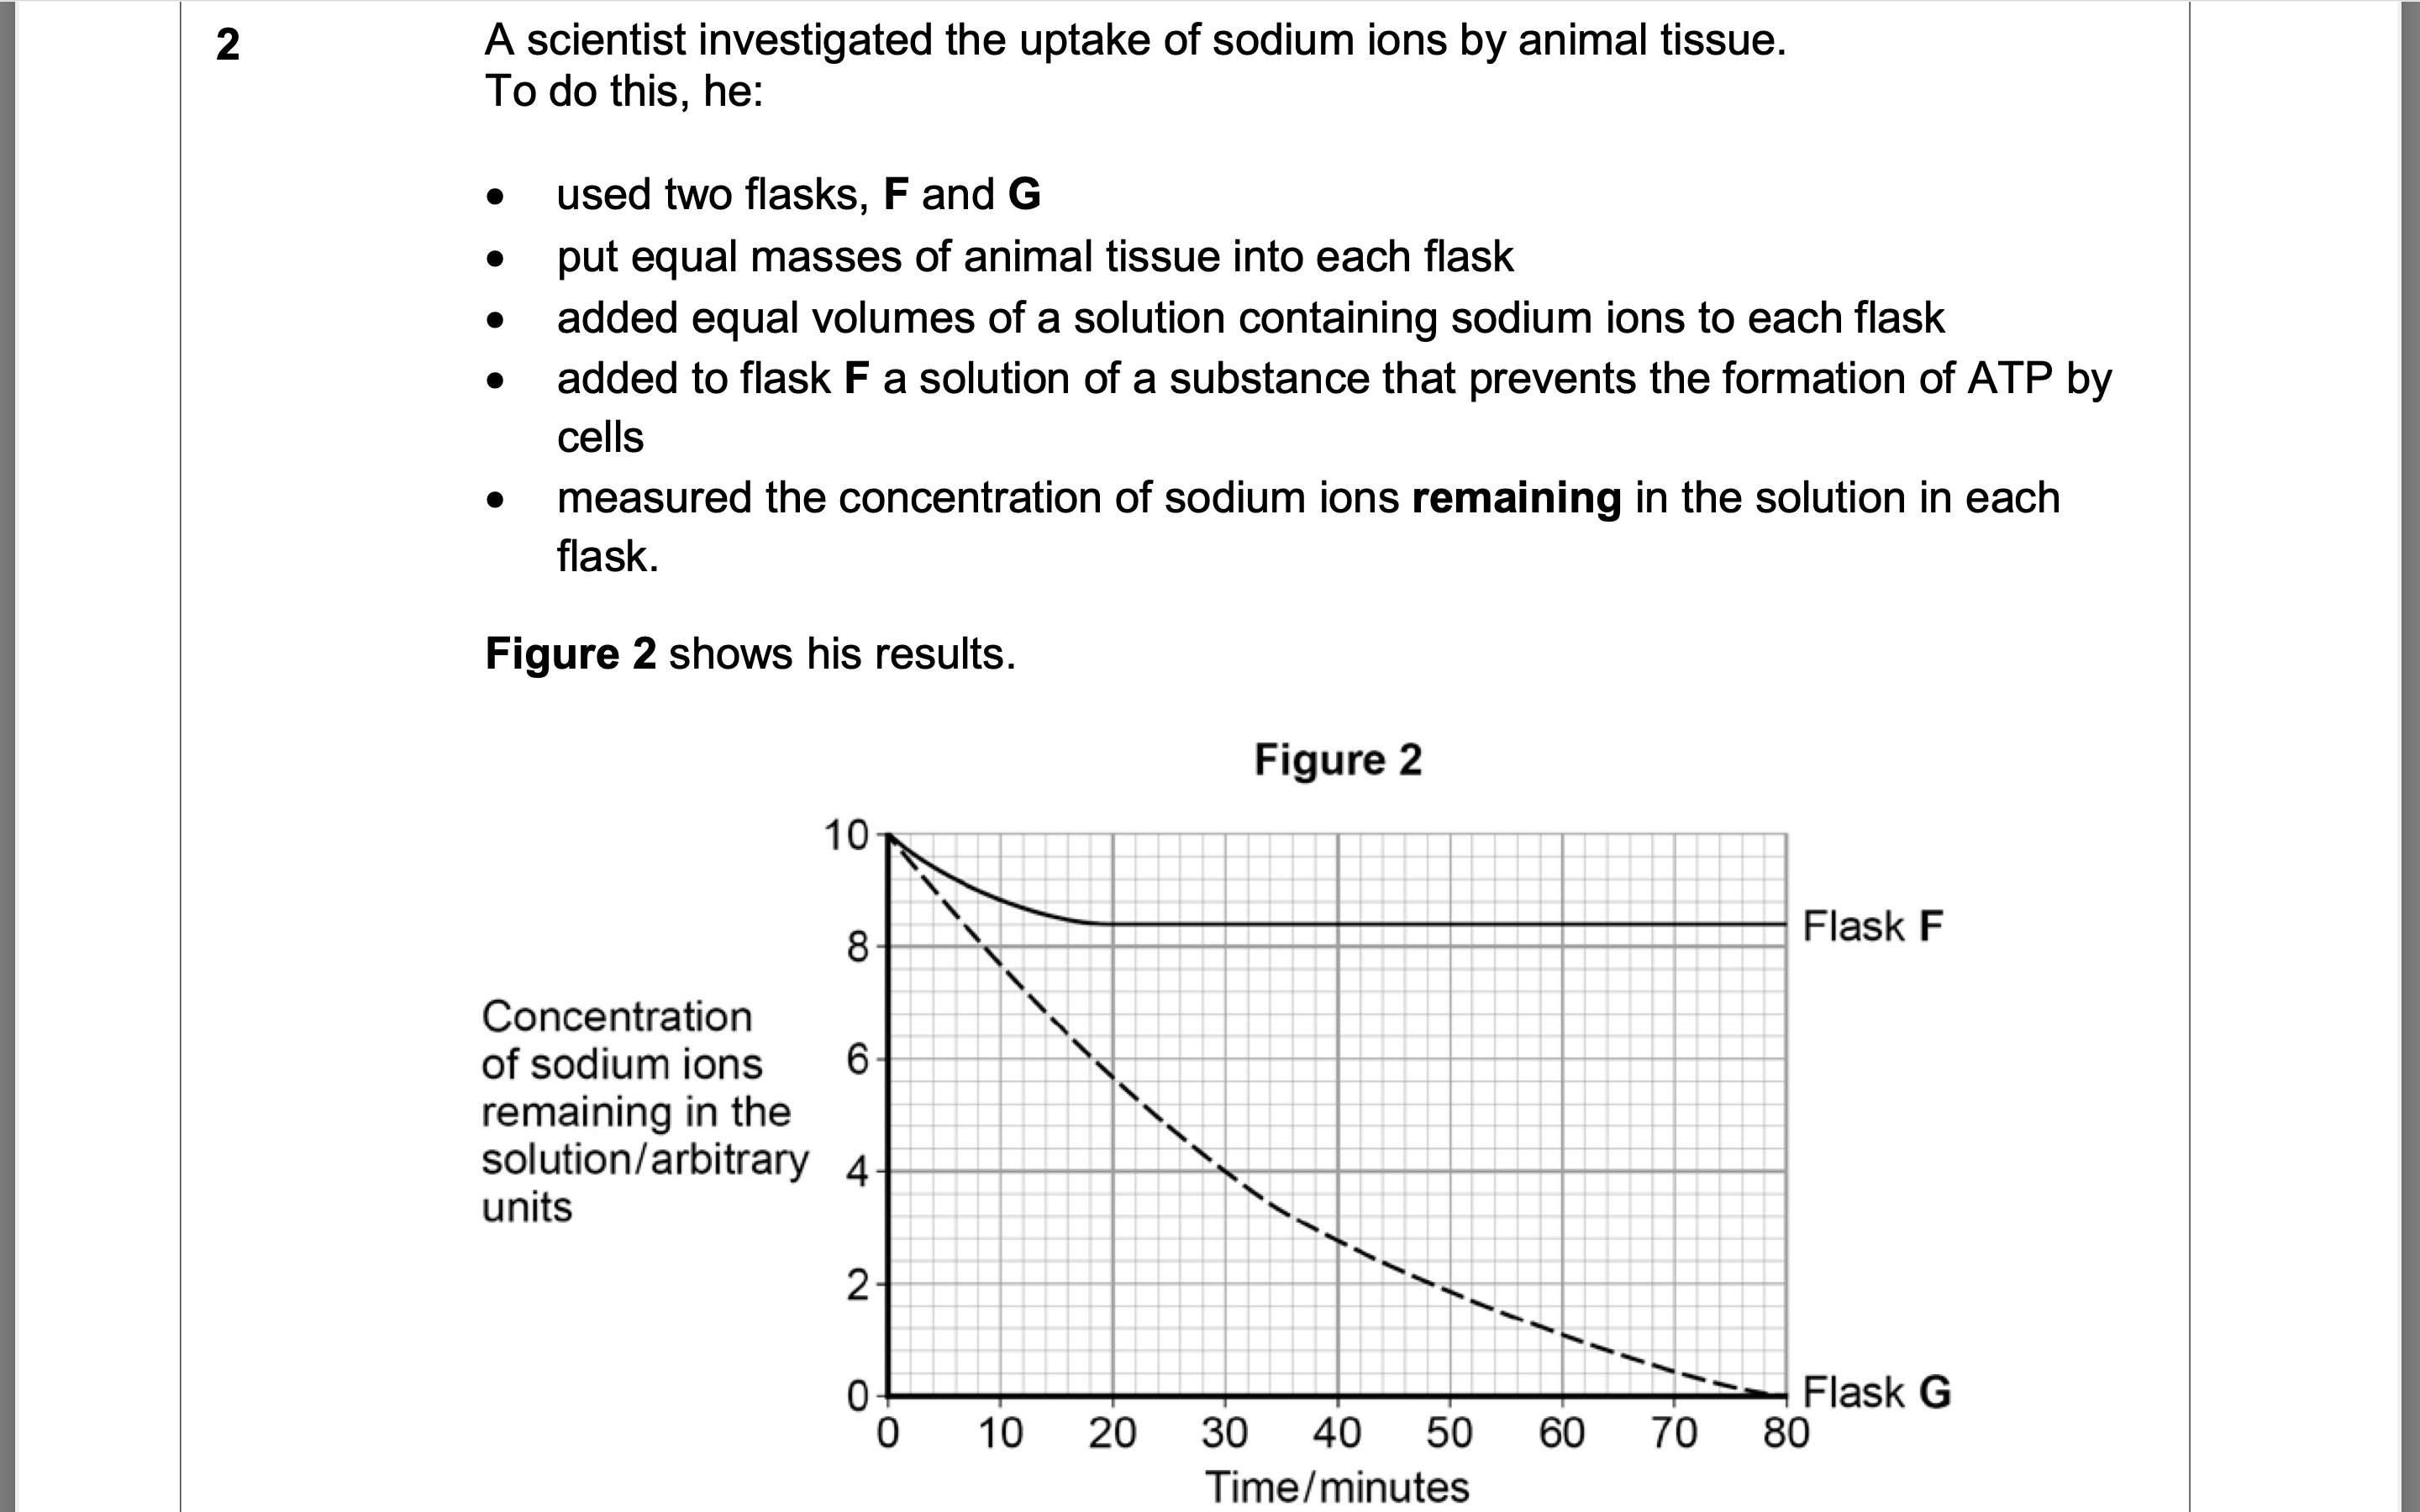
The scientist concluded that the cells in flask G took up sodium ions by active
transport. Explain how the information given supports this conclusion.
1. 2. 3. 4. Uptake in flask G much greater than in flask F;
Showing use of ATP in flask G;
Sodium ion concentration in flask G falls to
zero;
Showing uptake against a concentration
gradient;
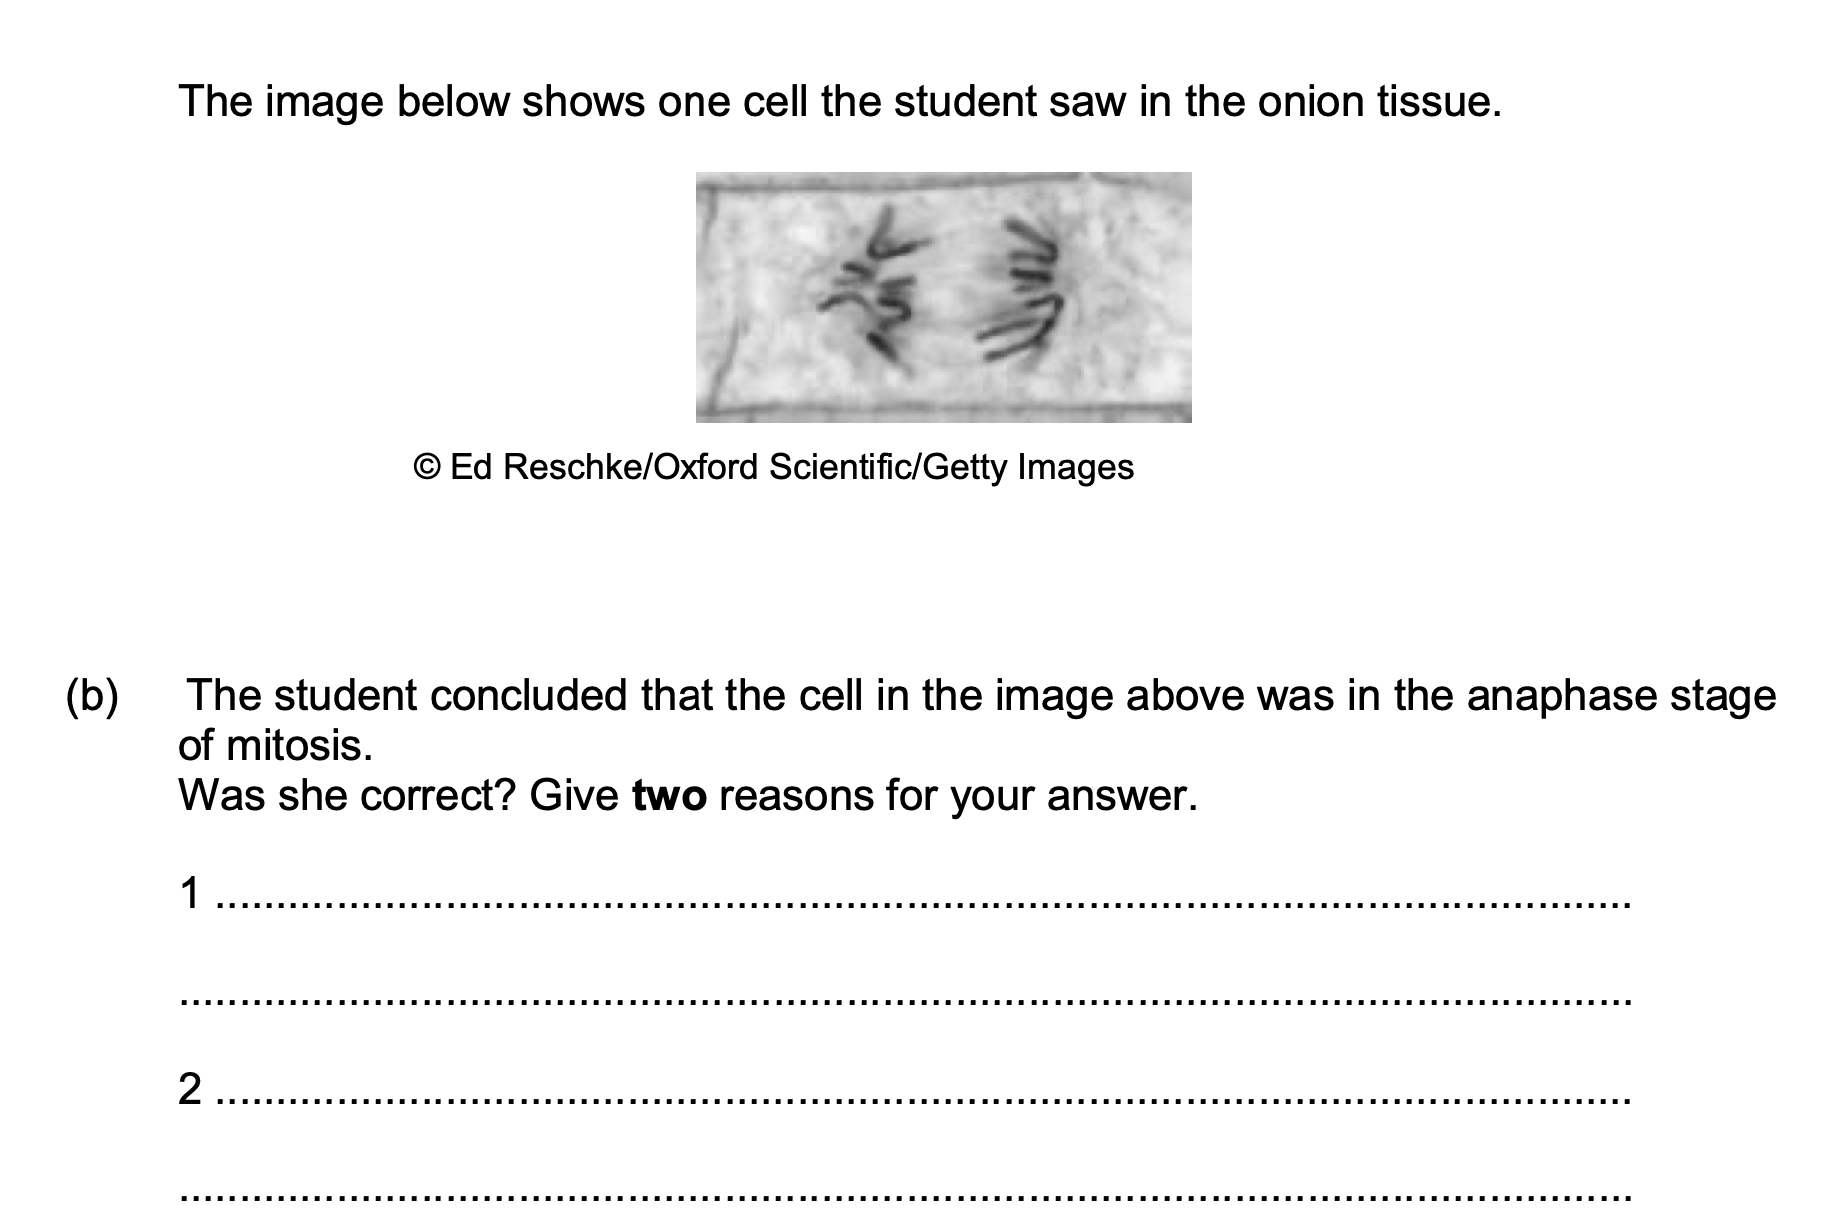
chromatids are (in two groups) at poles of spindle / at
ends of spindle;
Do not accept ‘ends of cell’
V-shape shows that (sister) chromatids have been pulled apart at their
centromeres / that centromeres of (sister) chromatids have been pulled
apart.
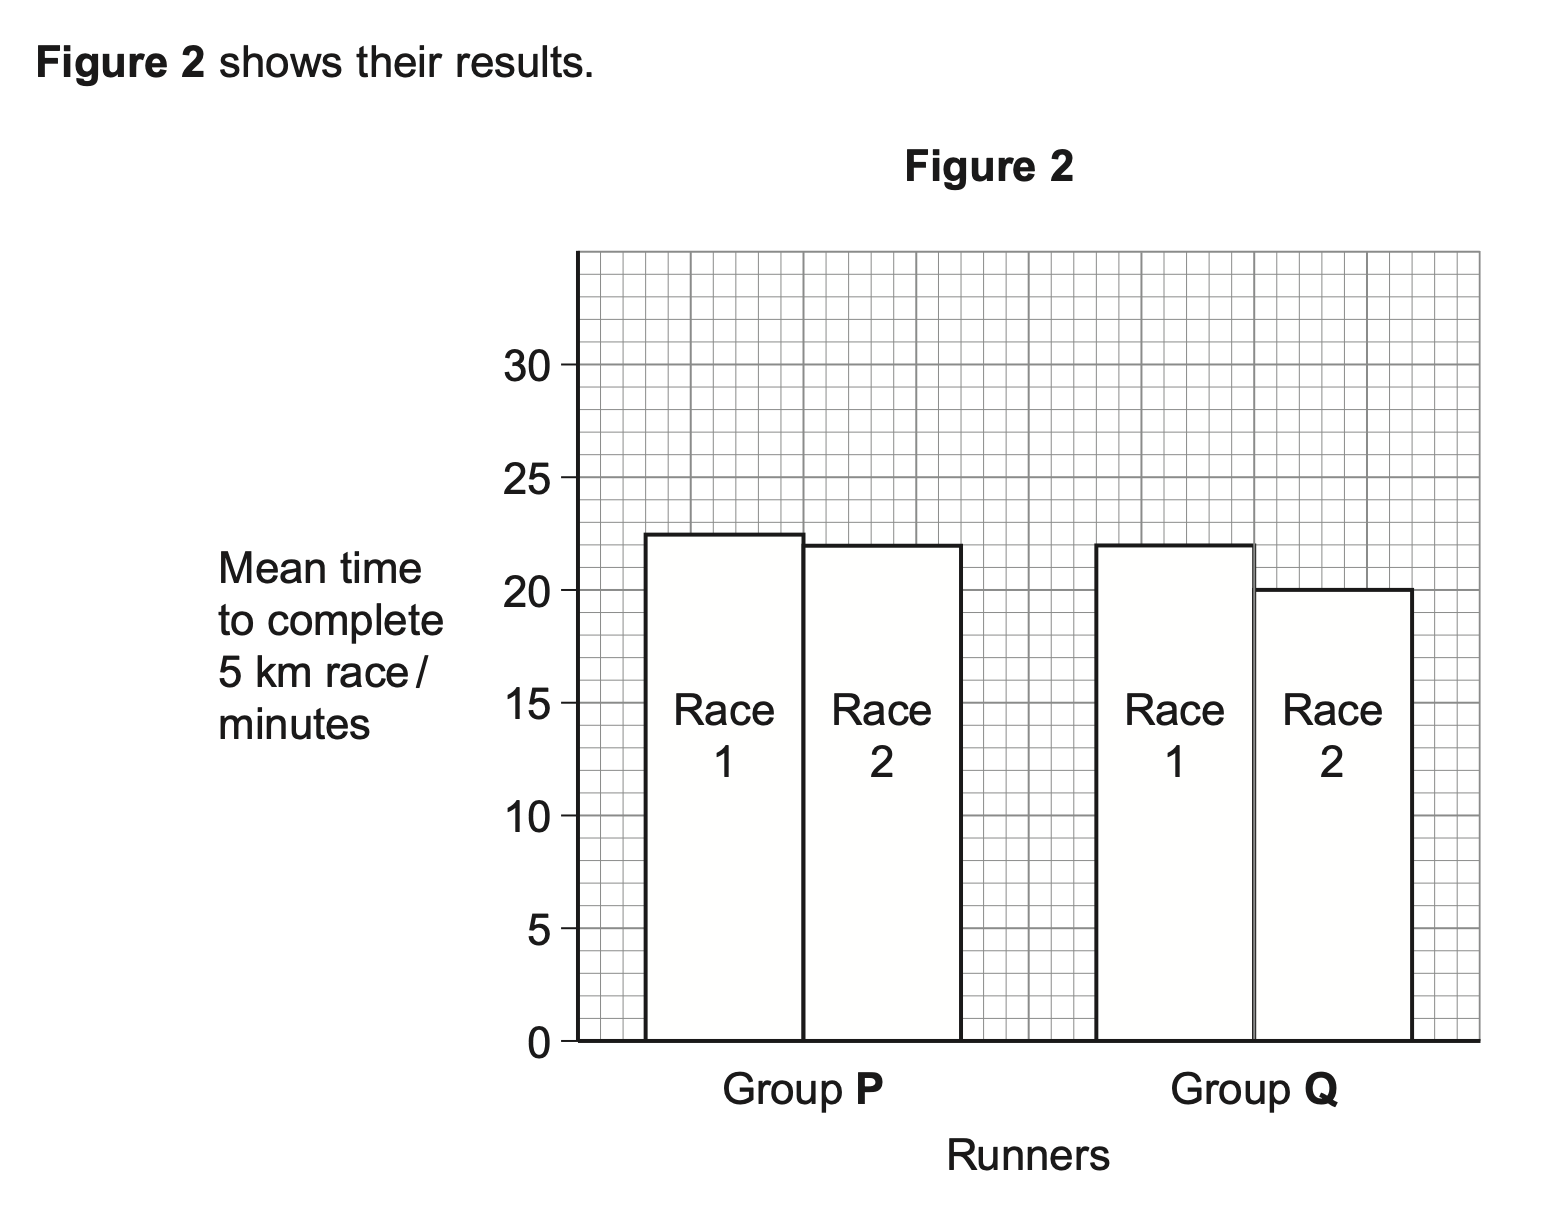
Many sports drinks contain water, sodium chloride and carbohydrates. The manufacturers of the
sports drinks claim that carbohydrates provide an energy boost. The sodium chloride is used to
increase absorption of glucose in the small intestine.
Scientists investigated the effect of a sports drink on the performance of runners in 5 km races.
They recruited 100 runners who had previously run a 5 km race in similar times. During this race,
Race 1, they had water they could drink.
The scientists divided the runners into two equal groups, P and Q. 5 km race, Race 2. During this race:
Both groups ran a second
l group P had water available
l group Q had the sports drink available.
The scientists recorded the mean time for each group to complete this race.
One of the runners concluded that the sports drink improved performance.
Do these data support his conclusion?
Yes)
1. Faster running time after sports
drink;
(No)
2. 3. 3 max Can mix and match yes or no
approach, all 5 responses are
available
1. ‘Faster running time in group
Q’ is insufficient but accept
‘faster running time in group Q
in Race 2’
3. Accept ‘no stats analysis’
4. 5. Mean times given so there will be
variation in the group;
No standard deviations to know the
spread of the data (about the
mean)/whether they overlap;
Improvement in running time only
small in both groups / both groups
improved in Race 2;
Did not drink the same volumes;
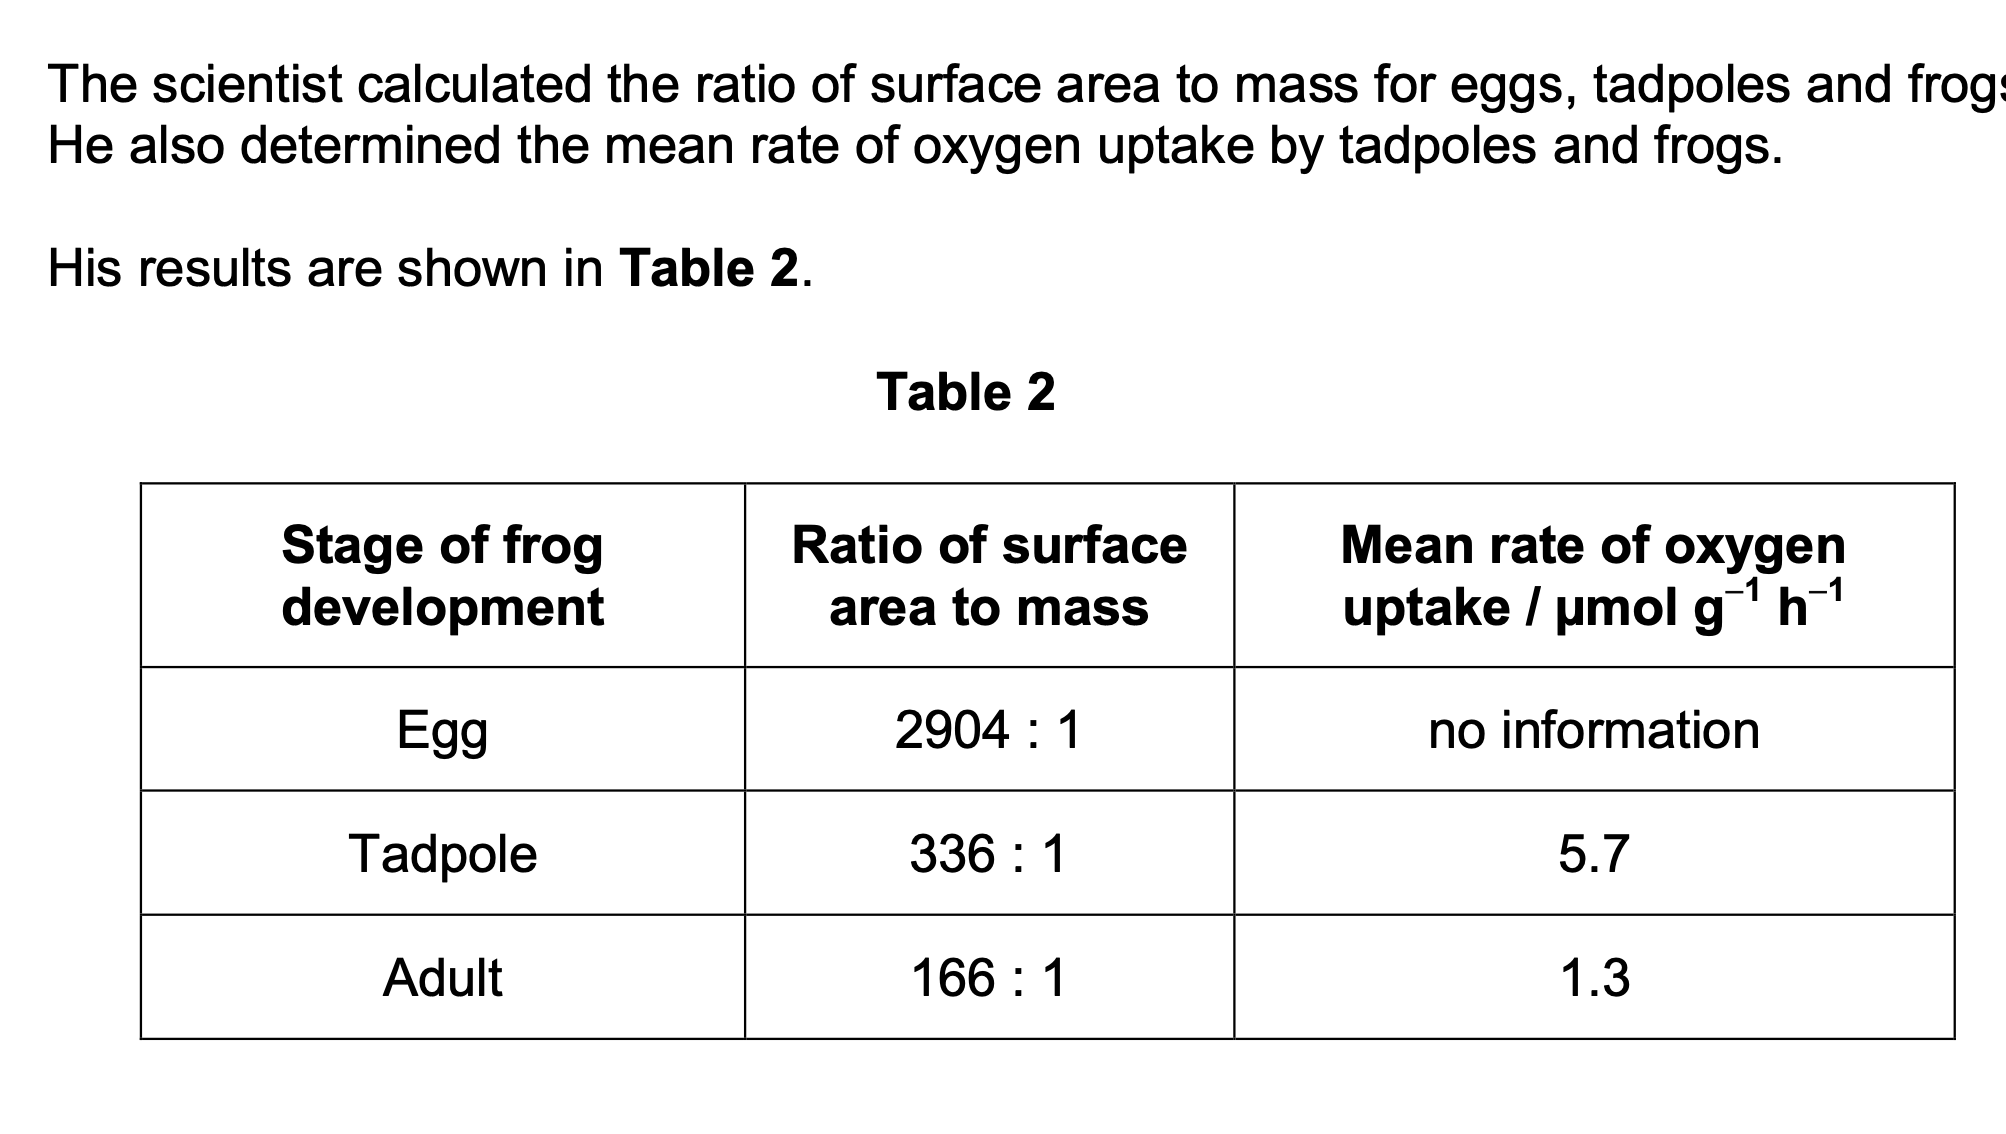
The scientist used units of µmol g−1 h−1 for the rate of oxygen uptake.
Suggest why he used µmol in these units.
(Measures) small uptake / amount / quantity /
volume / concentration / rate (of oxygen
uptake);
OR
Avoids use of powers of ten / standard form /
many decimal places;
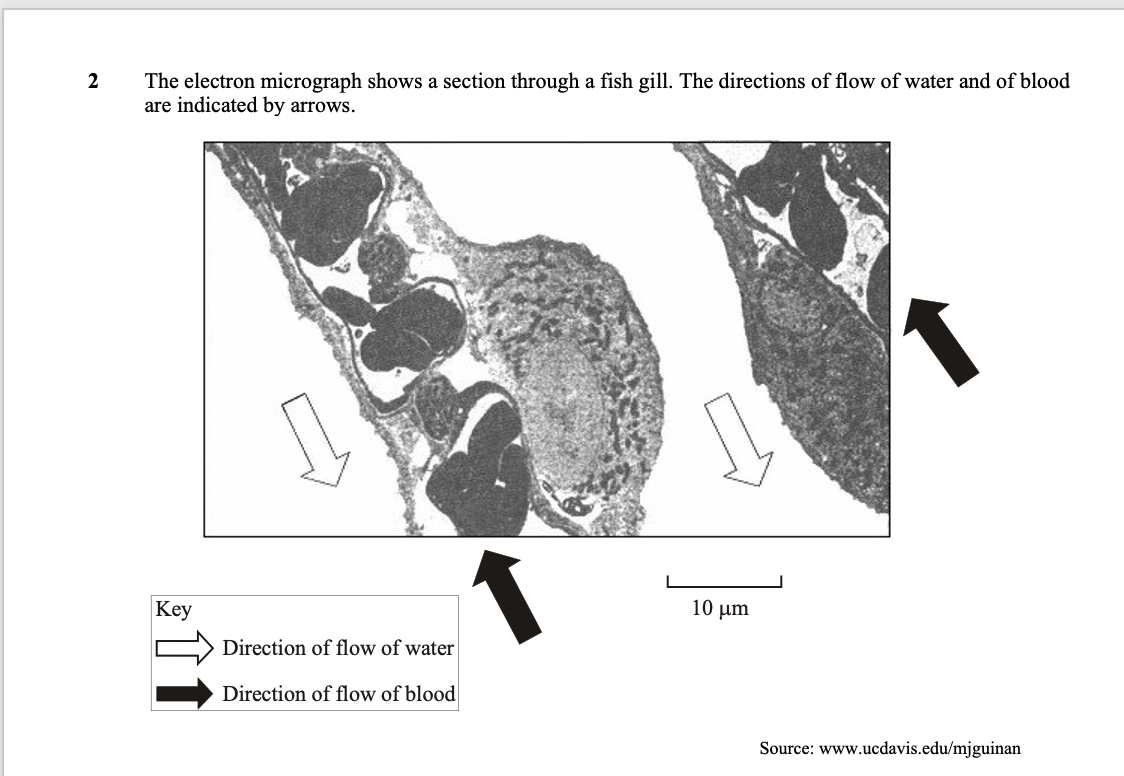
explain how relationship between blood and water shown in micrograph is useful for fish
(b) Maintains concentration gradient (over whole length of
gill) / diffusion can occur over whole gill;
More oxygen enters blood (/ more CO2 leaves);
More (aerobic) respiration / more energy release in muscle
/ for swimming;
‘more’ needed ONCE only

the scientist decided to use the ratio of surface area to mass, rather than the ratio of
surface area to volume. He made this decision for practical reasons.
Suggest one practical advantage of measuring the masses of frog eggs, tadpoles and
adults, compared with measuring their volumes.
More accurate / less error (in measuring
mass);
OR
Causes less distress / damage to animal (to
measure mass);
OR
Easier / quicker (to find mass) because
irregular shapes;
OR
1 Ignore references to
human error
Accept converse if
reference made to volume
Reject if comparison is
made with surface area.
Fewer measurements / calculations;

(a) Describe what occurs between
(i) stage A and stage B;
nuclear membrane disappears (once only);
chromosomes become shorter / condense /coiling;
arranged on equator;
spindle formation (once only);
centromeres attach to spindle;
accept reference to centrioles (once only)
(a) Describe what occurs between
(i) stage B and stage C;
nuclear membrane disappears (once only);
chromosomes become shorter / condense /coiling;
arranged on equator;
spindle formation (once only);
centromeres attach to spindle;
accept reference to centrioles (once only)
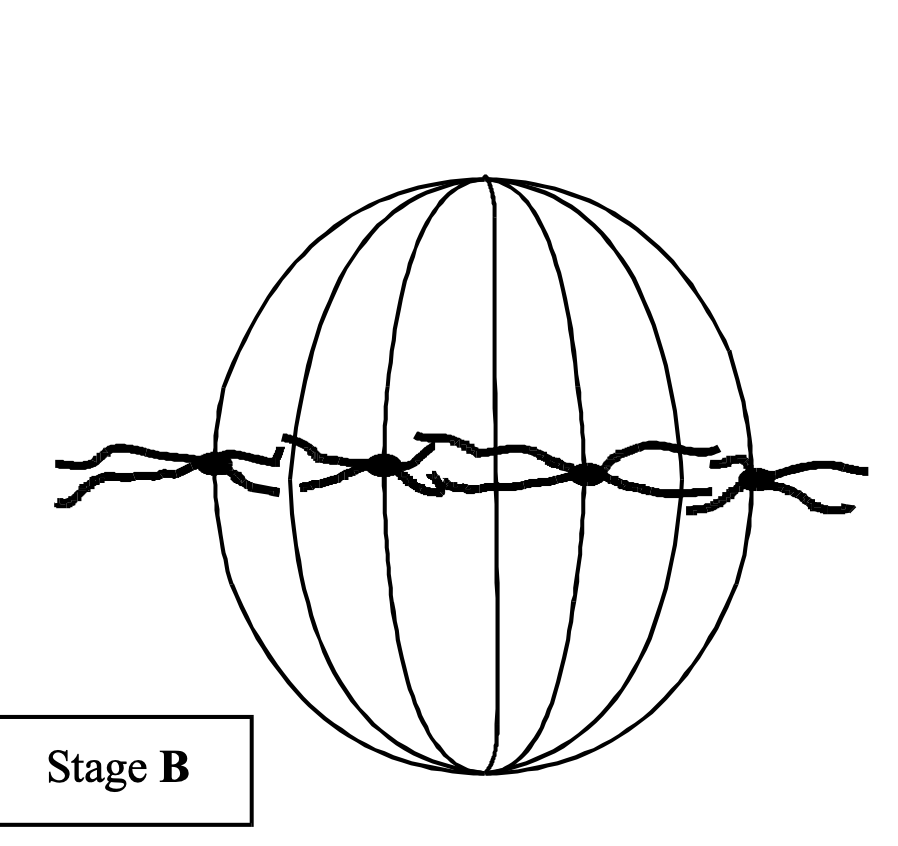
(iii) Describe and explain the appearance of one of the chromosomes in stage B.
(original) chromosome/DNA has been replicated;
each chromosome consists of two chromatids/
chromatids attached at centromere;
(accept reference to condensed state of chromosomes
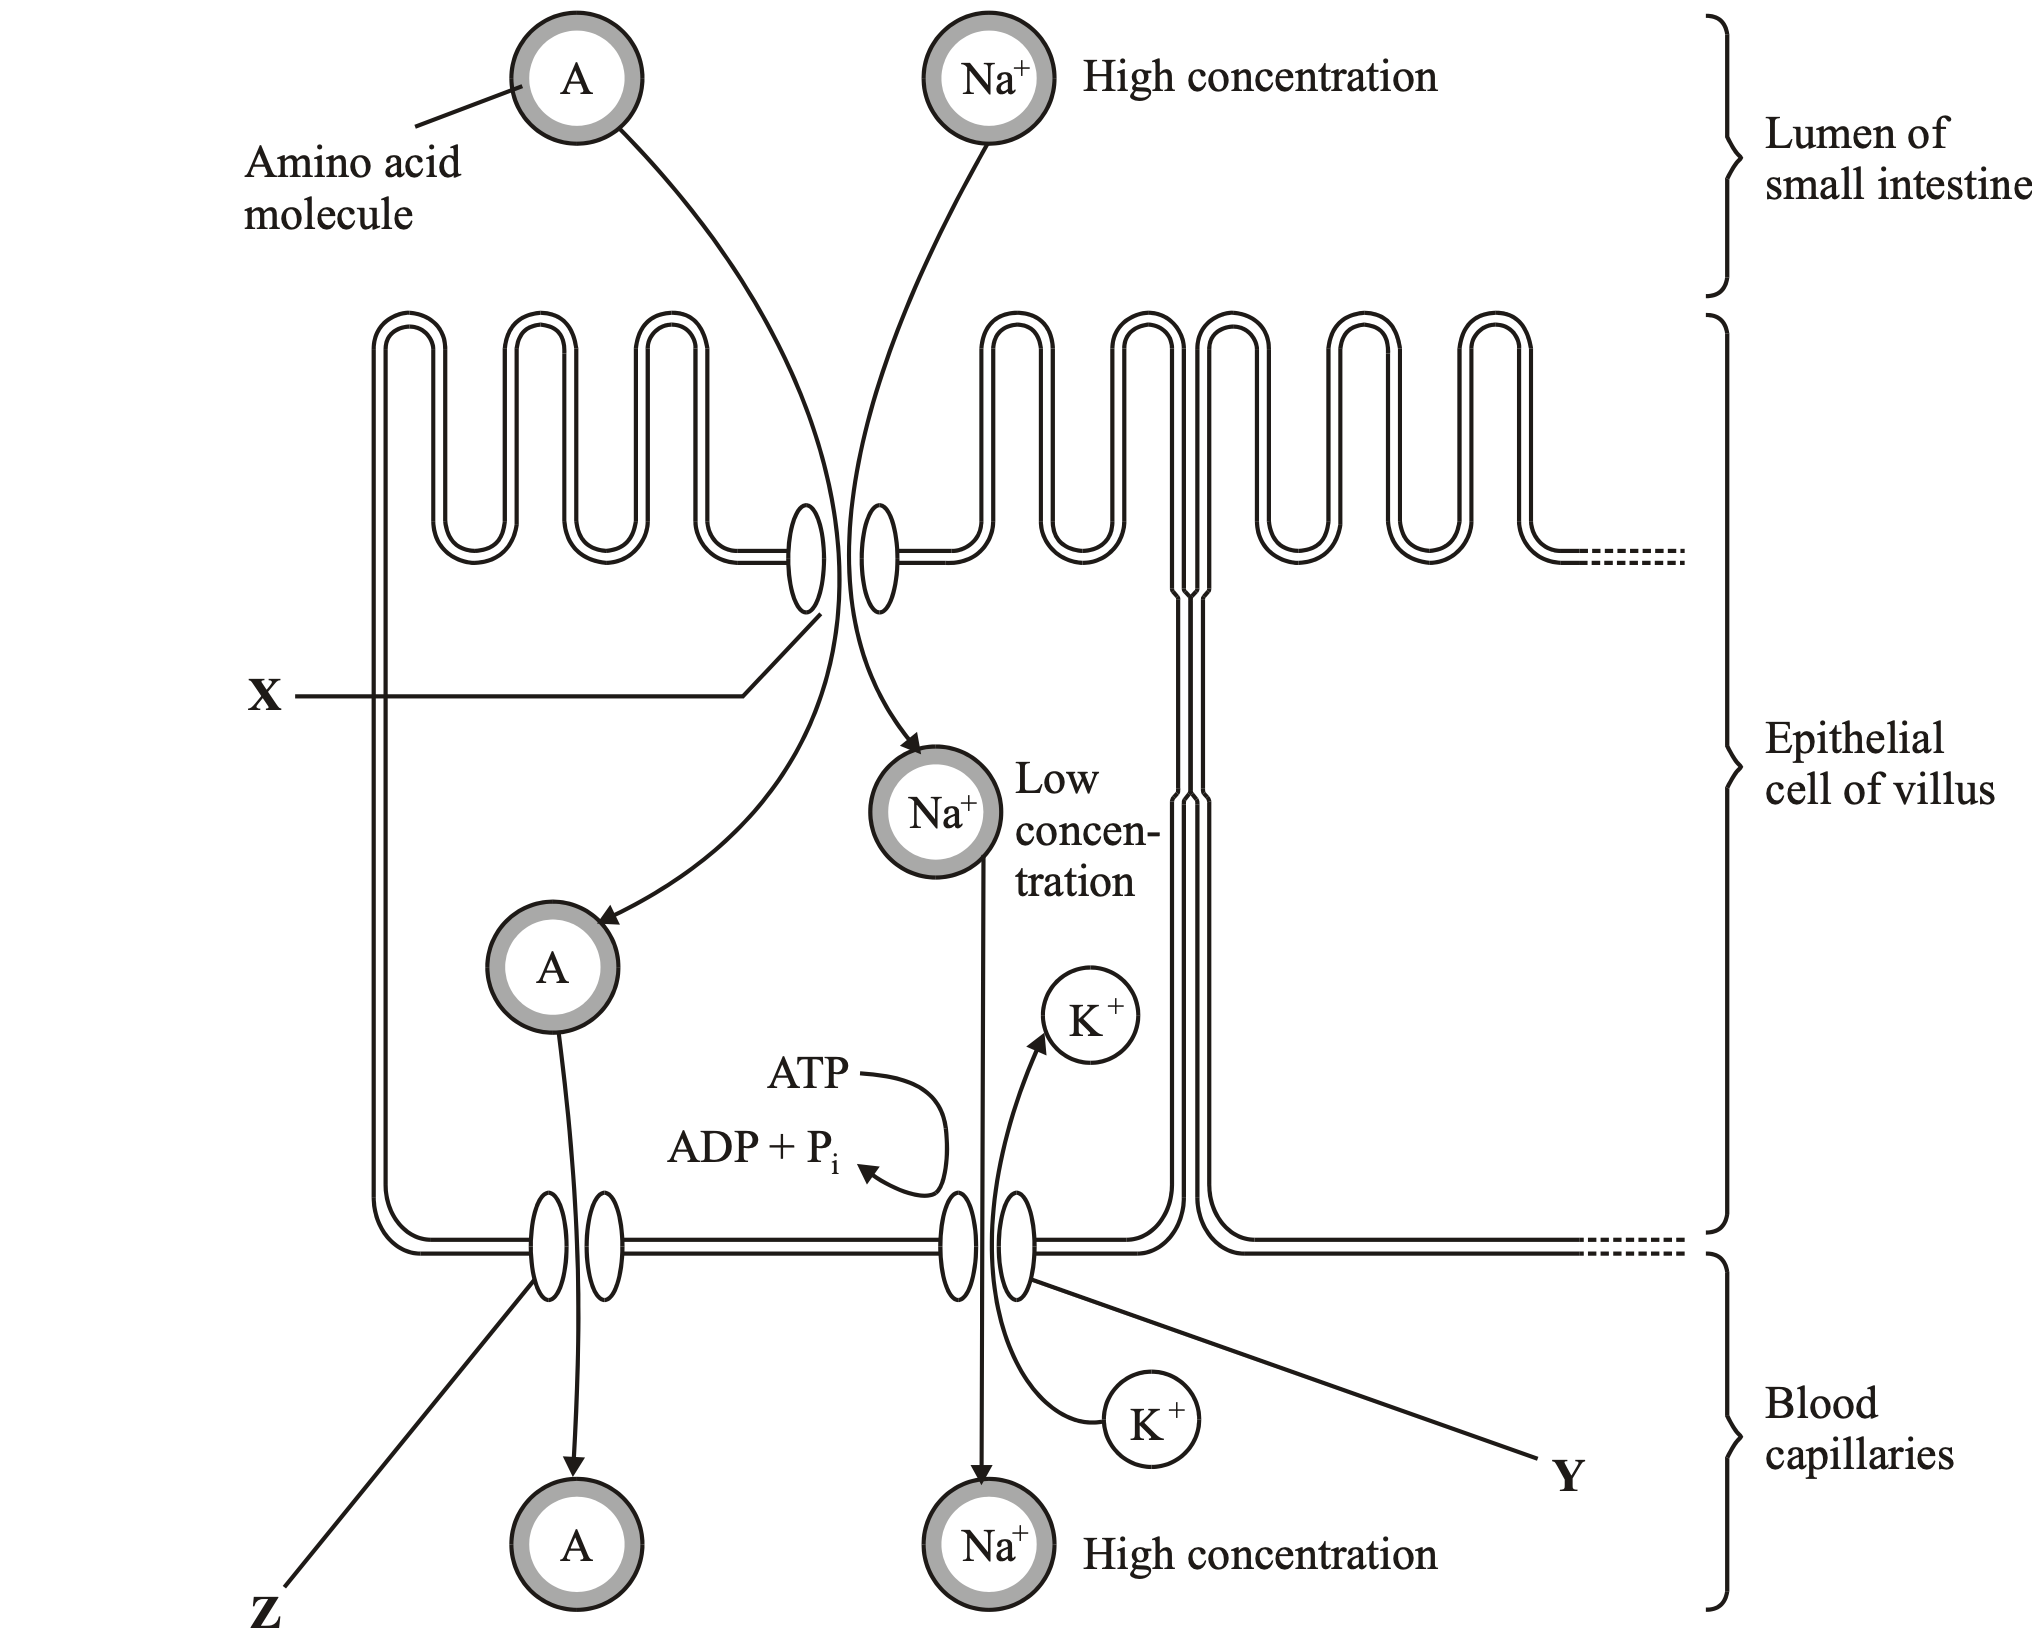
The diagram shows one method by which amino acids are absorbed from the small intestine into
the blood. They are co-transported into the epithelial cell with sodium ions (Na+) at point X on
the diagram. Normally, the concentration of sodium ions inside the epithelial cell is low.
Why does pump Y no longer work?
Lack of ATP;
Pump = active transport / requires energy / ATP provides energy /
transport is up
concentration gradient;
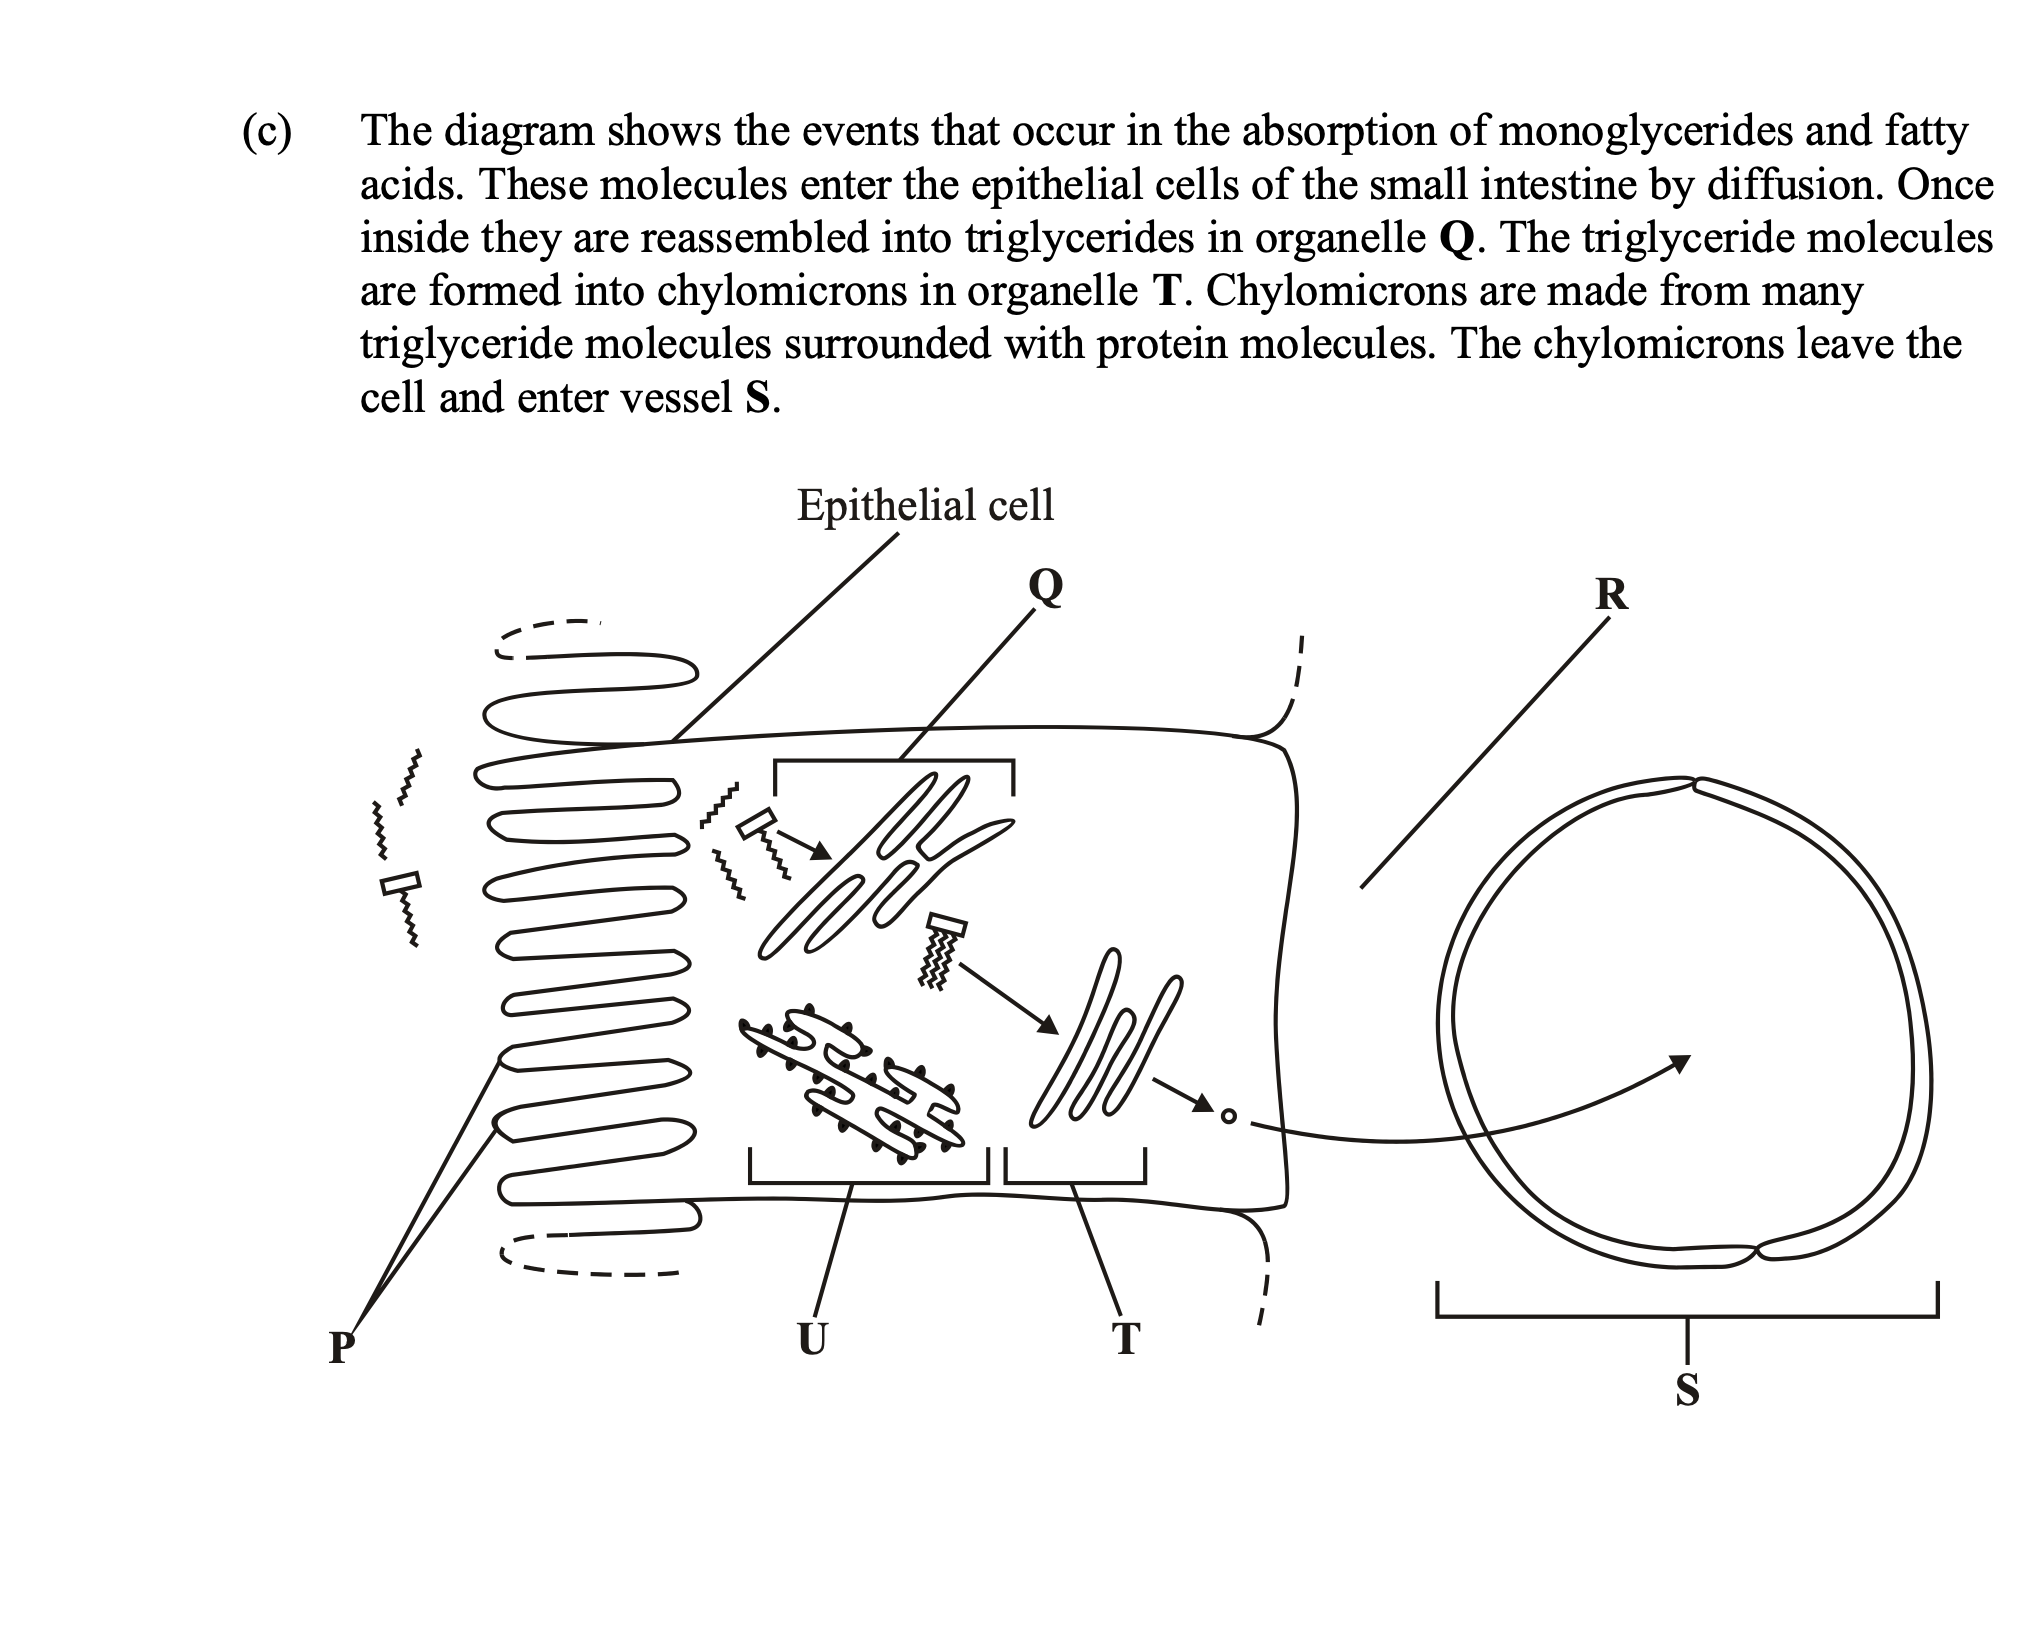
Describe the role played by organelle U in the formation of chylomicrons.
proteins are synthesised by U;
involvement of ribosomes;
protein isolation / transport (inside RER);
vesicle formation;

interphase
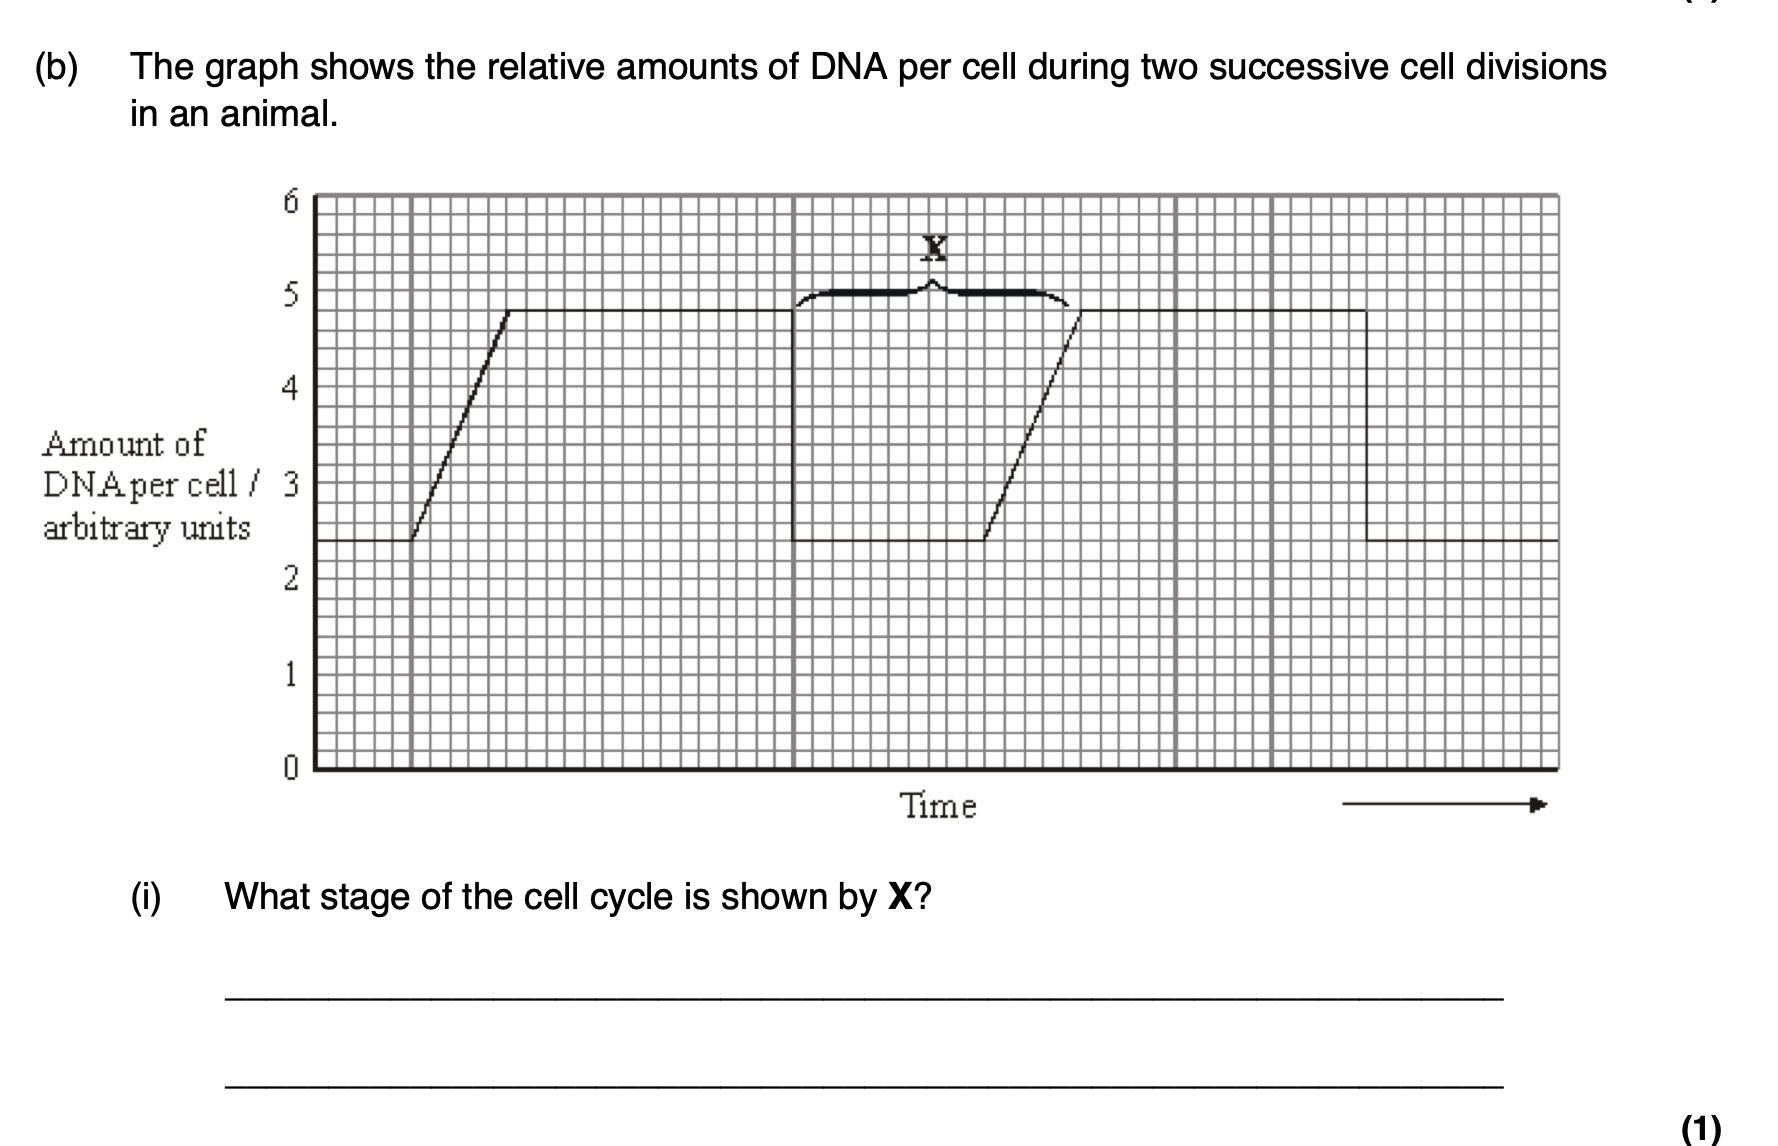
Apart from an increase in the amount of DNA, give one process which occurs during
stage X which enables nuclear division to occur.
cell replication
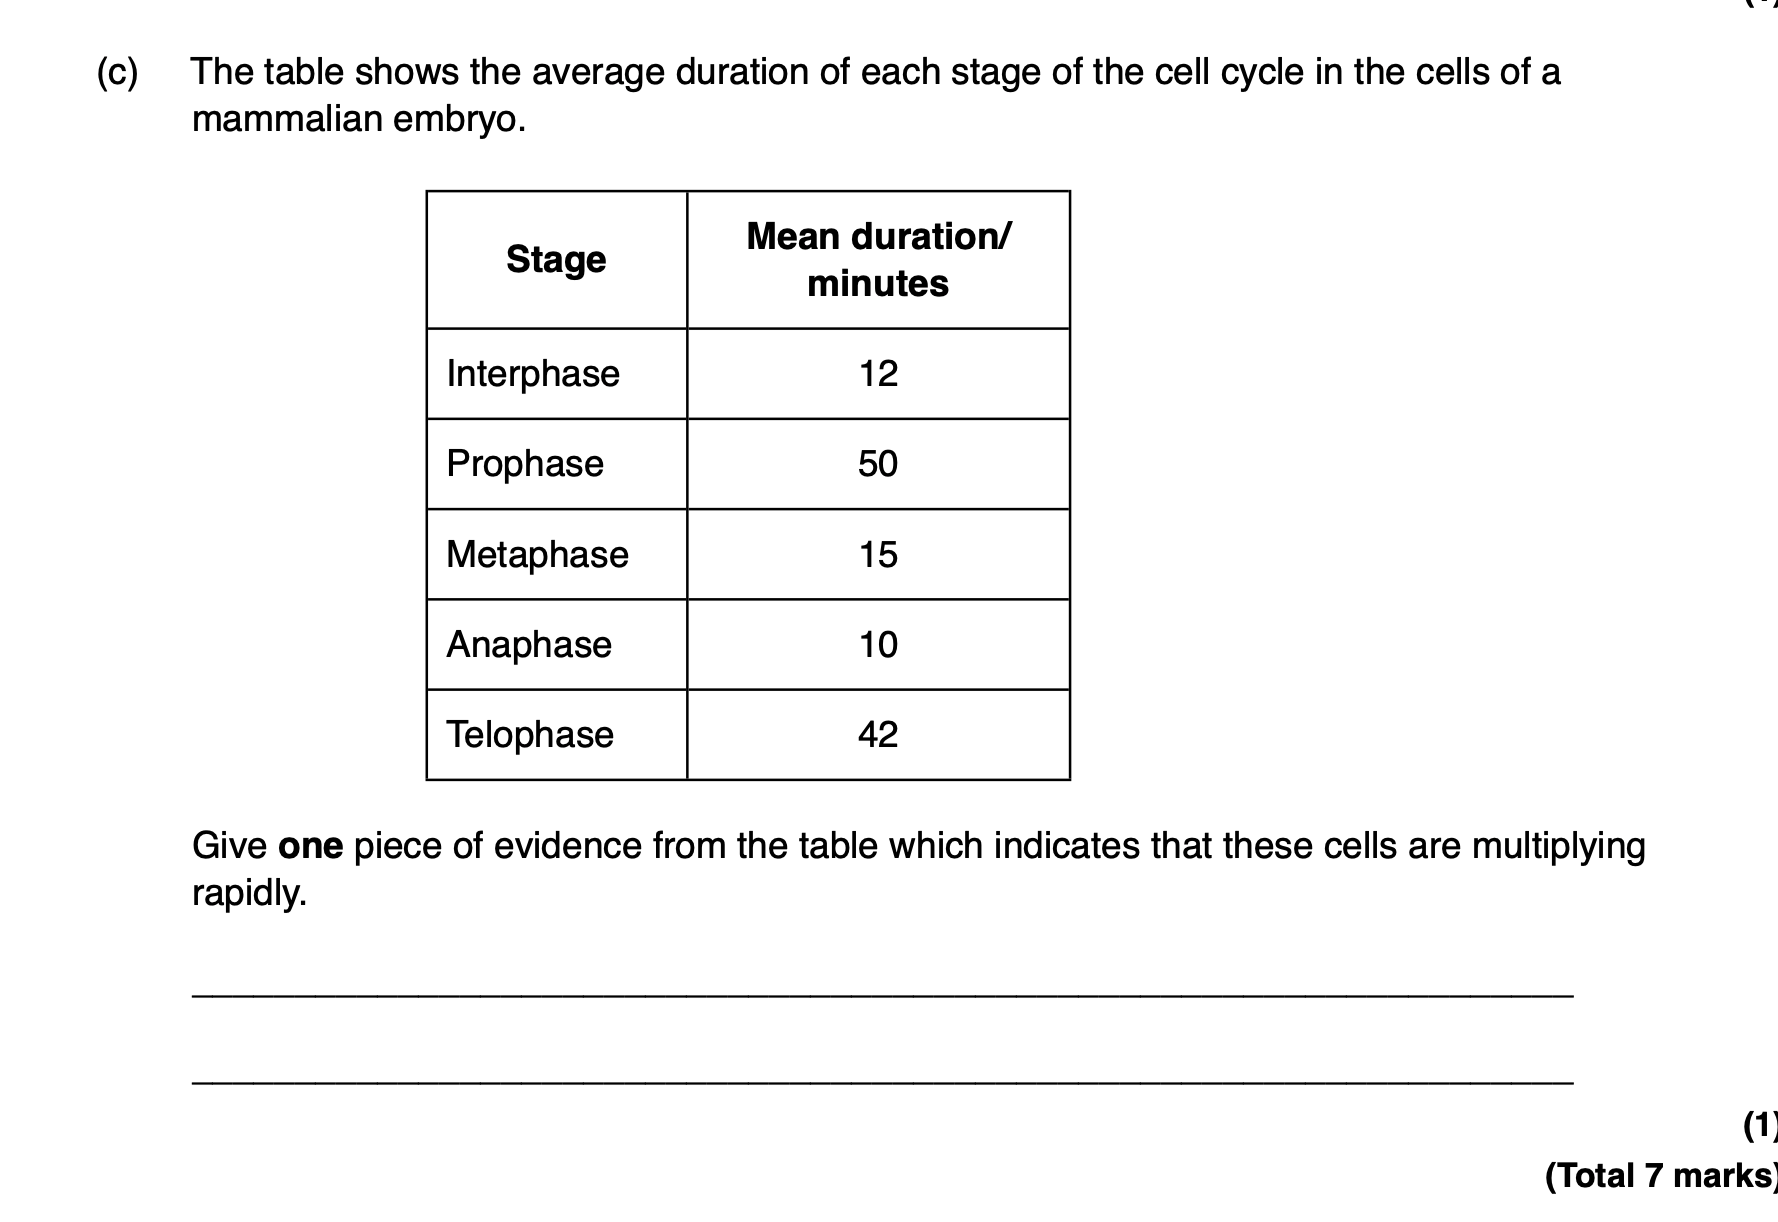
short duration of interphase
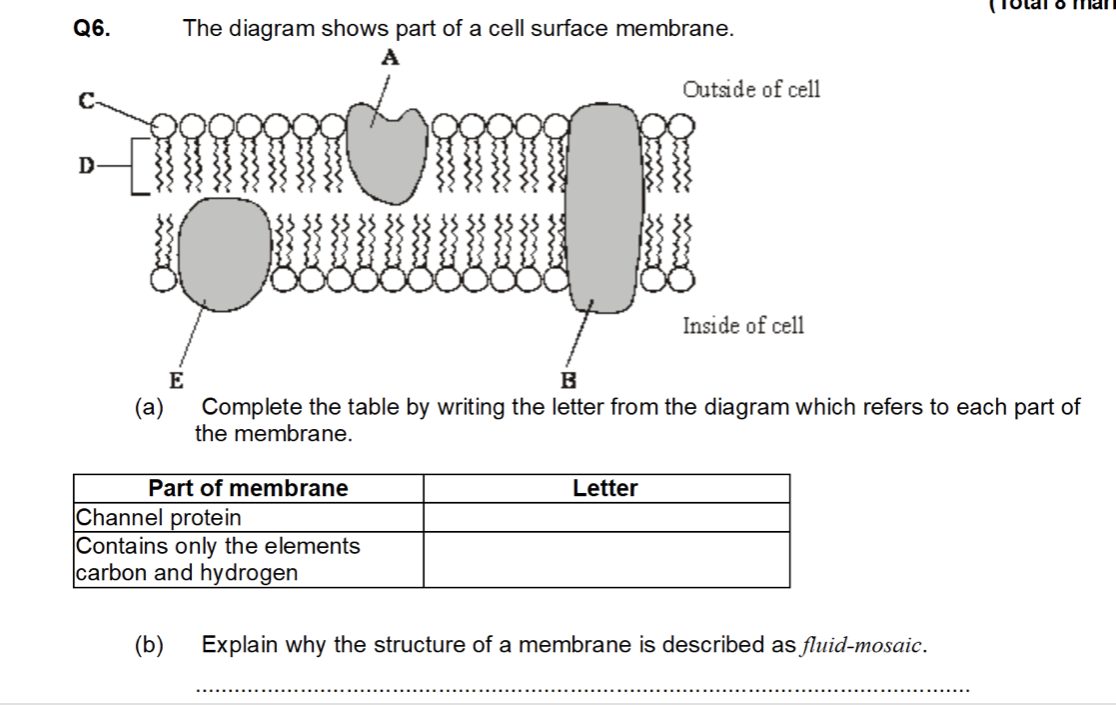
a. B,D
b. idea of molecules/named molecules moving = fluid
mosaic= both proteins and phospholipids
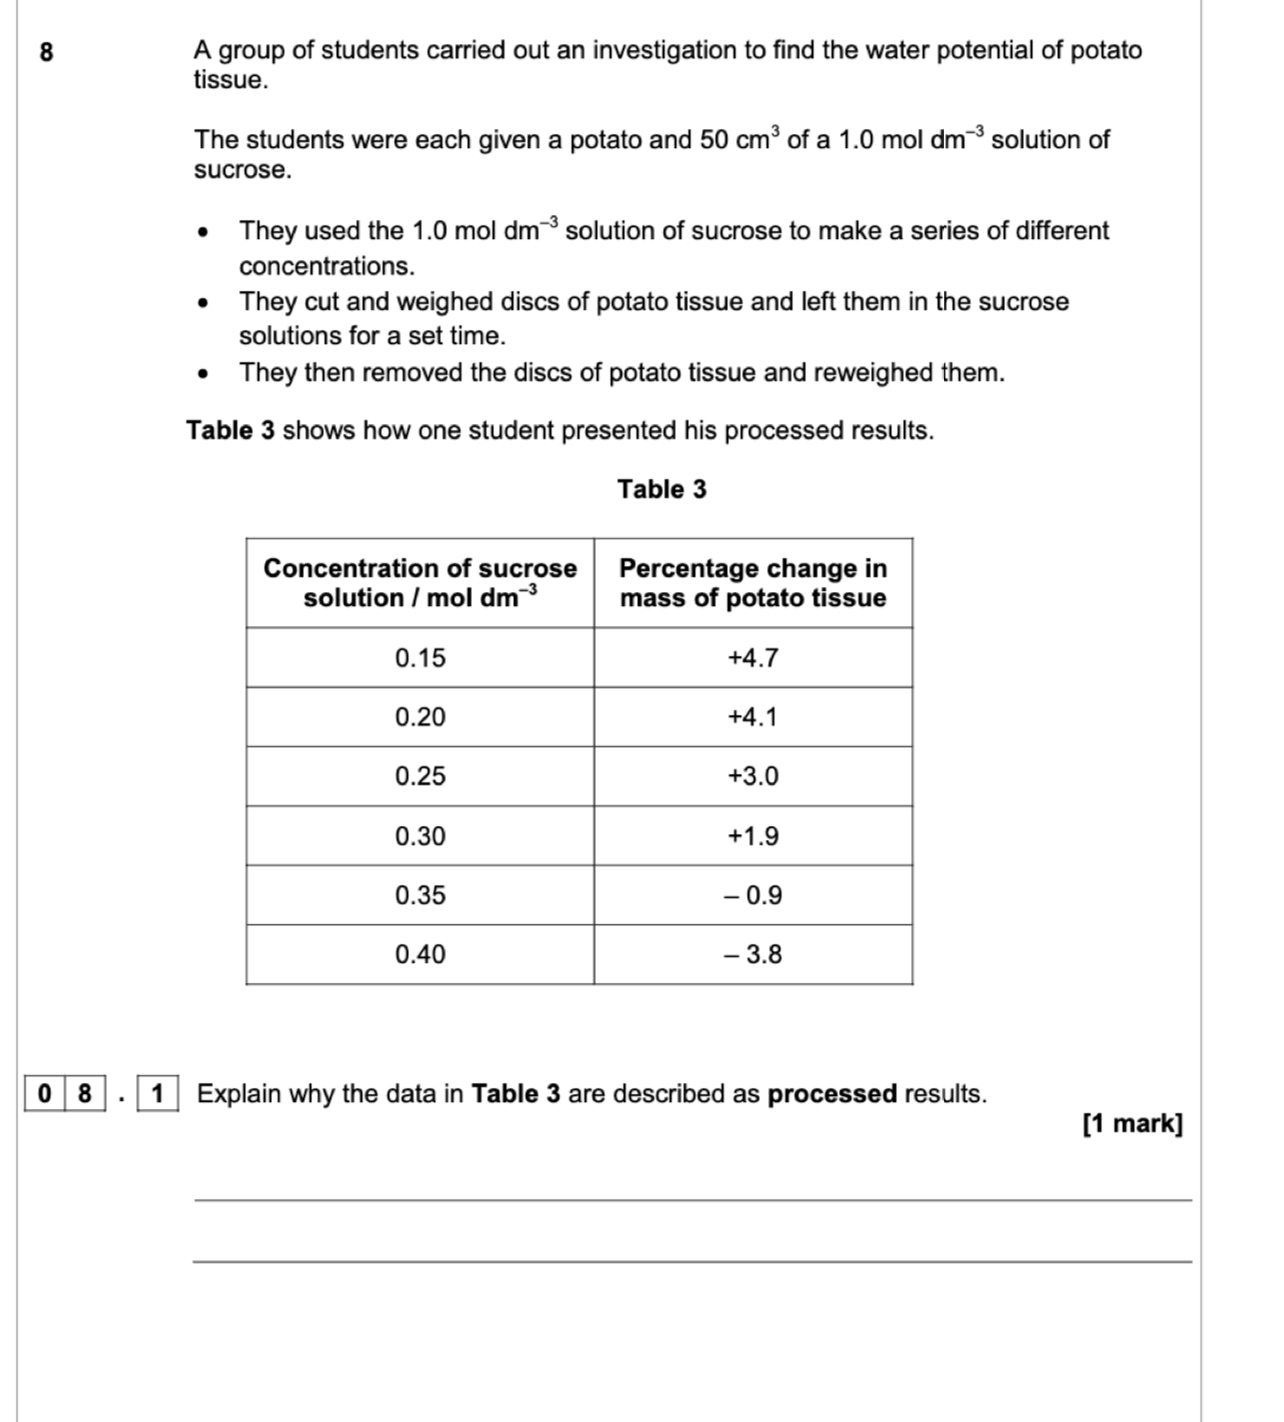
Calculations made from raw data/ raw data would have been initial and final mass
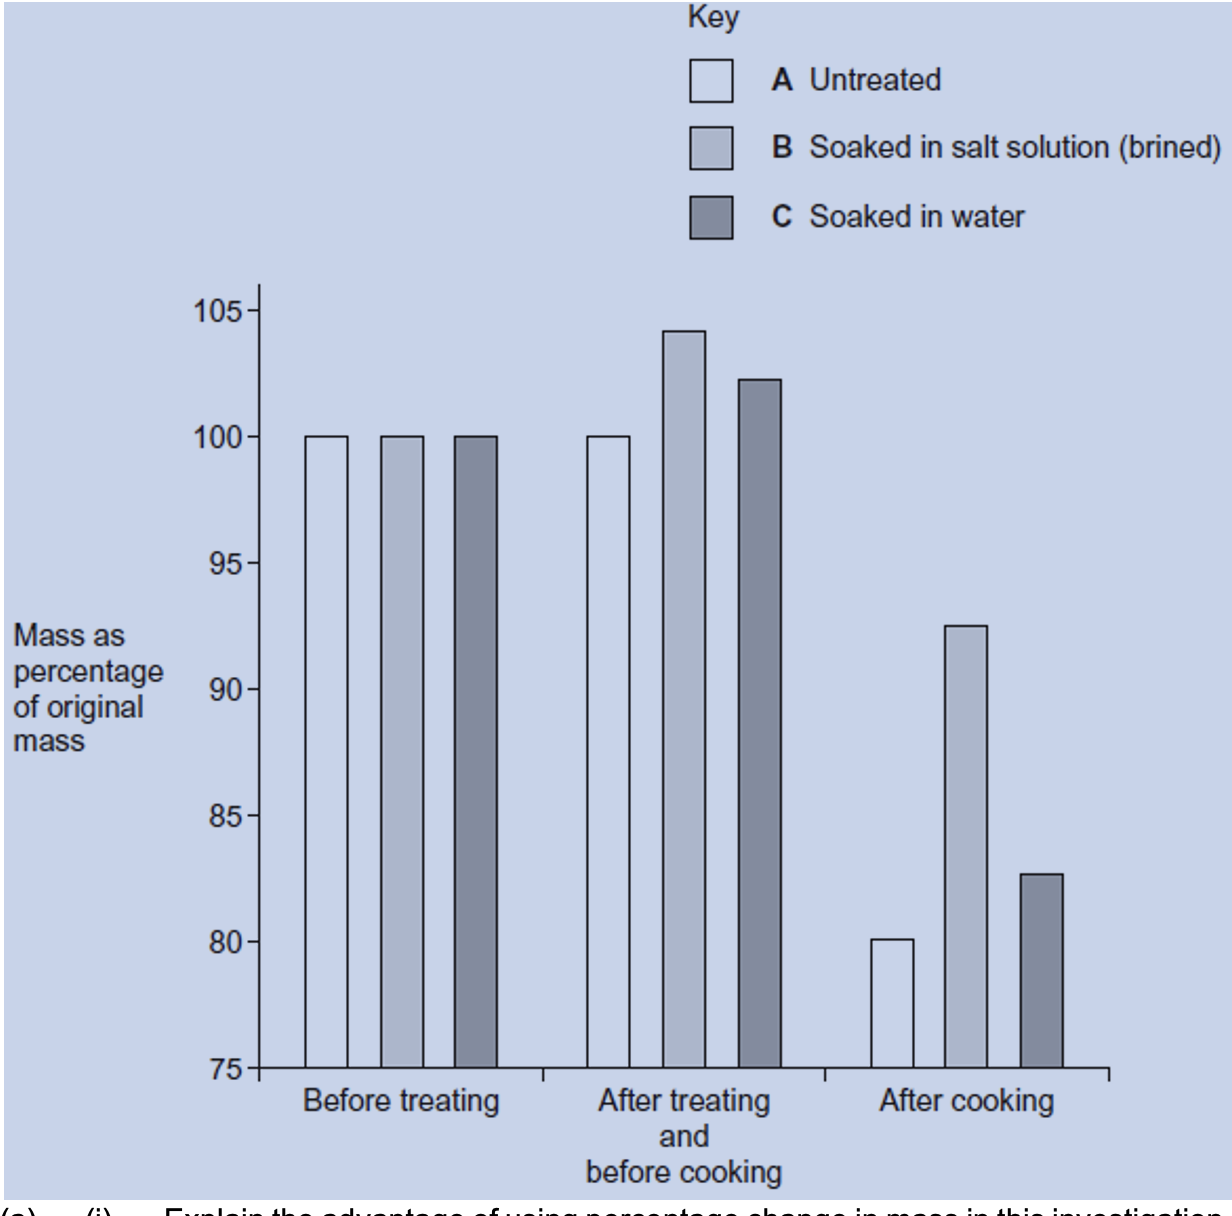
Q12.Turkey meat can dry out when it is cooked in an oven. One way to overcome this is to soak
the meat in a salt solution before cooking it. This is called brining.
A food writer organised a demonstration. He treated three similar pieces of turkey in
different ways.
• Piece A was untreated.
• Piece B was soaked overnight in a 6% solution of salt. A 6% solution of salt has a
greater solute concentration than the cells in turkey meat.
• Piece C was soaked overnight in water.
He put all three pieces in an oven at 150 °C. He left each piece until it was cooked and the
temperature in its centre was 65 °C. The writer weighed each piece at different stages in
the demonstration. The graph shows his results.
(i) Explain the advantage of using percentage change in mass in this
investigation.
(ii) The pieces of turkey meat were cooked. Explain the advantage of leaving them
in the oven until the temperature in the centre of each piece was 65 °C.
i. 1. Allows results to be compared;
2. Because initial masses may have been different;
ii. 1. Quantitative measure (of cooking);
2. Ensures all cooked to same extent as not all turkey pieces same
shape / thickness
Short diffusion pathway (to cells)
OR
It has a surface permeable (to water/ions into cells);
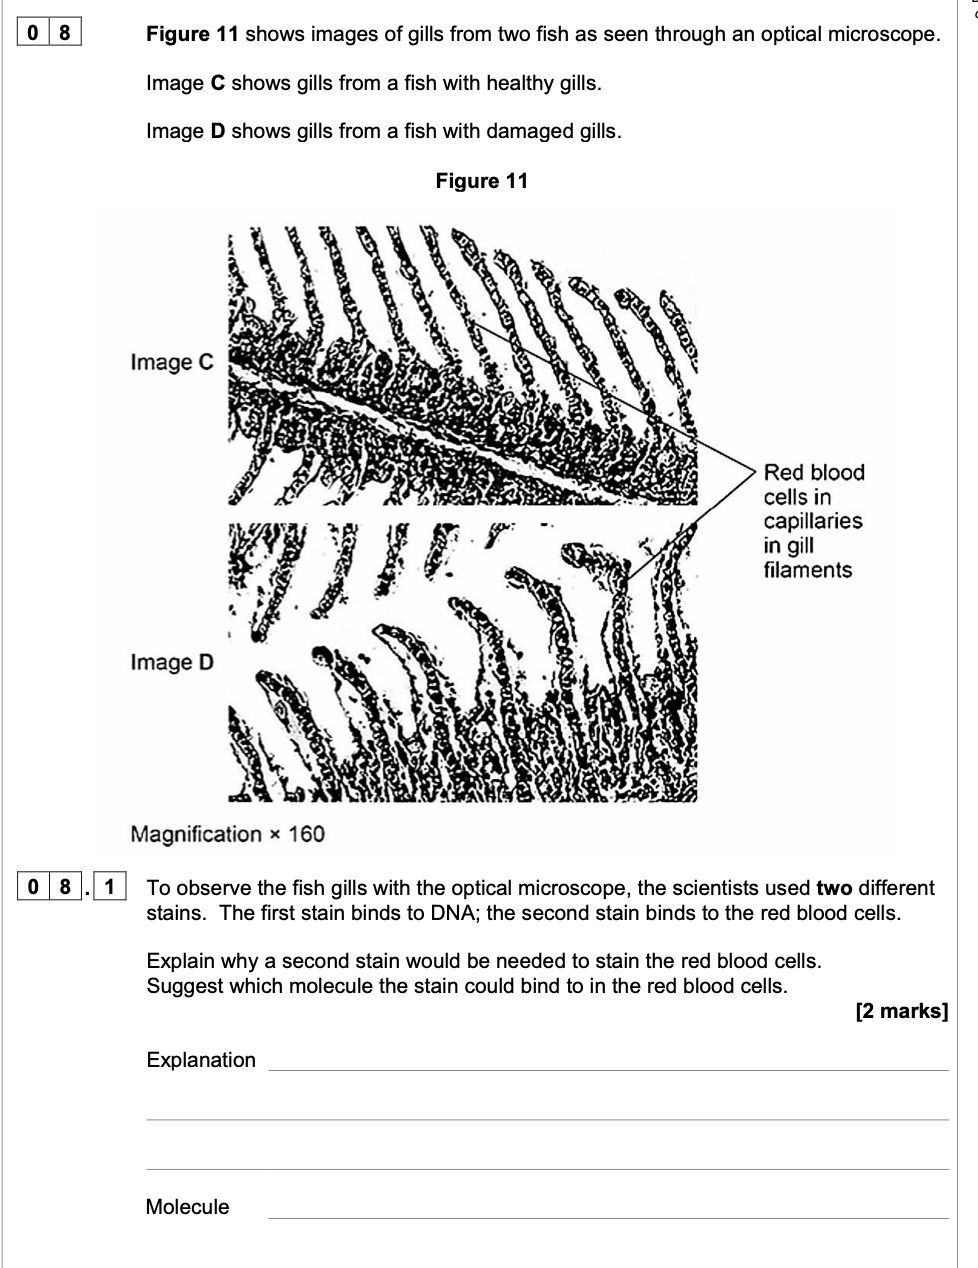
1. (Red blood cells) do not have a nucleus/DNA;
2. Haemoglobin;
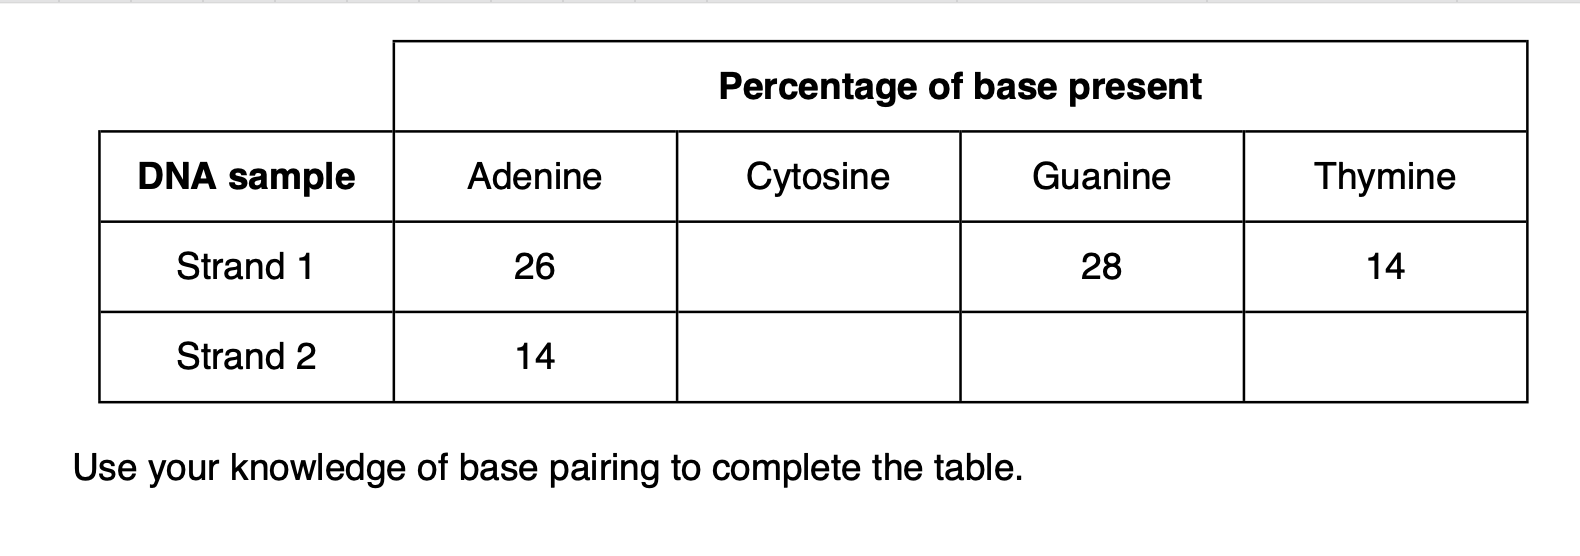
32;
28 32 26;
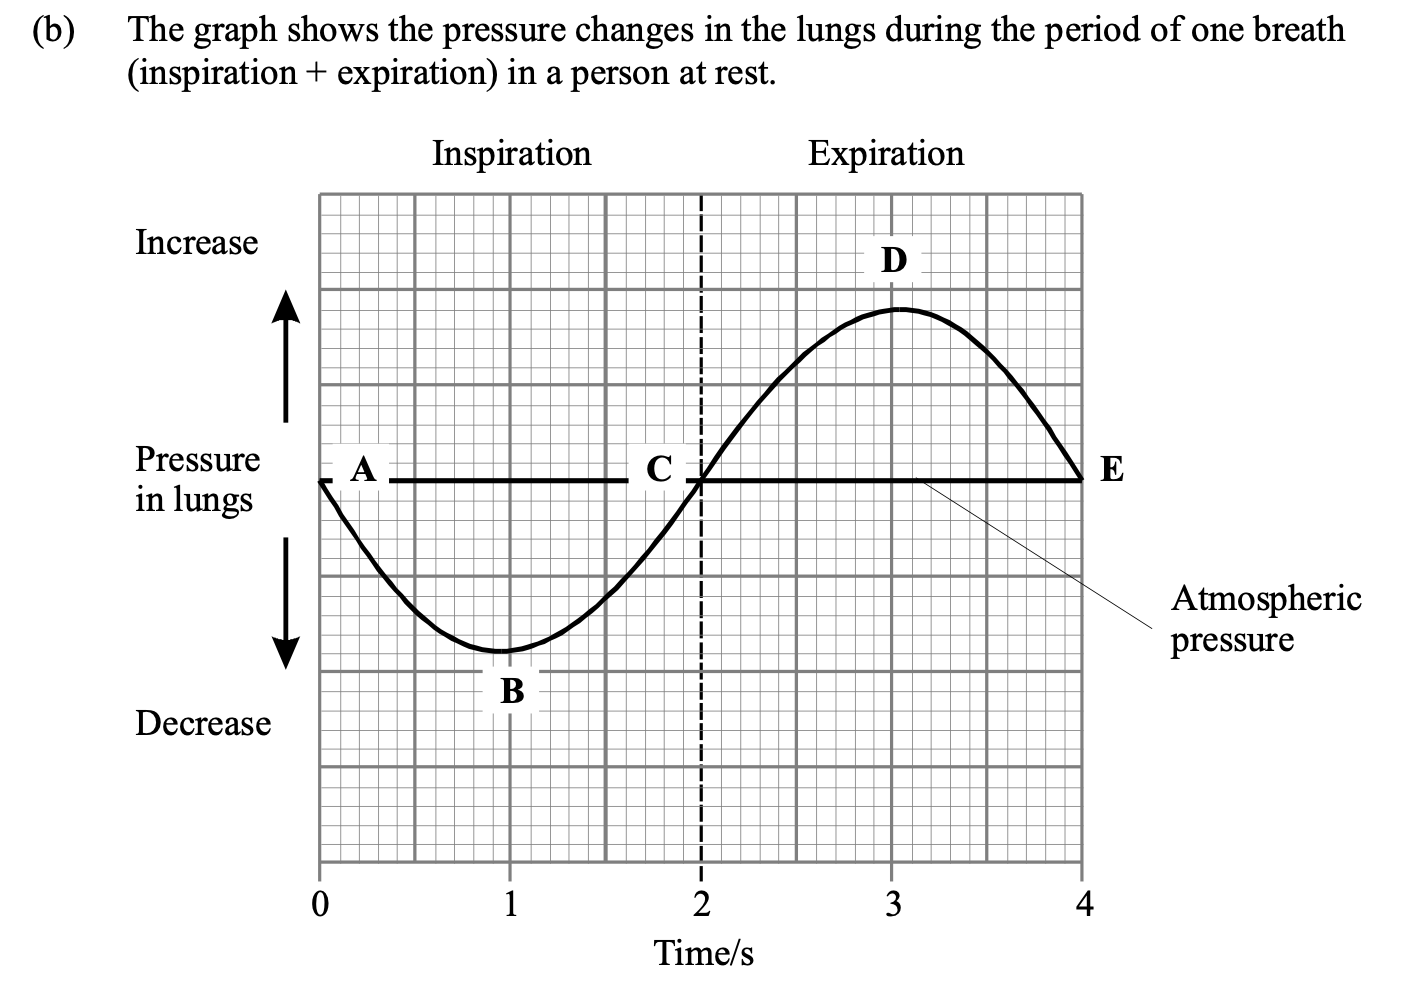
Use your knowledge of breathing to explain the changes in pressure during inspiration
and expiration. The letters on the graph are to help you to refer to different parts of the
curve.
A - B: volume of lungs/ thorax increases;
due to contraction of diaphragm muscles;
contraction of (external) intercostal muscles raising ribs;
pressure falls / decreases;
B - C: atmospheric pressure / difference in pressure forces air in;
C - D: Pressure increased by elasticity of lungs;
contraction of (internal) intercostal or abdominal muscles;
D - E : air expelled, so pressure falls / due to thorax pressure.
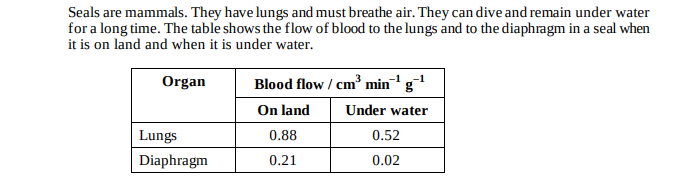
Explain why the figures in the table are given per gram of tissue.
Allows comparison; As organs differ in size; Larger organs will need more blood;

The scientists put the same number of skin tumour cells in each dish at the start of
thisinvestigation. Explain why it was important to put the same number of cells in each
dish.
To ensure the colour is the same at the start;
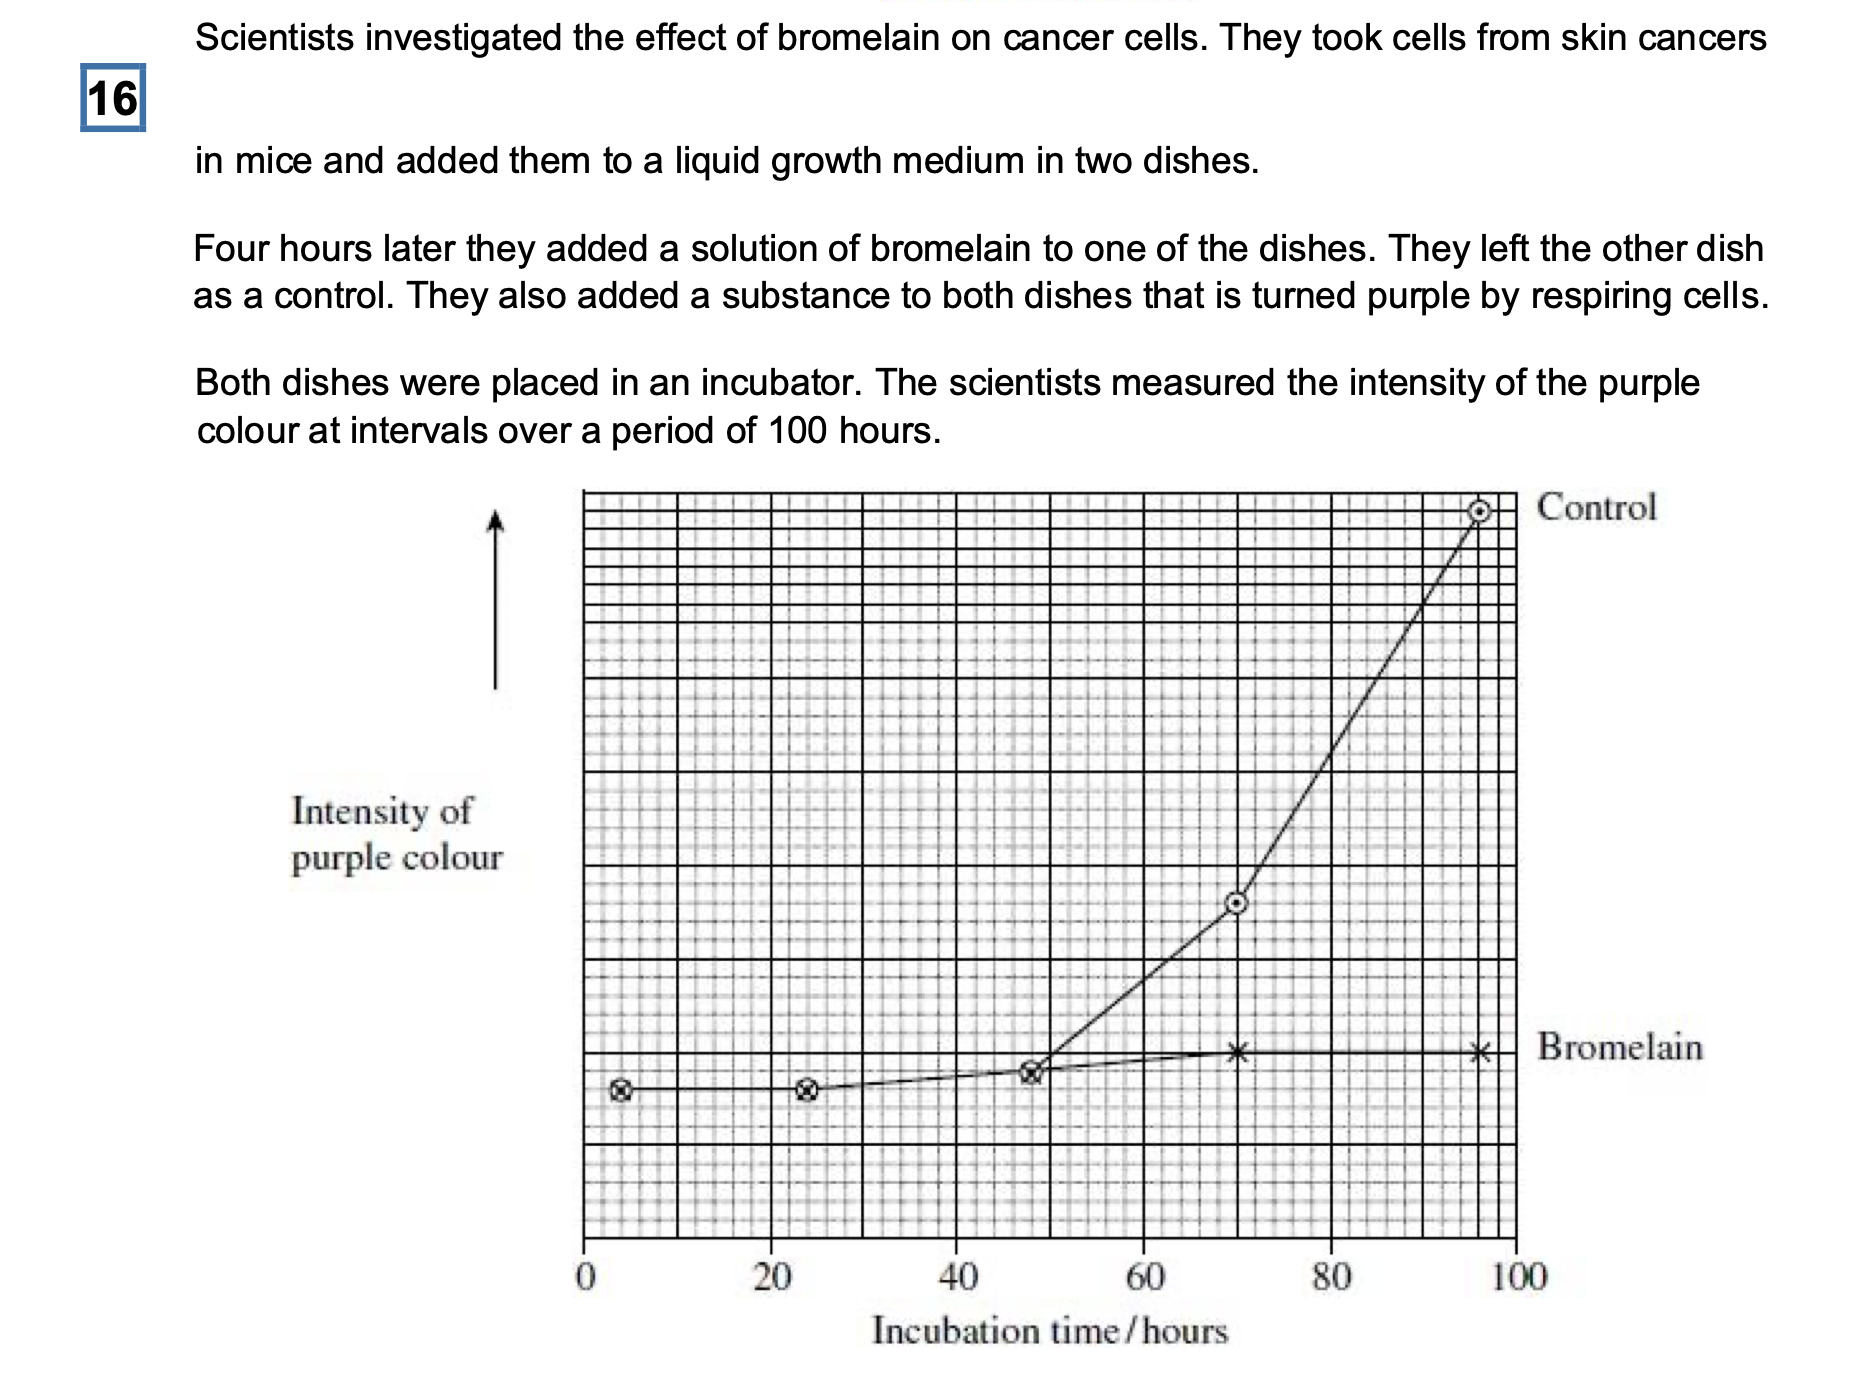
The scientists concluded that bromelain did not kill cancer cells but stopped them
dividing.Does the graph support this conclusion? Explain your answer
Yes – curve on graph with bromelain present remains approximately constant / risesvery
slightly;
Would decrease if killing of cells occurred / would increase if cells still dividing;

An article in a newspaper claimed that these data show that bromelain can be used to
treatcancer.
Give three reasons why we should be careful about accepting this claim.
Use of mouse cells (rather than human);
(Carried out) in vitro / not in living organisms;
Only tested on one type of cancer;
Not possible to predict effect on humans (as no data collected);
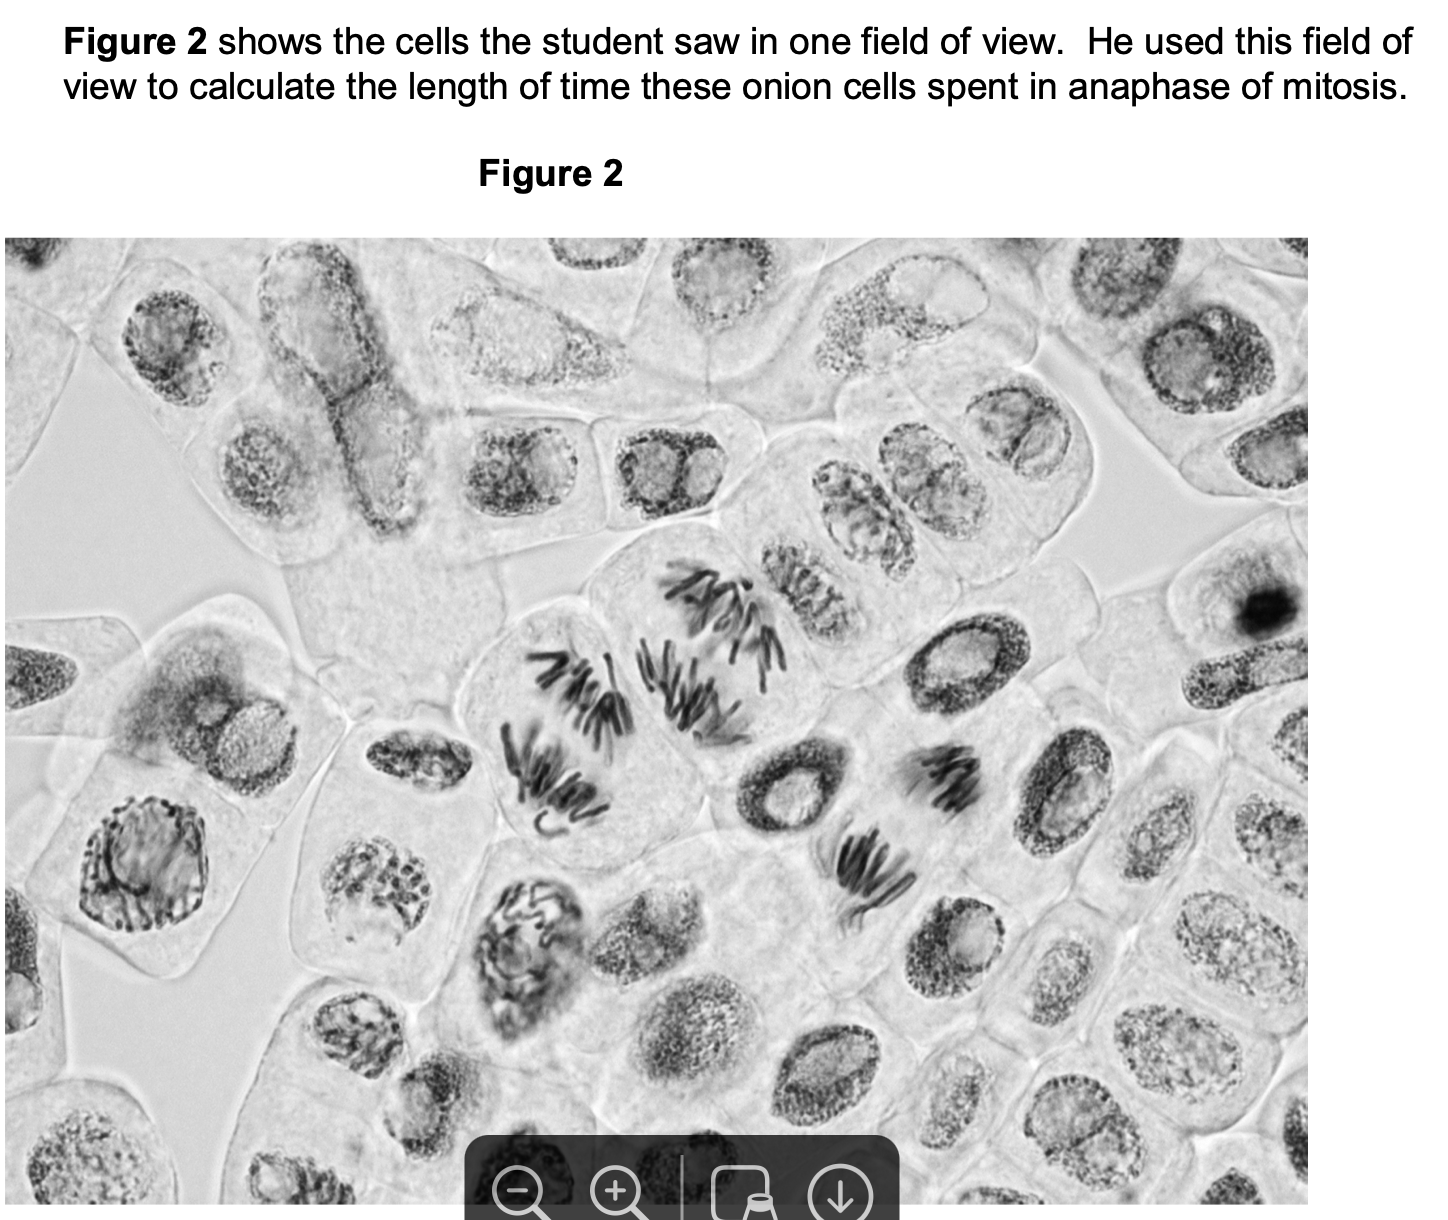
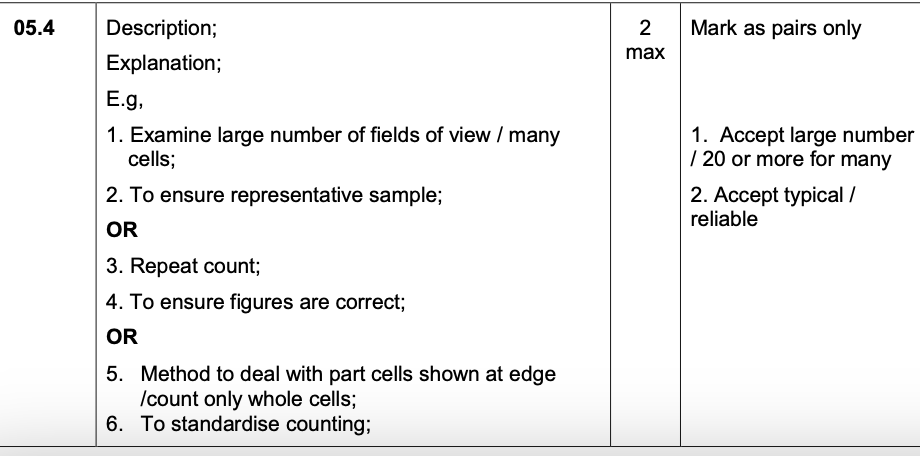
Describe and explain what the student should have done when counting cells to make
sure that the mitotic index he obtained for this root tip was accurate.
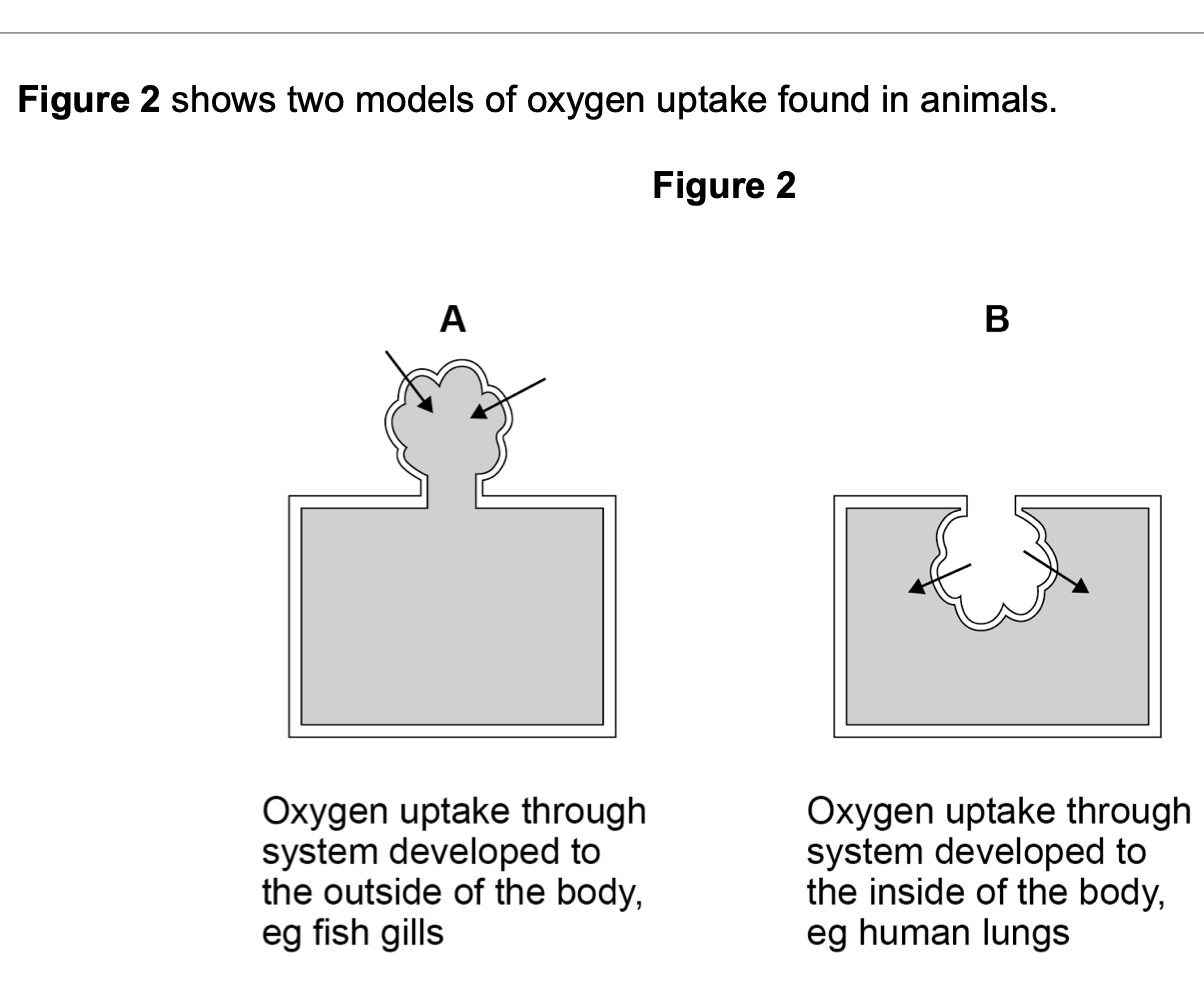
Suggest how the environmental conditions have resulted in adaptations of systems
using Model A rather than Model B.
1. Water has low(er) oxygen partial
pressure/concentration (than air);
2. So (system on outside) gives large surface area
(in contact with water)
OR
So (system on outside) reduces diffusion
distance (between water and blood);
3. Water is dense(r) (than air);
4. (So) water supports the systems/gills;
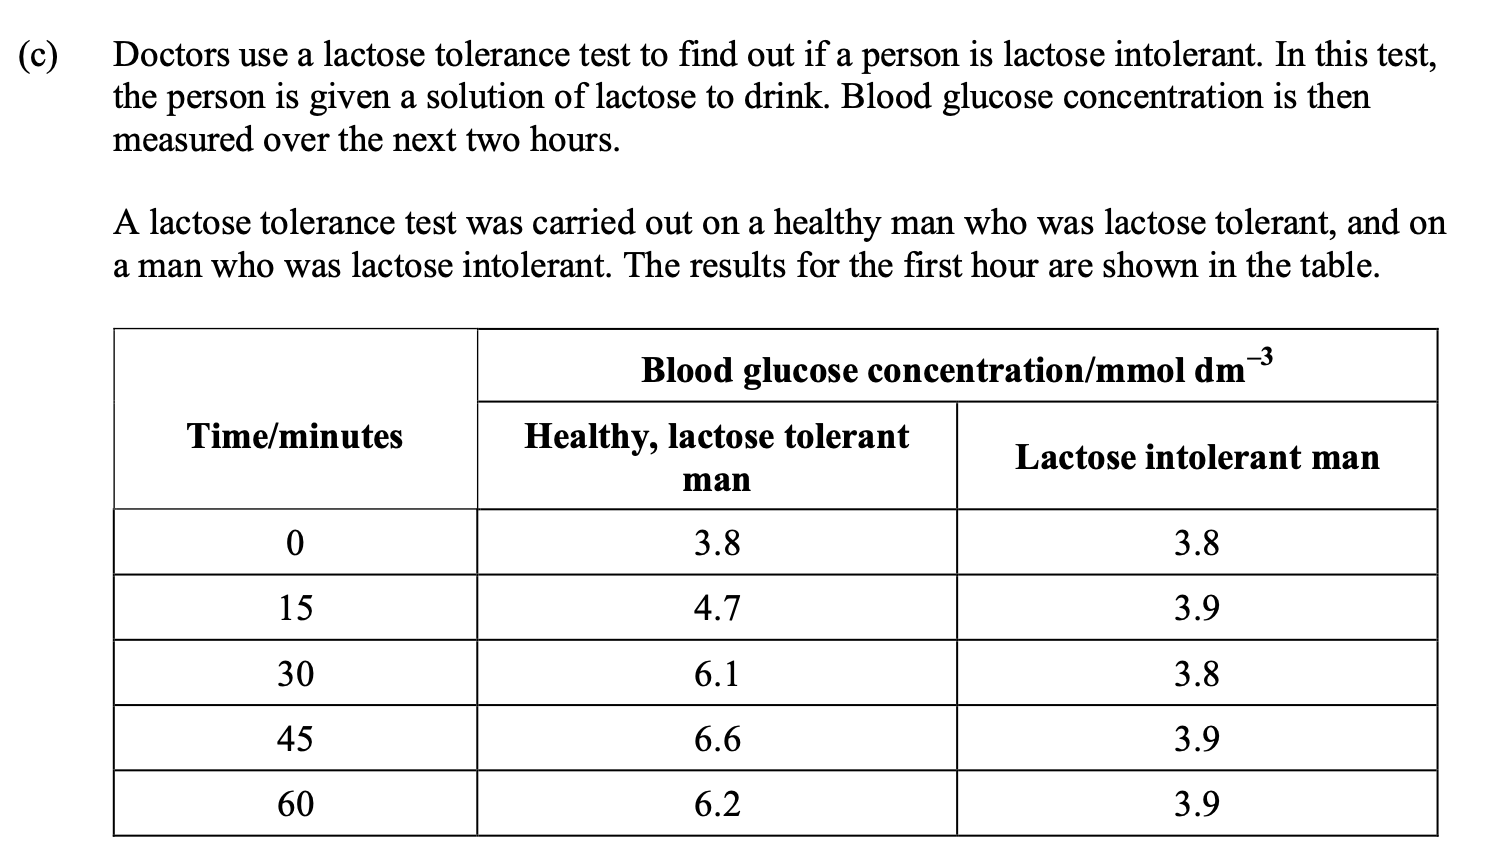
Lactose is present in milk. It is broken down by lactase into glucose and galactose. This is
shown in the equation
Explain the results for the lactose intolerant man.
No lactase;
Therefore lactose not digested/glucose not produced;
No glucose absorbed therefore concentration in blood stays the
same/does not rise;
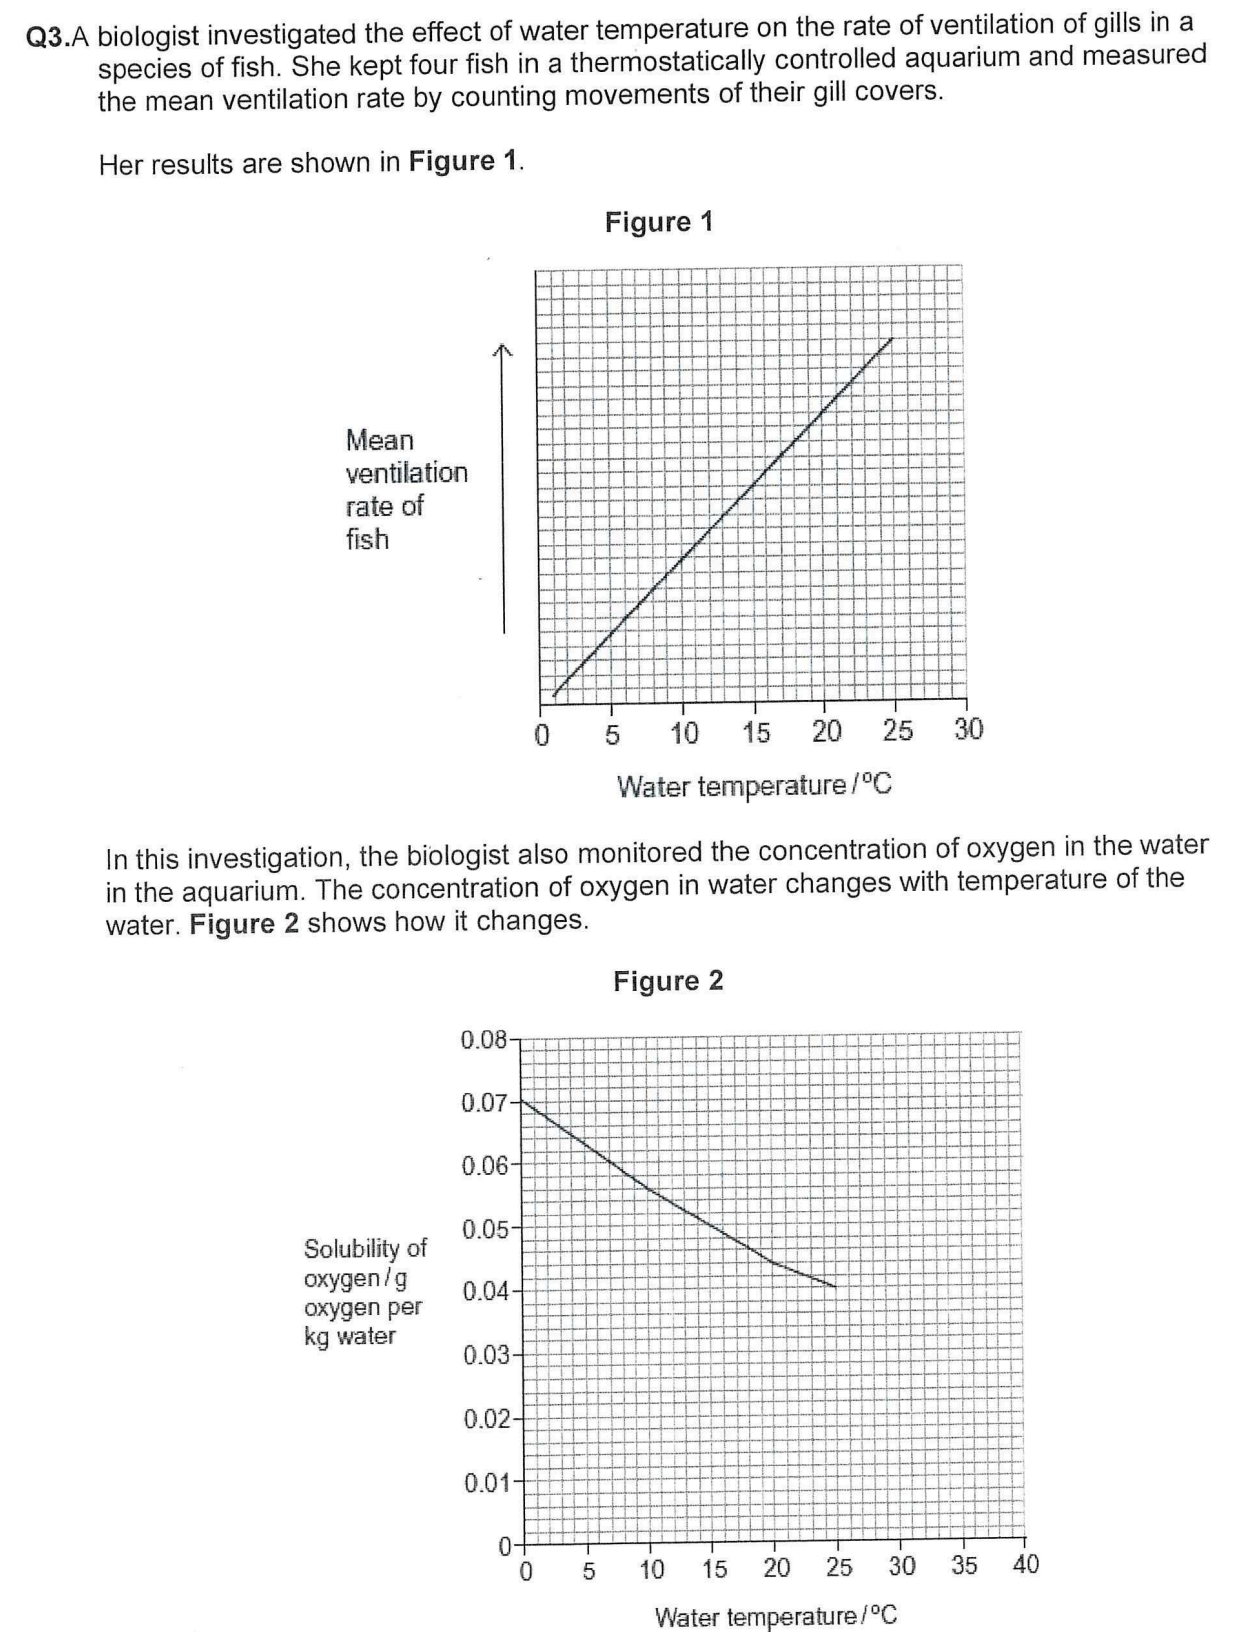
Suggest a difficulty of counting movements of gill covers as a method of measuring
rate of ventilation in fish.
(FIGURE 2 X AXIS: WATER TEMPERATURE)
Fish keep moving / swimming / movement of gill covers too fast to count (at higher temperatures).
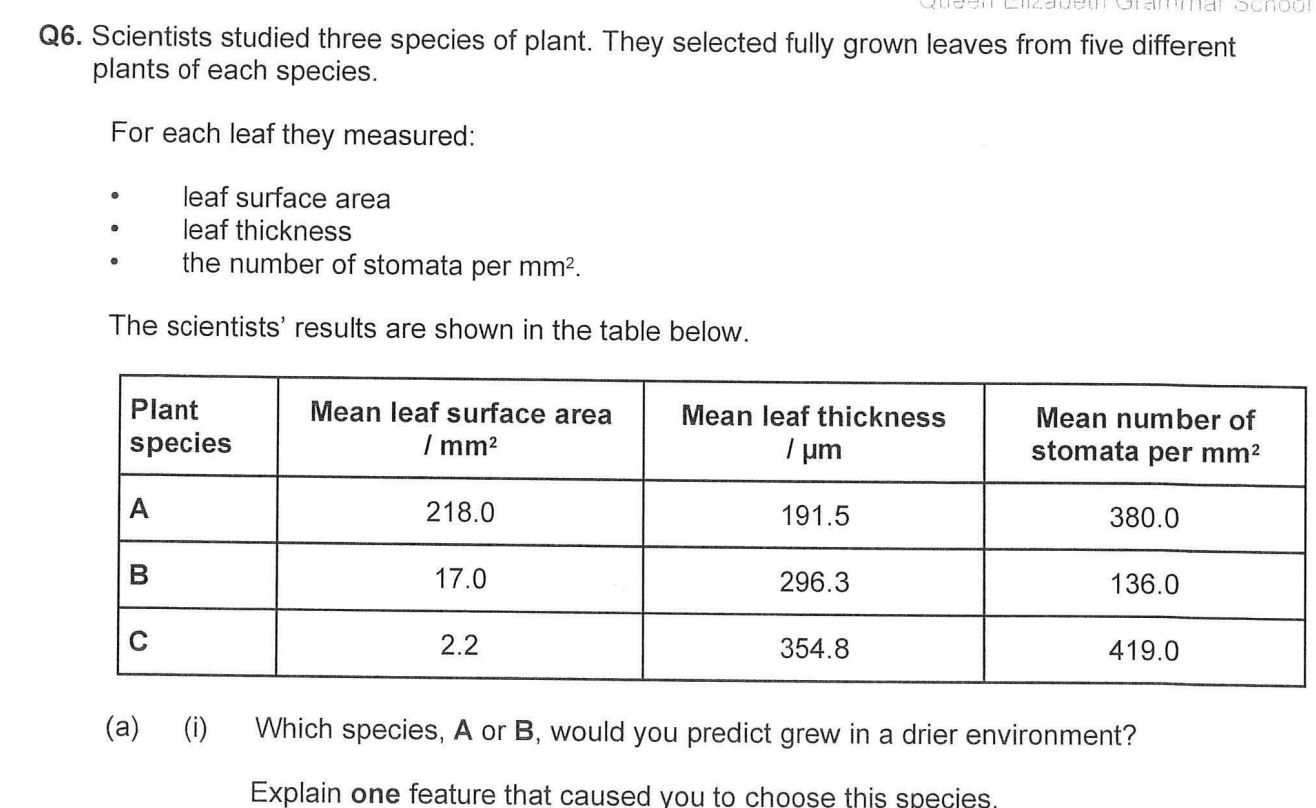
Which species, A or B, would you predict grew in a drier environment?
Explain one feature that caused you to choose this species.
(i) Species B (no mark)
Correctly selected feature and the explanation required for 1 mark:
1. Smaller surface area
so
less evaporation / less heat absorbed;
2. Thicker leaves
so
greater diffusion distance (for water);
Accept ‘thicker leaves so more water storage’.
3. Fewer stomata / lower stomatal density
so
less diffusion / evaporation (of water);
4. Smaller surface area to volume ratio
so
less evaporation.

Species C has a high number of stomata per mm2. Despite this it loses a small amount of water.
use data to explain why
Small leaves / surface area so (total) number of stomata is low.
Both aspects needed for mark.
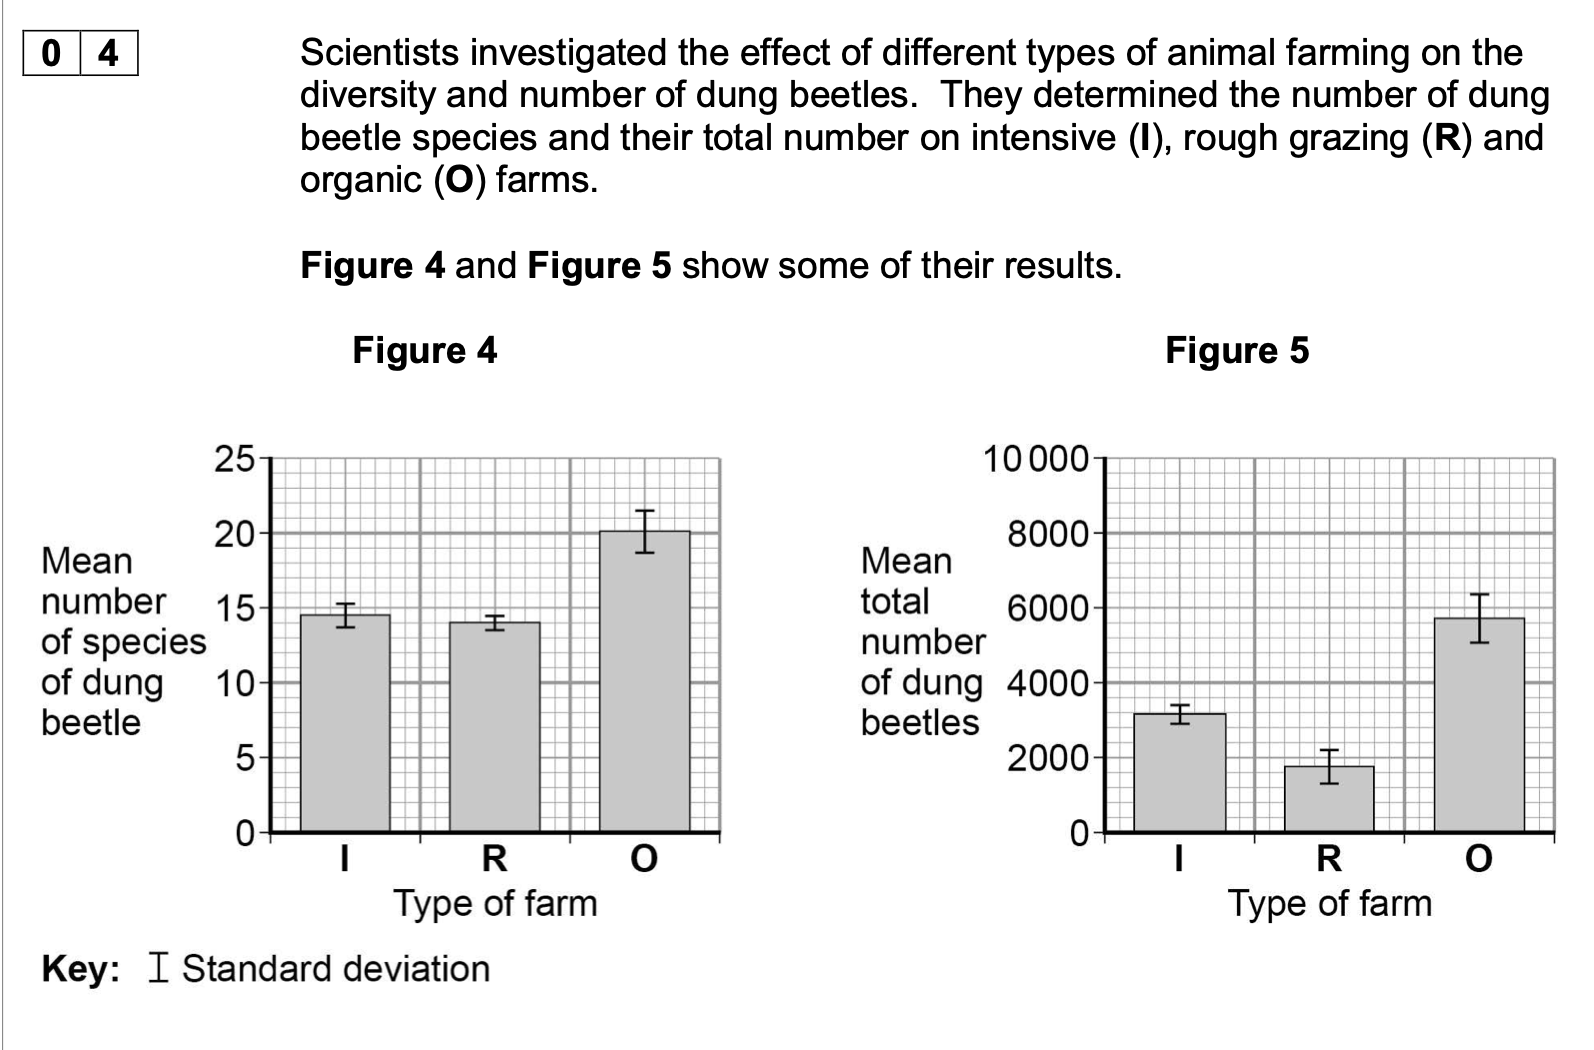
Explain what the standard deviations suggest about the difference in mean total
number of dung beetles between the different types of farm.
1. No overlap in standard deviations;
2. (Difference in mean total)
significant/is not due to chance/is
real;
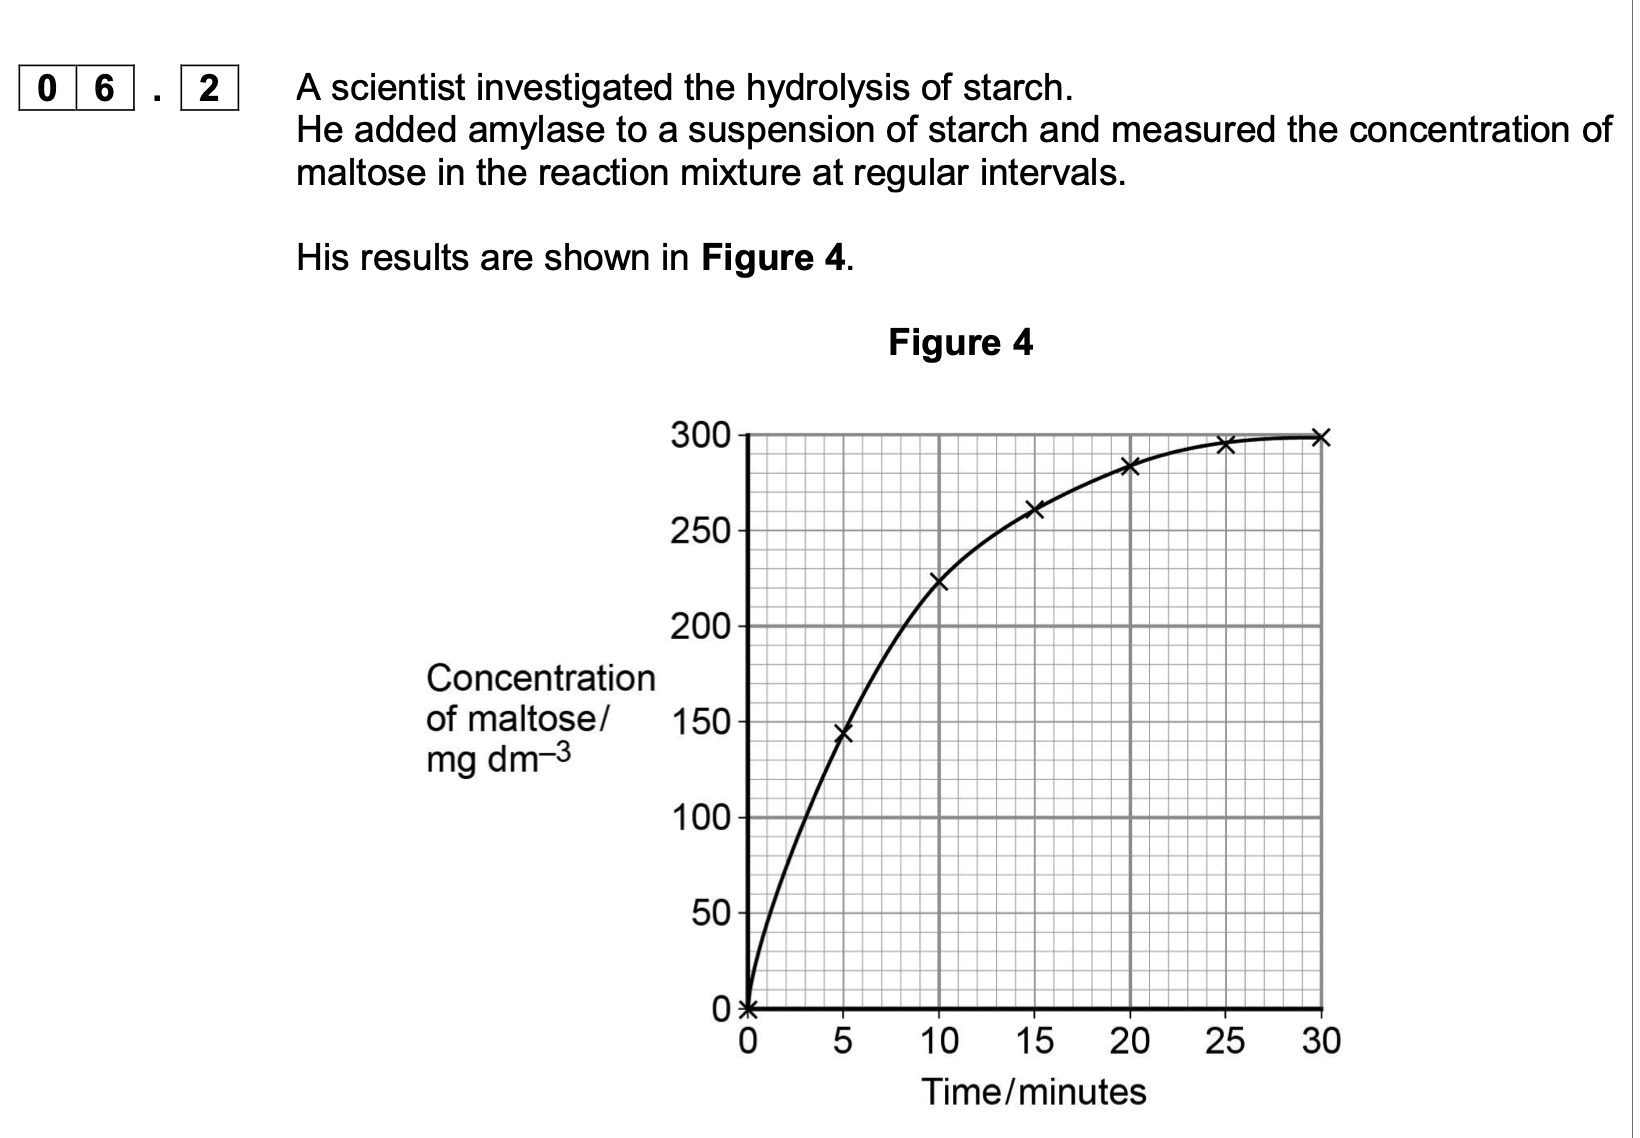
Explain the results shown in Figure 4.
1. (Rate of) increase in concentration
of maltose slows as
substrate/starch is used up
2. OR
High initial rate as plenty of
starch/substrate/more E-S
complexes;
No increase after 25 minutes/at
end/levels off because no
substrate/starch left;
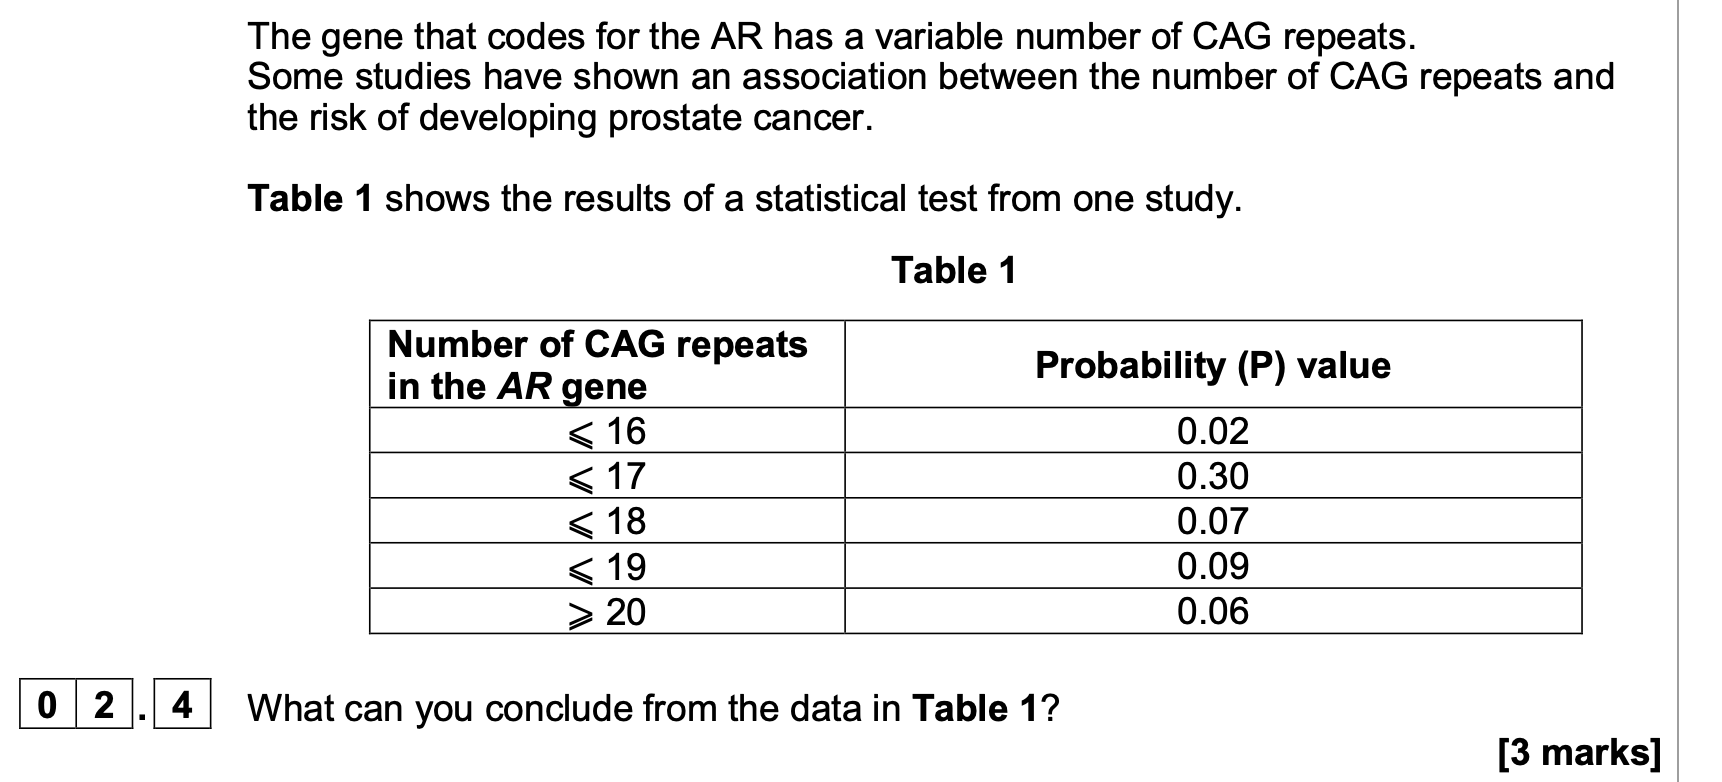
1. With 16 or fewer than 16 (repeats the
association) is significant;
2. With 17 or more than 17 (repeats the
association) is not significant;
3. With 16 or fewer than 16 (repeats) there is
less than a 5% or less than 0.05 probability
of being due to chance
OR
With 17 or more than 17 (repeats) there is
more than a 5% or more than 0.05
probability of being due to chance
3 max
OR
Explanation of a probability value e.g. 0.30
is a 0.30 or 30% probability of being due to
chance;
4. With 16 or fewer than 16 (repeats) reject the
null hypothesis
OR
If none of the marks is
awarded allow principle
mark of (prostate) cancer
more likely with 16 or less
than 16 (repeats) or
(prostate) cancer less
likely with 17 or more than
17 (repeats)
OR
Alternative principle mark
Correctly links
significant/not significant to
correct probability
value/percentage or to
rejecting/accepting the null
hypothesis.
1. Reject ‘the results are
significant’.
1. Accept ‘difference in
results is significant’.
2, 3 and 4. Accept
reference to any number of
repeats (e.g. 18) between
7MARK
With 17 or more (repeats) accept the null
hypothesis;
17 to 20 for 17 or more
than 17 (repeats).
3. Accept equivalent
responses in terms of 95%
or 0.95 probability
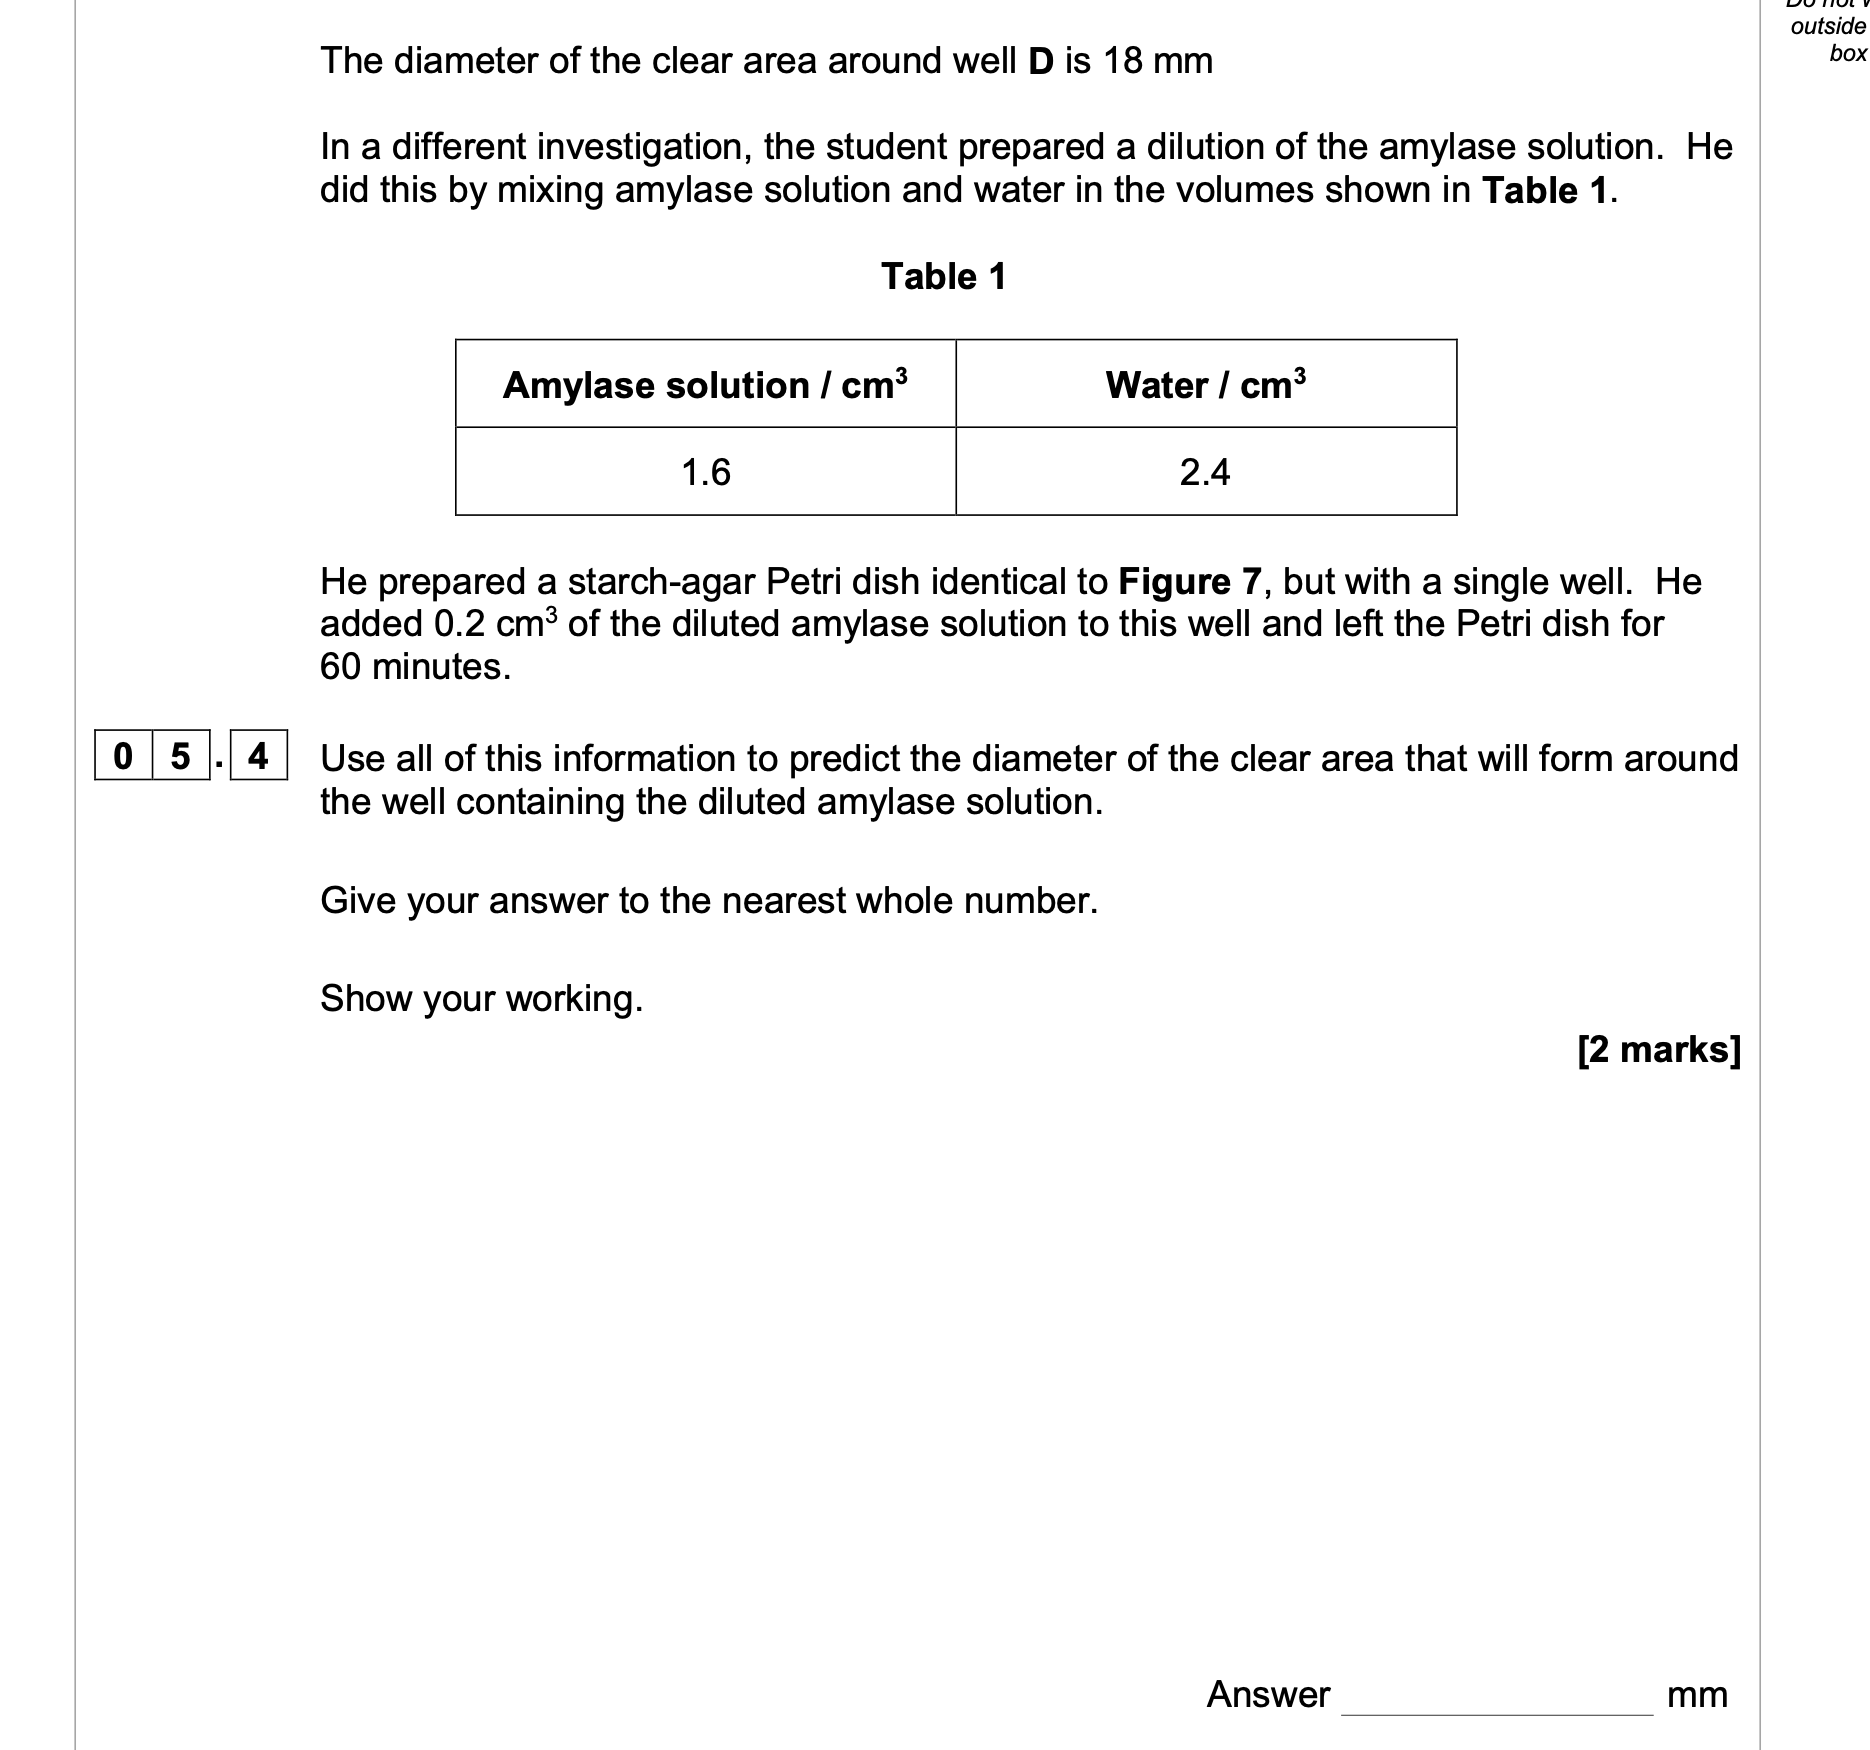
correct answer for 2 marks = 7
Accept for 1 mark,
7.2 (correct answer but not rounded)
OR
Evidence of 1.6 ÷ 4.0/0.4/40% (correct dilution
factor)
OR
Evidence of 0.08 (correct amylase volume in
0.2cm3)
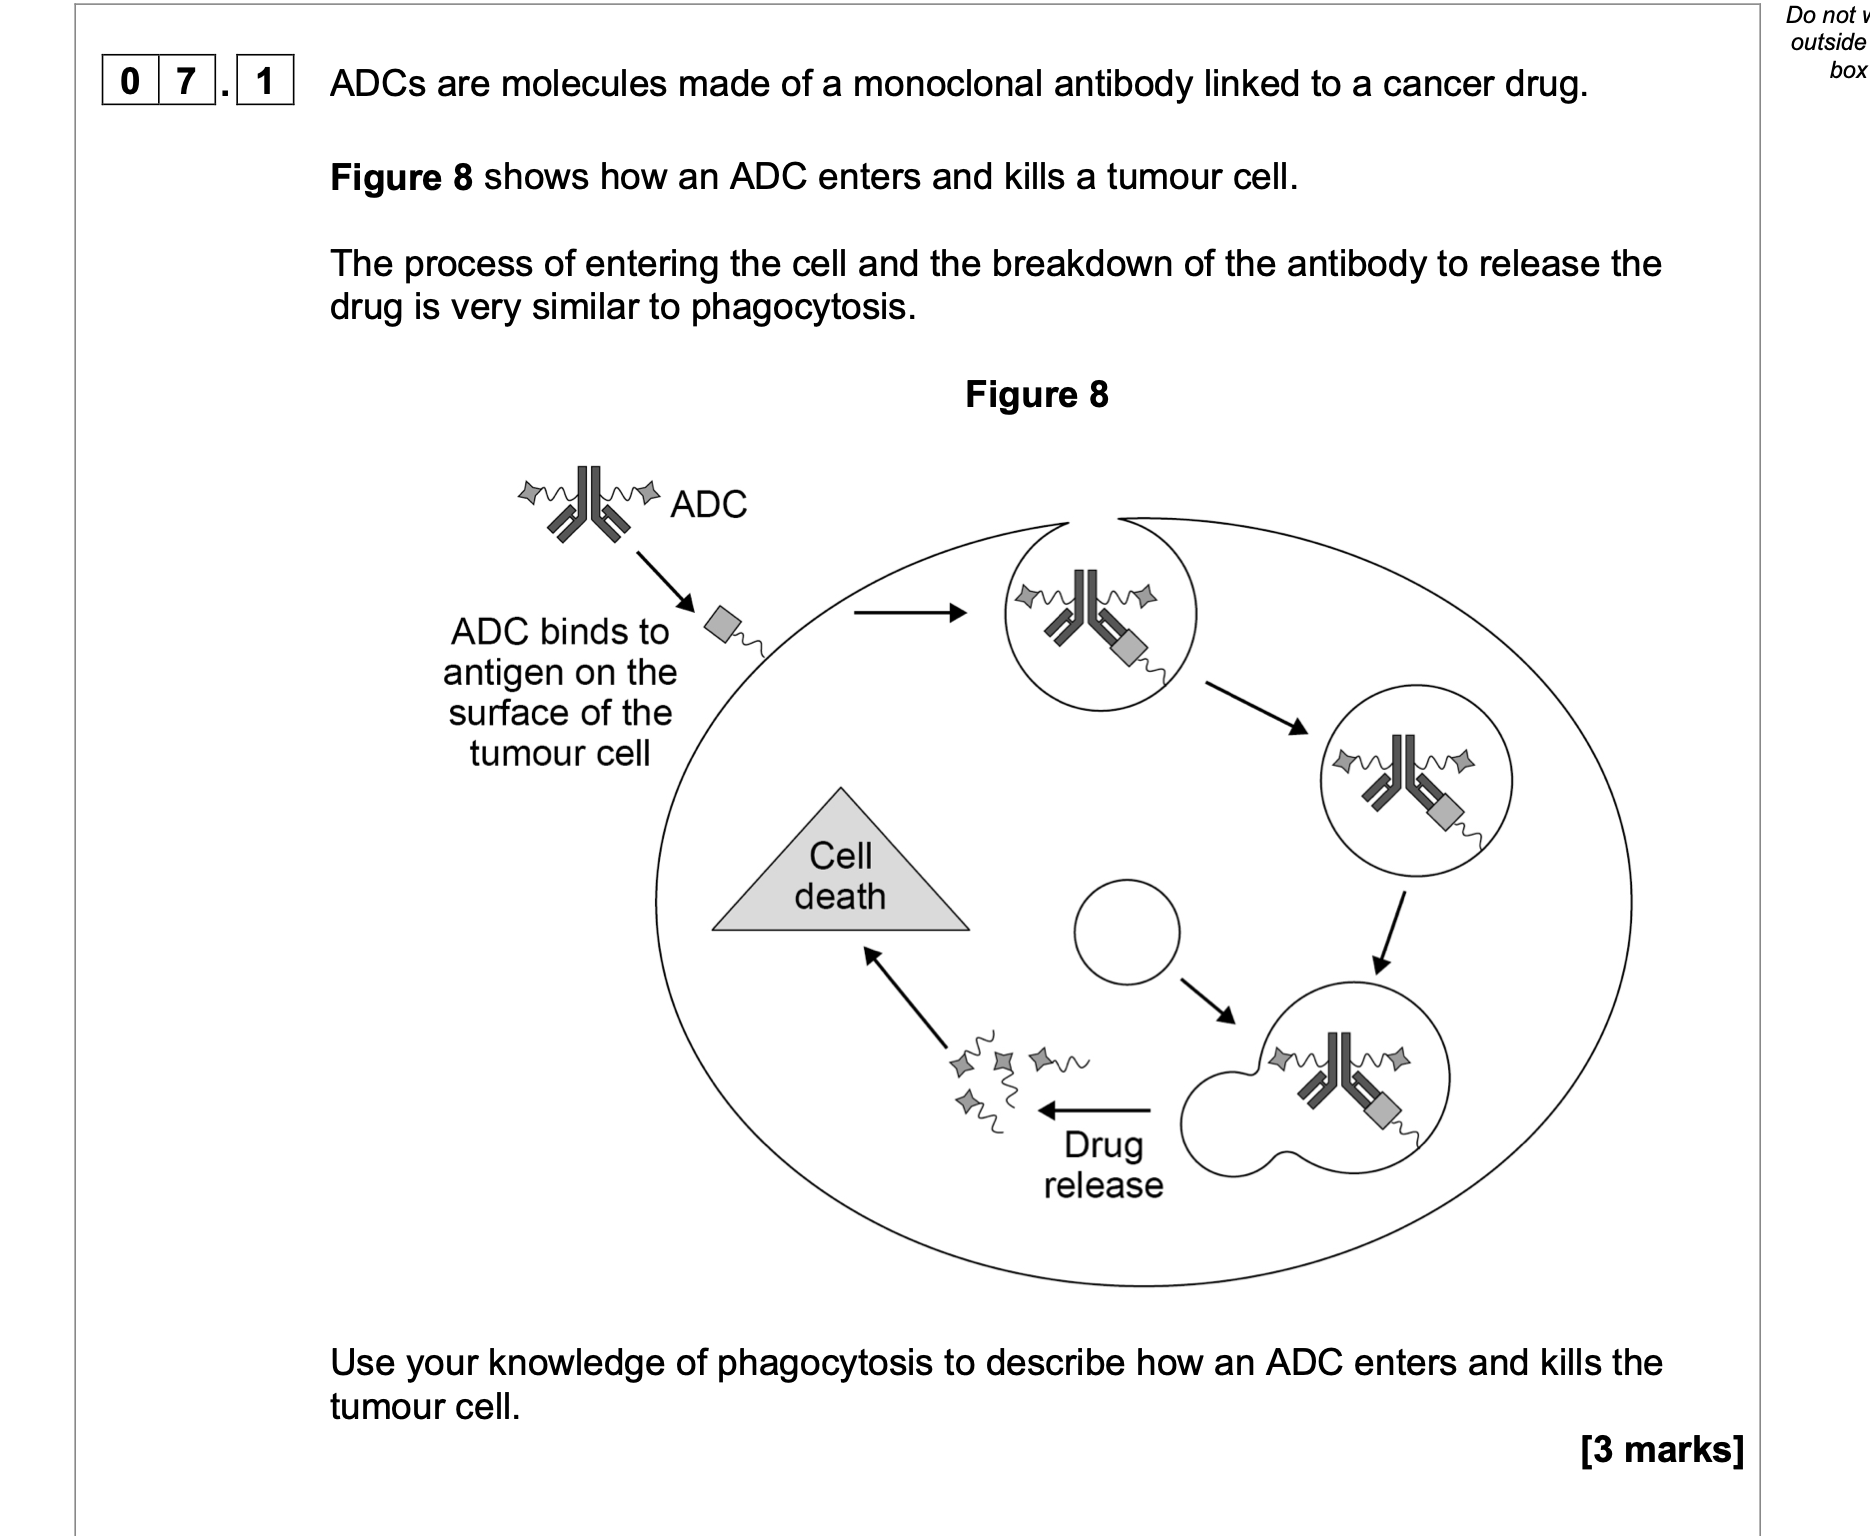
1. Cell ingests/engulfs the antibody/ADC
OR
Cell membrane surrounds the antibody/ADC (to take it inside the cell);
3
2. Lysosomes fuse with vesicle/phagosome
(containing ADC);
3. Lysozymes breakdown/digest the antibody/ADC
to release the drug;
![<p><strong>0 8 . 3 </strong>The pressure of the equilibrium mixture was increased by reducing the volume of the</p><p class="p1">container at constant temperature.</p><p class="p1">Predict the effect of increasing the pressure on the equilibrium yield of hydrogen.</p><p class="p1">Explain your answer.</p><p class="p1">Predict the effect of increasing the pressure on the value of <em>K</em><span>c</span></p><p class="p1"><strong>[4 marks]</strong></p><p class="p1">Effect on equilibrium yield of hydrogen:</p><p class="p1">Explanation:</p><p class="p1">Effect on value of <em>K</em><span>c:</span></p>](https://knowt-user-attachments.s3.amazonaws.com/4a9ae8a3-8ac7-49bc-857f-aeec7231ba47.png)
0 8 . 3 The pressure of the equilibrium mixture was increased by reducing the volume of the
container at constant temperature.
Predict the effect of increasing the pressure on the equilibrium yield of hydrogen.
Explain your answer.
Predict the effect of increasing the pressure on the value of Kc
[4 marks]
Effect on equilibrium yield of hydrogen:
Explanation:
Effect on value of Kc:
M1 yield would decrease
M2 M3 equilibrium (position) moves left / shifts left / in direction of
reverse reaction
to oppose increase in pressure / to reduce pressure
fewer moles/molecules of gas on left hand side / fewer
moles/molecules of gaseous reactants
M4 no effect on Kc
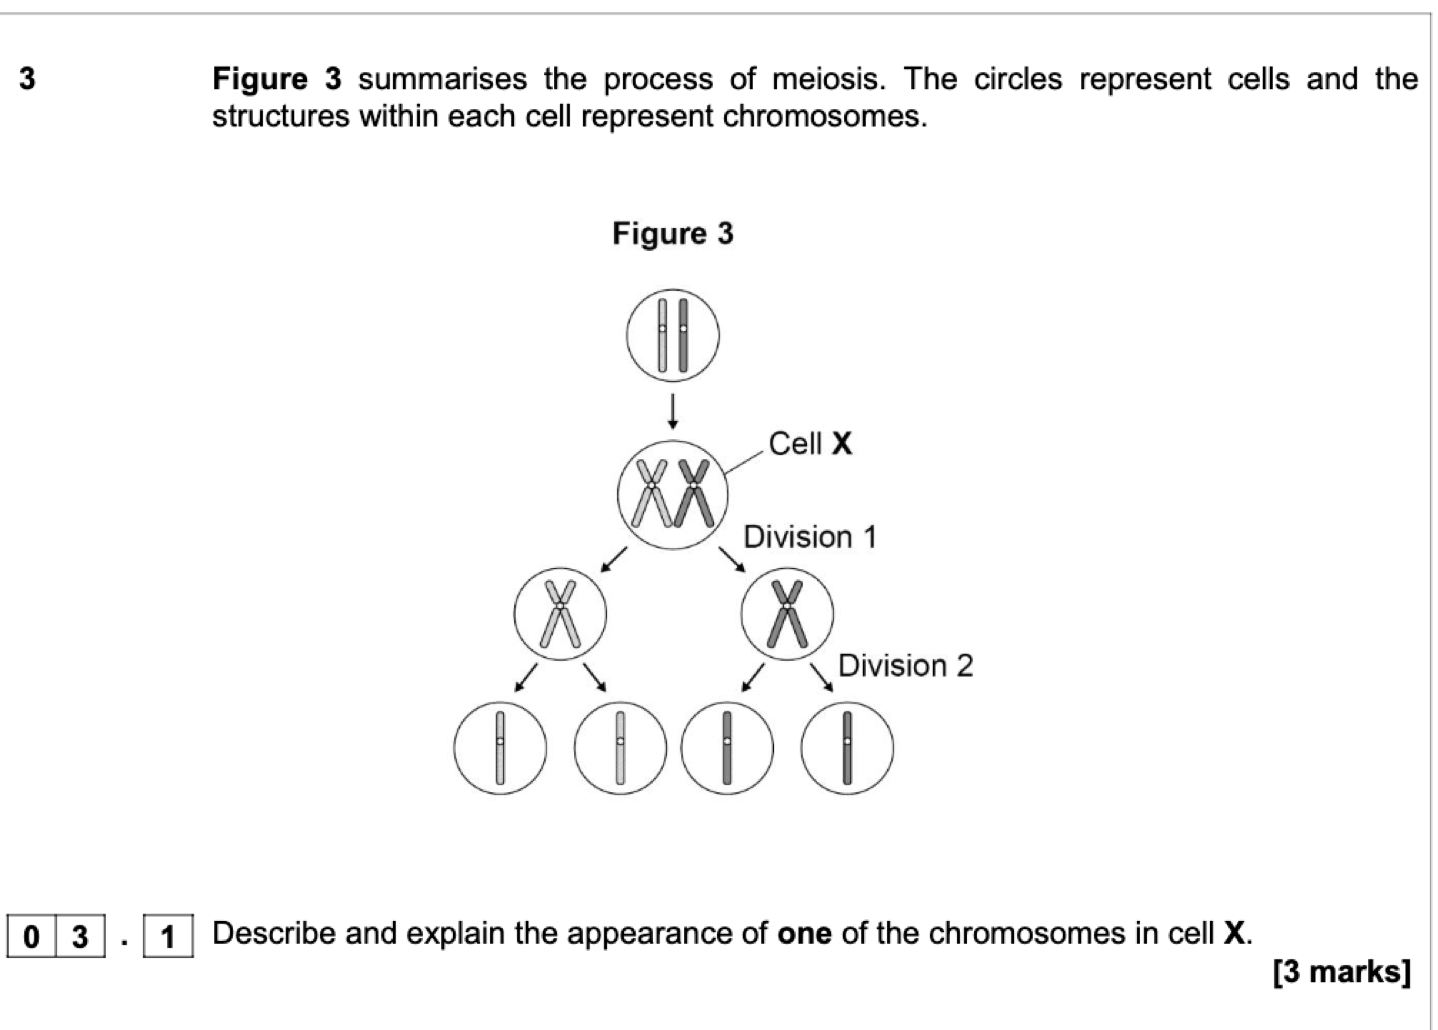
1. Chromosome is formed of two chromatids;
2. 3. (Because) DNA replication (has occurred);
(Sister) chromatids held together by
centromere
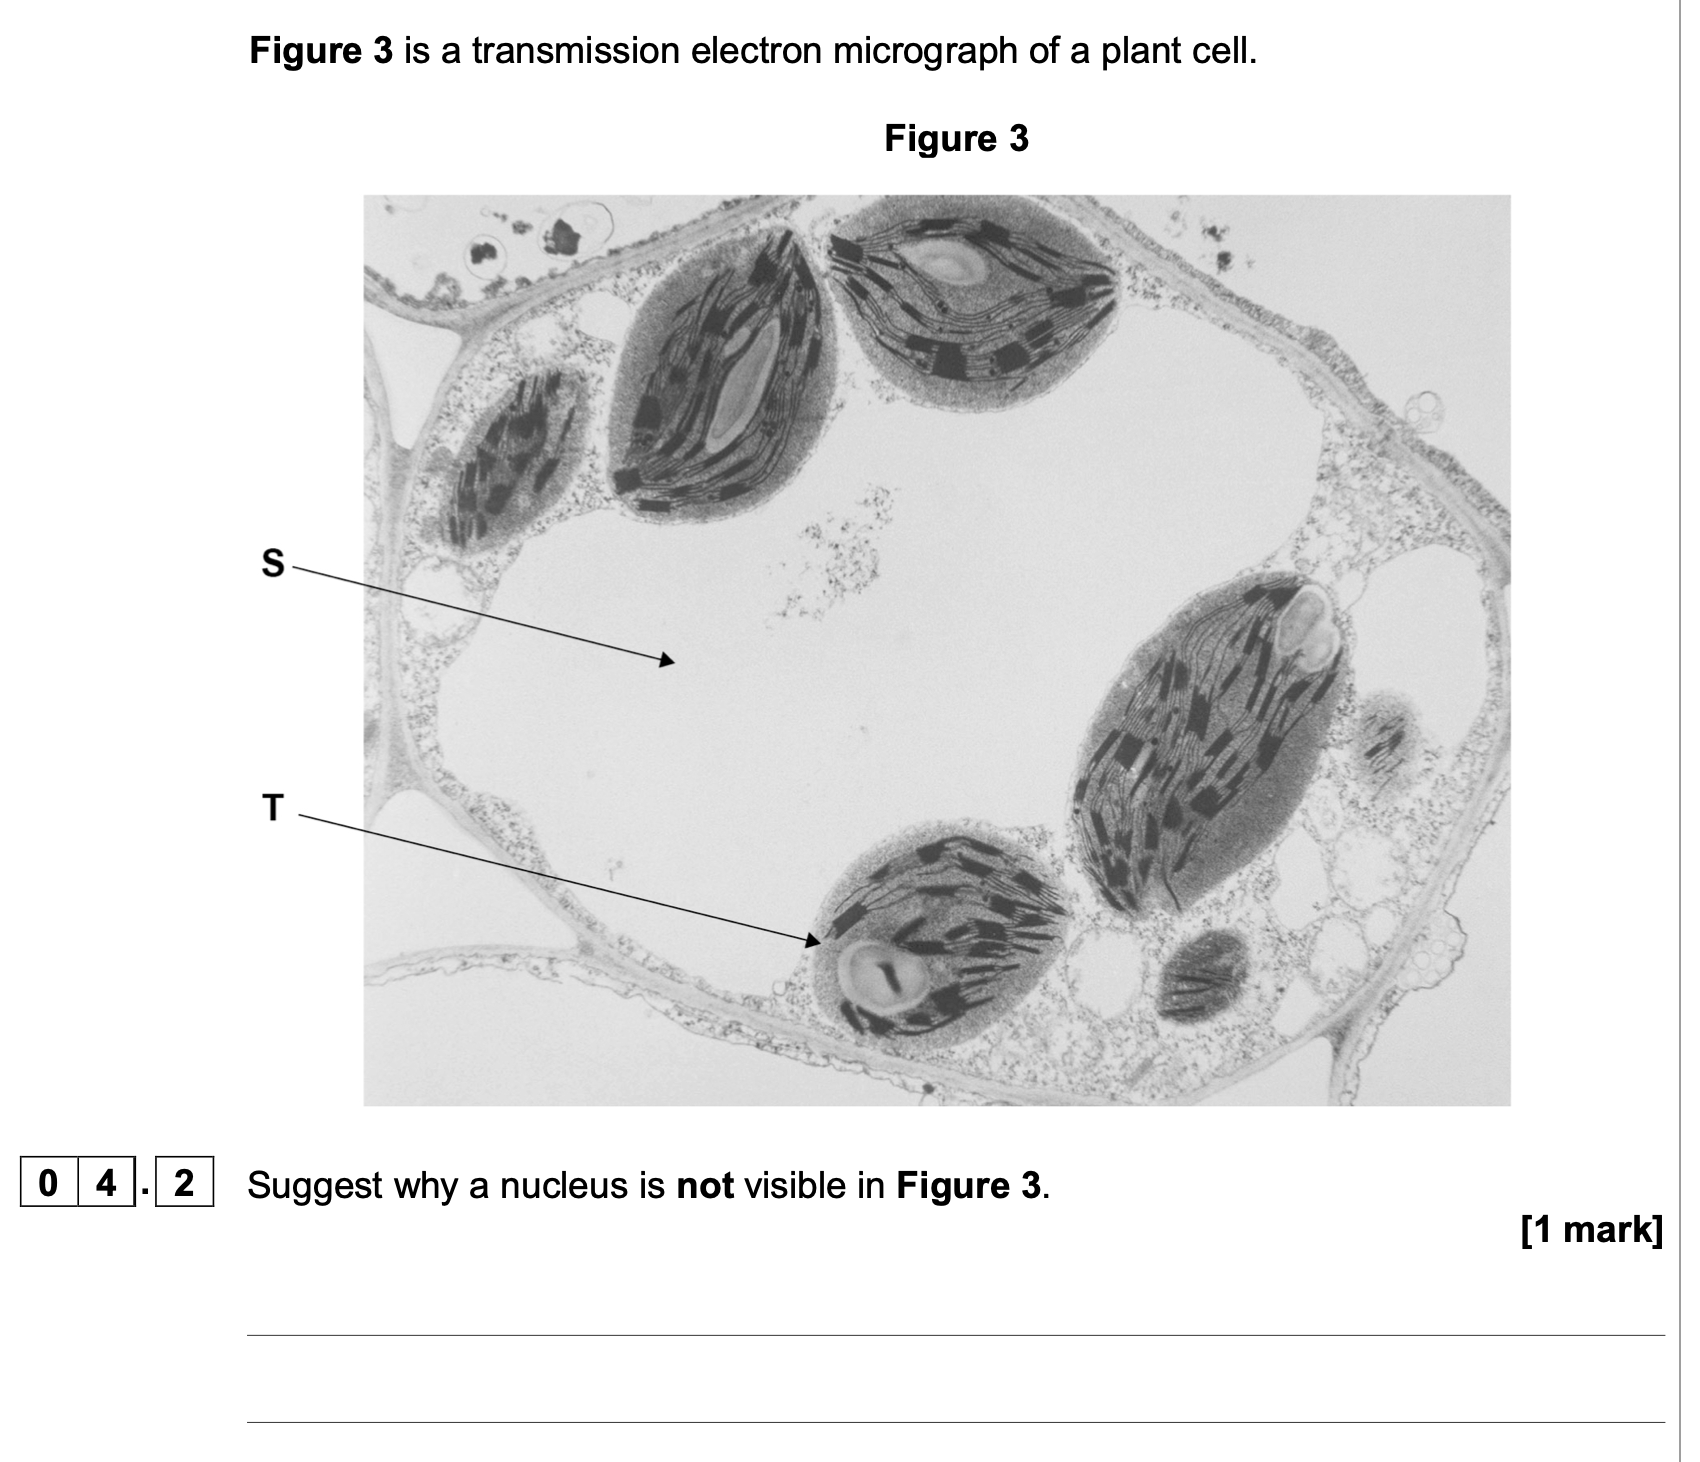
A section/slice (so nucleus in another part of cell)
1
OR
(Nucleus) not stained;
![<p>As shown in <strong>Figure 1</strong>, ATP synthase has two functions.</p><p class="p1"><span>•</span> It catalyses the synthesis of ATP.</p><p class="p1"><span>•</span> It allows the movement of H<span>+</span> ions.</p><p class="p1">Suggest how the shape of the ATP synthase allows it to have these two functions.</p><p class="p1">Explain your answers.</p><p class="p1"><strong>[4 marks]</strong></p><p class="p1">Catalyses the synthesis of ATP:</p><p class="p1">Allows the movement of H<span>+</span> ions:</p>](https://knowt-user-attachments.s3.amazonaws.com/1f76e852-b31e-414f-94a7-1acbfa892bb3.png)
As shown in Figure 1, ATP synthase has two functions.
• It catalyses the synthesis of ATP.
• It allows the movement of H+ ions.
Suggest how the shape of the ATP synthase allows it to have these two functions.
Explain your answers.
[4 marks]
Catalyses the synthesis of ATP:
Allows the movement of H+ ions:
(Catalyses the synthesis of ATP)
1. Active site complementary to ADP + Pi;
2. Enzyme-substrate complex forms;
2. ‘E-S’ alone is
insufficient
(Allows the movement of H+ ions)
3. Channel (in membrane/protein/enzyme);
4. Allows facilitated diffusion of H+
OR
(Channel) has tertiary structure specific for (only)
H+
;
![<p>Name the type of blood vessel that controls blood flow to muscles <strong>and</strong> explain how</p><p class="p1">these blood vessels change blood flow during exercise.</p><p class="p1"><strong>[3 marks]</strong></p><p class="p1">Name of blood vessel:</p><p class="p1">Explanation:</p>](https://knowt-user-attachments.s3.amazonaws.com/03479249-0c3d-46d6-8111-506652a6b46d.png)
Name the type of blood vessel that controls blood flow to muscles and explain how
these blood vessels change blood flow during exercise.
[3 marks]
Name of blood vessel:
Explanation:
1. Arteriole;
2. (Circular/smooth) muscle relaxes;
3. Vasodilation increases blood flow
OR
Widens/dilates (lumen of) blood vessel so
increases blood flow;
![<p>Before meiosis, a cell of a rice plant has 12 pairs of homologous chromosomes</p><p class="p1">(24 chromosomes in total).</p><p class="p1">Give the letter of the diagram from <strong>Figure 3</strong> that correctly shows the chromosome</p><p class="p1">content of rice cells after the first meiotic division and after the second meiotic</p><p class="p1">division.</p><p class="p1"><strong>[2 marks]</strong></p><p class="p1">After first meiotic division:</p><p class="p1">After second meiotic division:</p>](https://knowt-user-attachments.s3.amazonaws.com/08ce7e93-c86d-4ee6-b2b6-c96a3dee865e.png)
Before meiosis, a cell of a rice plant has 12 pairs of homologous chromosomes
(24 chromosomes in total).
Give the letter of the diagram from Figure 3 that correctly shows the chromosome
content of rice cells after the first meiotic division and after the second meiotic
division.
[2 marks]
After first meiotic division:
After second meiotic division:
After first meiotic division – B;
After second meiotic division – E;
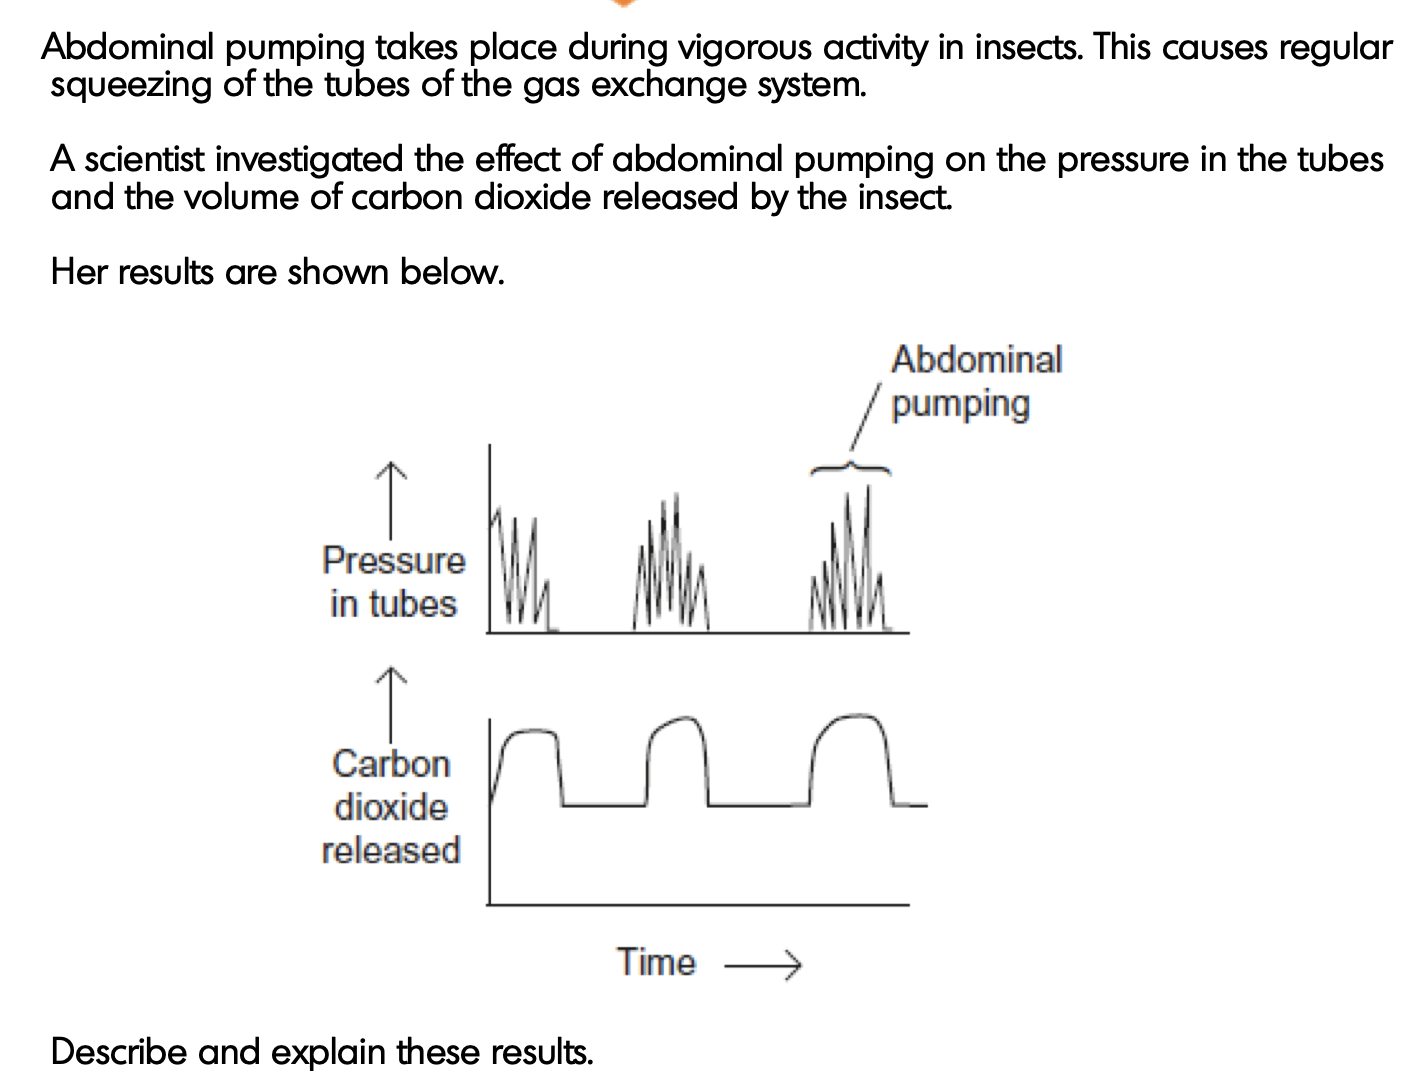
1. Abdominal pumping/pressure in tubes linked to carbon
dioxide release;
MP1 relates to description of link shown in graphs
2. (Abdominal) pumping raises pressure in body;
Needs idea of causation, not just description of correlation
Air/carbon dioxide pushed out of body /air/carbon dioxide moves down pressure gradient (to atmosphere);
Reject ref to concentration gradients/diffusion
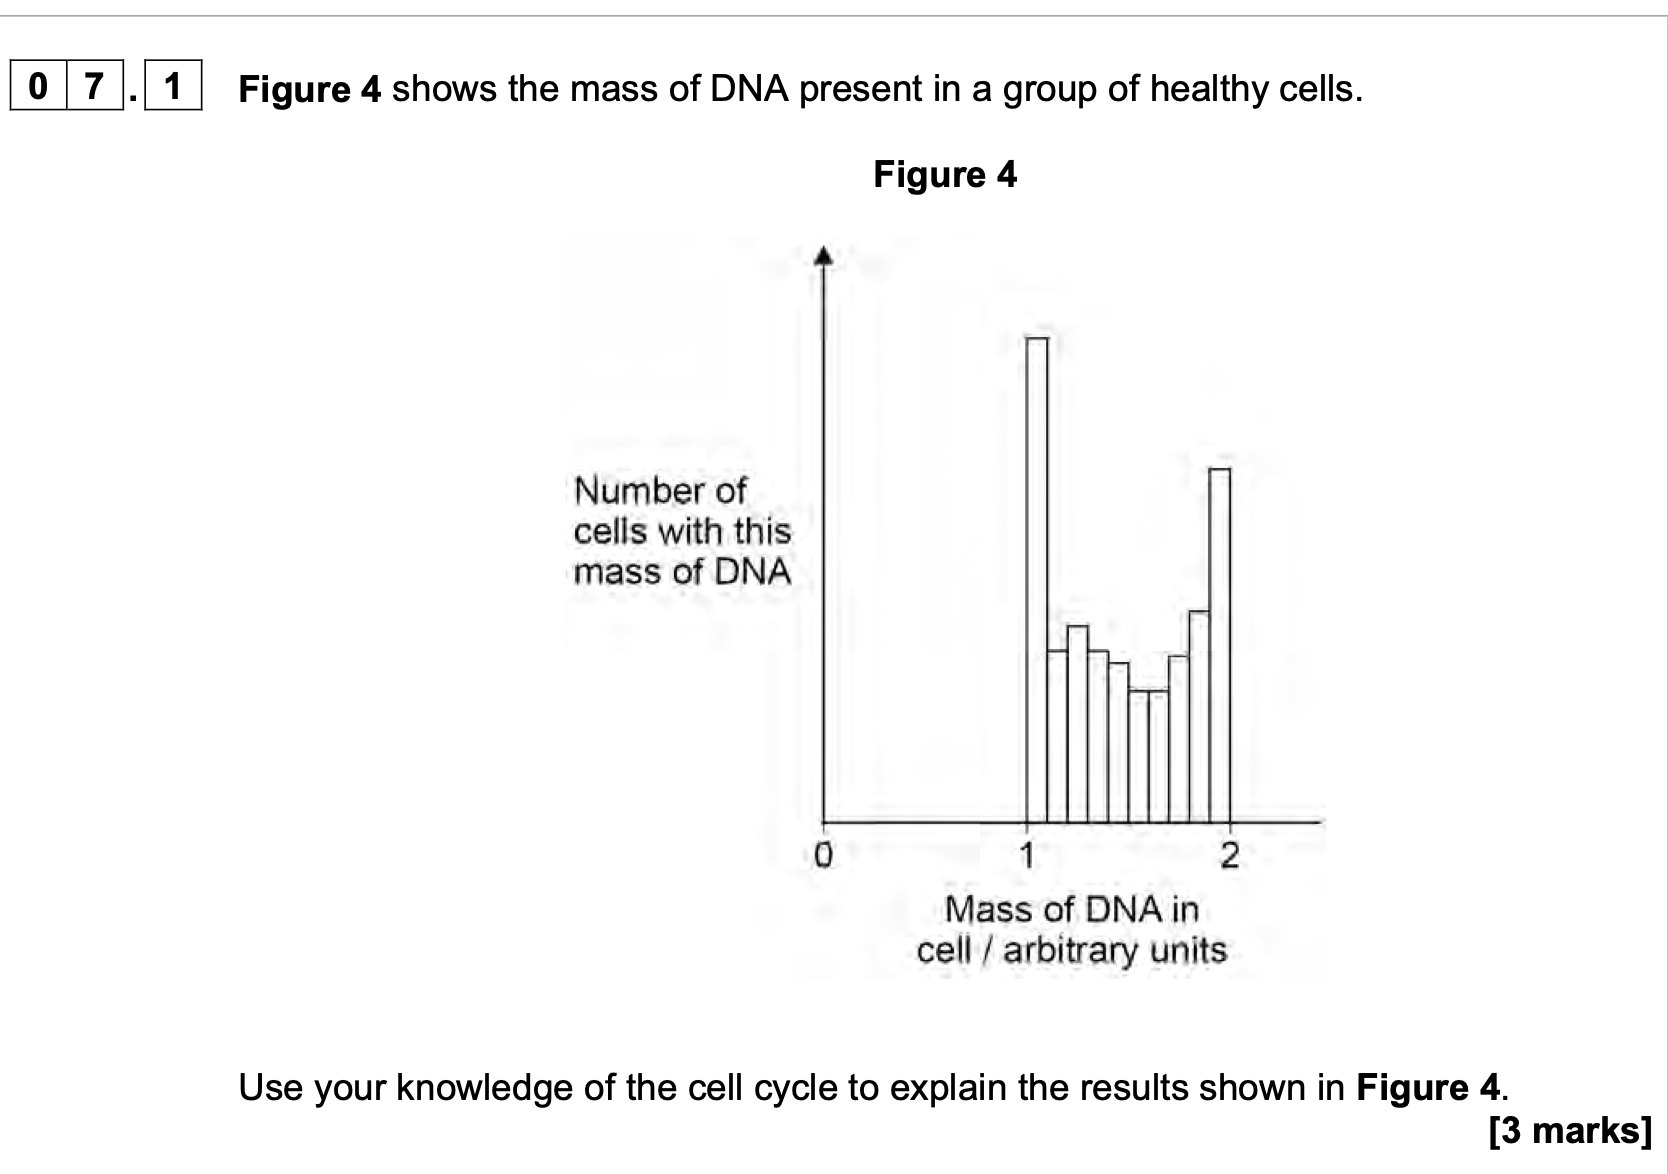
1. Mass of DNA equals 1 (indicates) (early)
interphase
OR
No cells with mass of DNA less than 1 (indicates)
mitosis only type of division occurring;
2. Mass of DNA equals 2 (indicates) mitosis
OR
Mass of DNA equals 2 (indicates) each
chromosome consists of 2 chromatids;
3. Mass of DNA between 1 and 2 (indicates) some
of the DNA has been replicated;
1. Accept G1 phase
Accept no meiosis
2. Accept G2 / any
named phase of
mitosis
3. Accept S phase
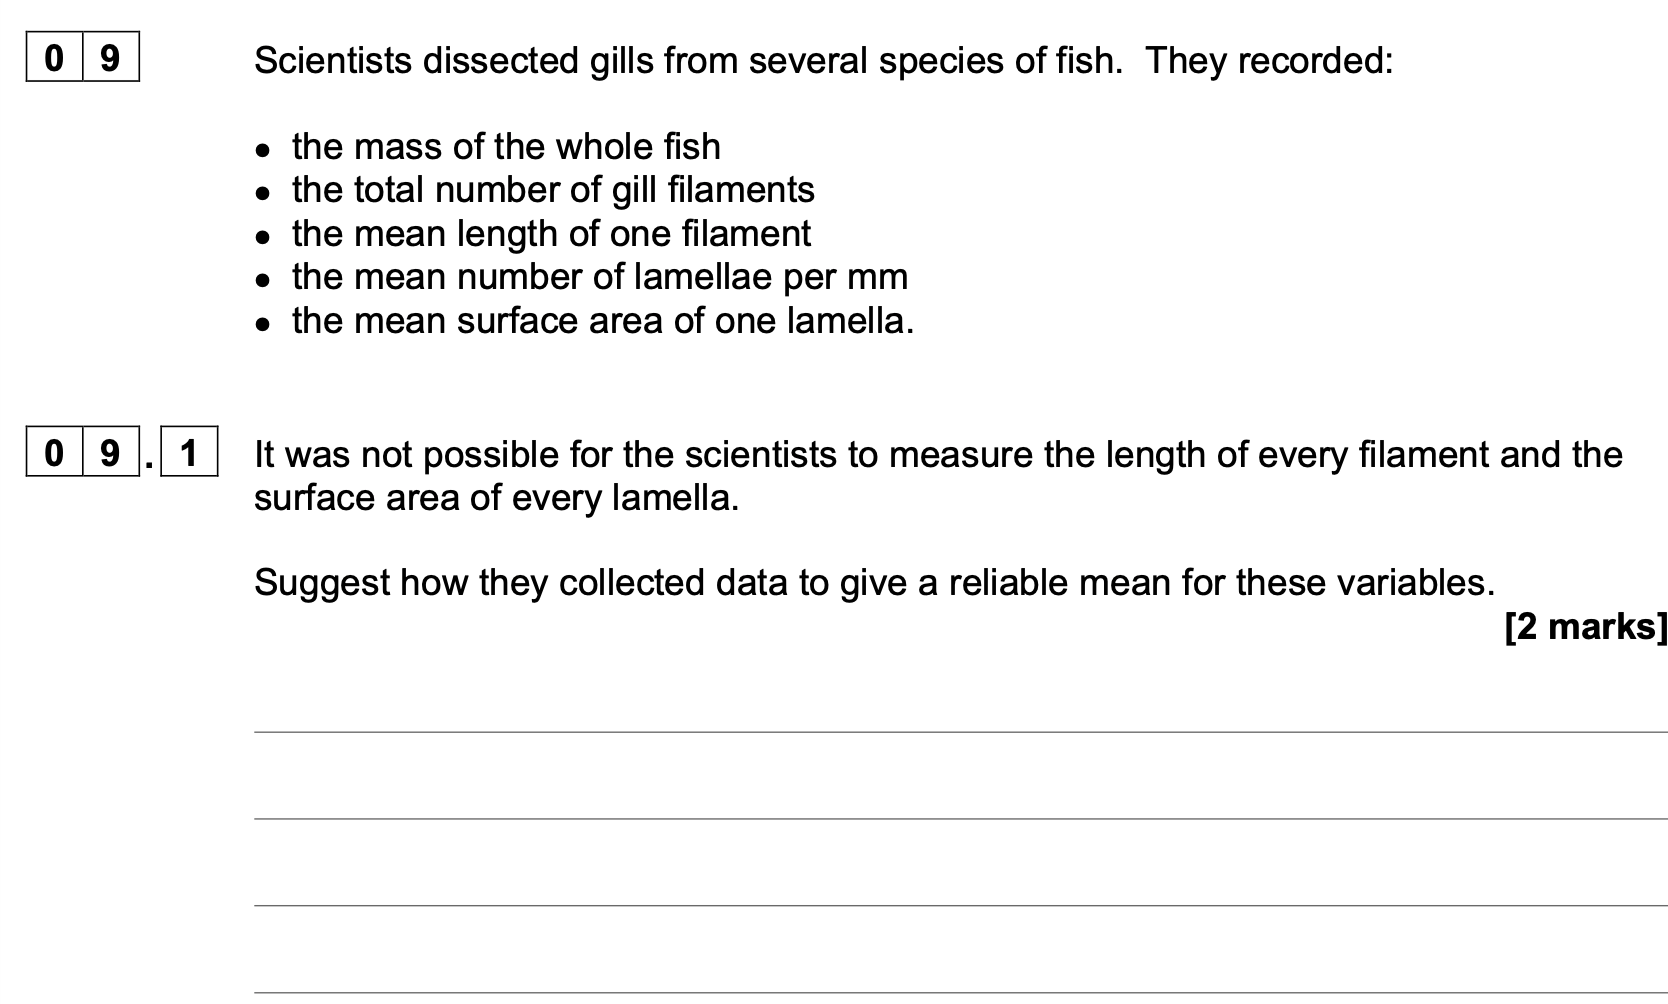
1. Random samples;
2. Large sample size;
1. Allow in context
of fish or gills
2. If a specified
number is given,
it must be 10 or
more.
2. Accept ‘many’/
‘multiple’ for large
sample but ignore
‘several
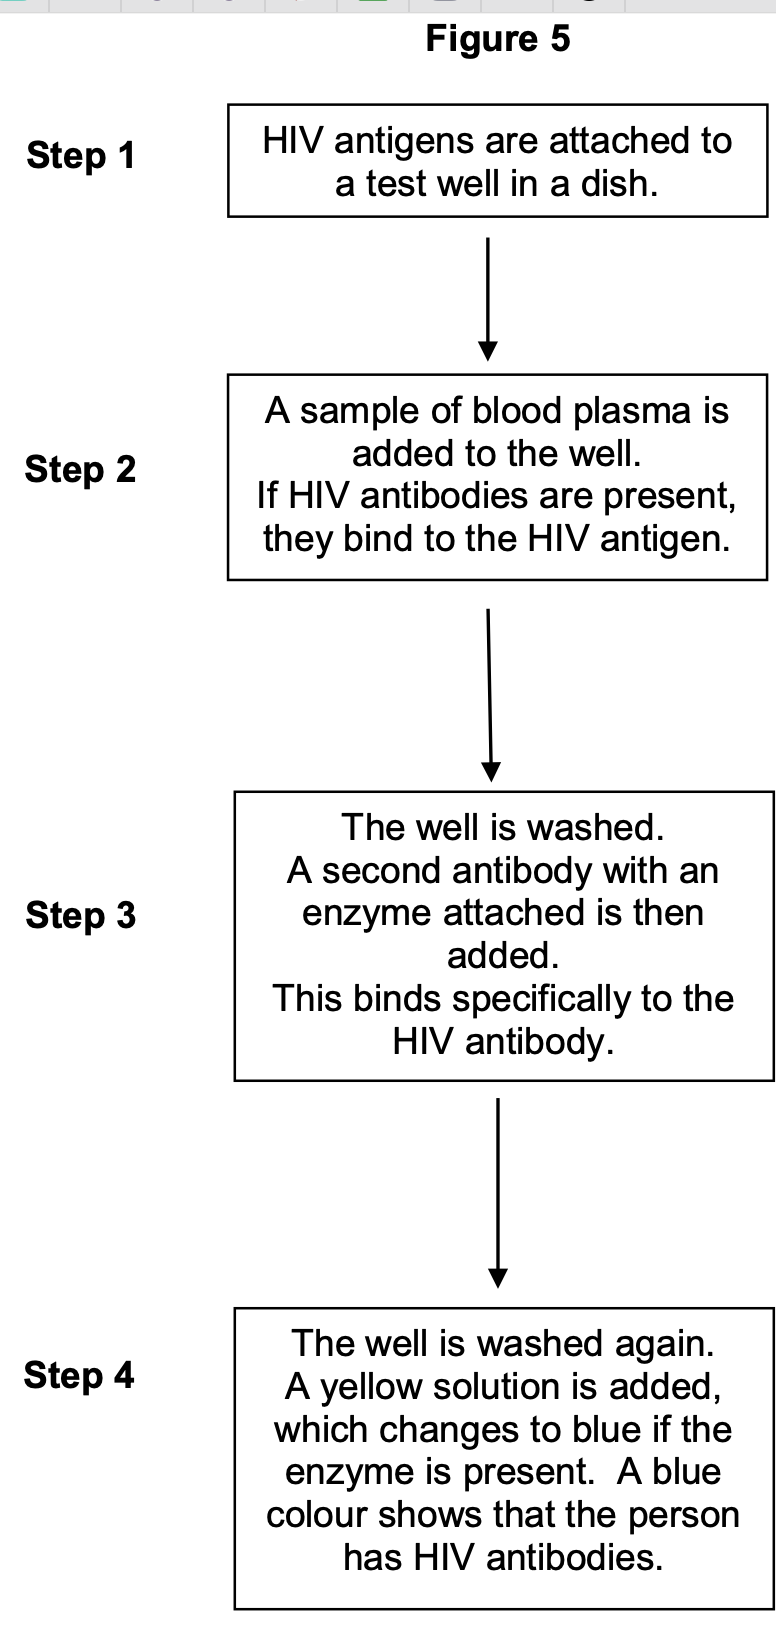
Figure 5 shows a test that has been developed to find out if a person has antibodies
to the human immunodeficiency virus (HIV) antigen.
This test only detects the presence of HIV antibodies. Give two reasons why it cannot
be used to find out if a person has AIDS.
(To diagnose AIDS, need to look for/at)
1. (AIDS-related) symptoms;
2. Number of helper T cells;

Figure 5 shows a test that has been developed to find out if a person has antibodies
to the human immunodeficiency virus (HIV) antigen
The solution will remain yellow if a person is not infected with HIV. Explain why.
1. HIV antibody is not present;
2. (So) second antibody/enzyme will not bind/is
not present;
2 1. Accept HIV
antibodies will not
bind (to antigen)
Explain how the monoclonal antibody would prevent the regulator protein from
working (lines 7−8).
(c) Any two from:
1. (Monoclonal antibody) has a specific tertiary structure / variable region /
is complementary to regulator protein
Do not award MP1 if reference to active site.
2. 3. Binds to / forms complex with (regulator protein)
“It” refers to monoclonal antibody in MP1 and MP2
(So regulator protein) would not fit / bind to the receptor / is not
complementary to receptor
3. Reject receptor on LDL
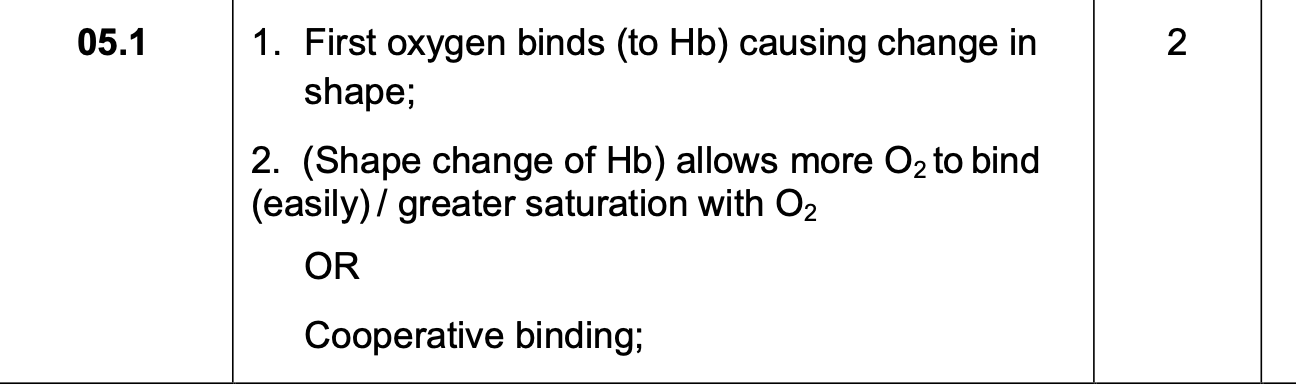
1. Aortic/semi-lunar valves is closed;
2. Because pressure in aorta higher than in
ventricle;

At Q on Figure 3 there is a small increase in pressure and in rate of blood flow in the
aorta.
Explain how this happens and its importance.
1. Elastic recoil (of the aorta wall/tissue);
2. Smooths the blood flow
OR
Maintains rate of blood flow
OR
Maintains blood pressure;
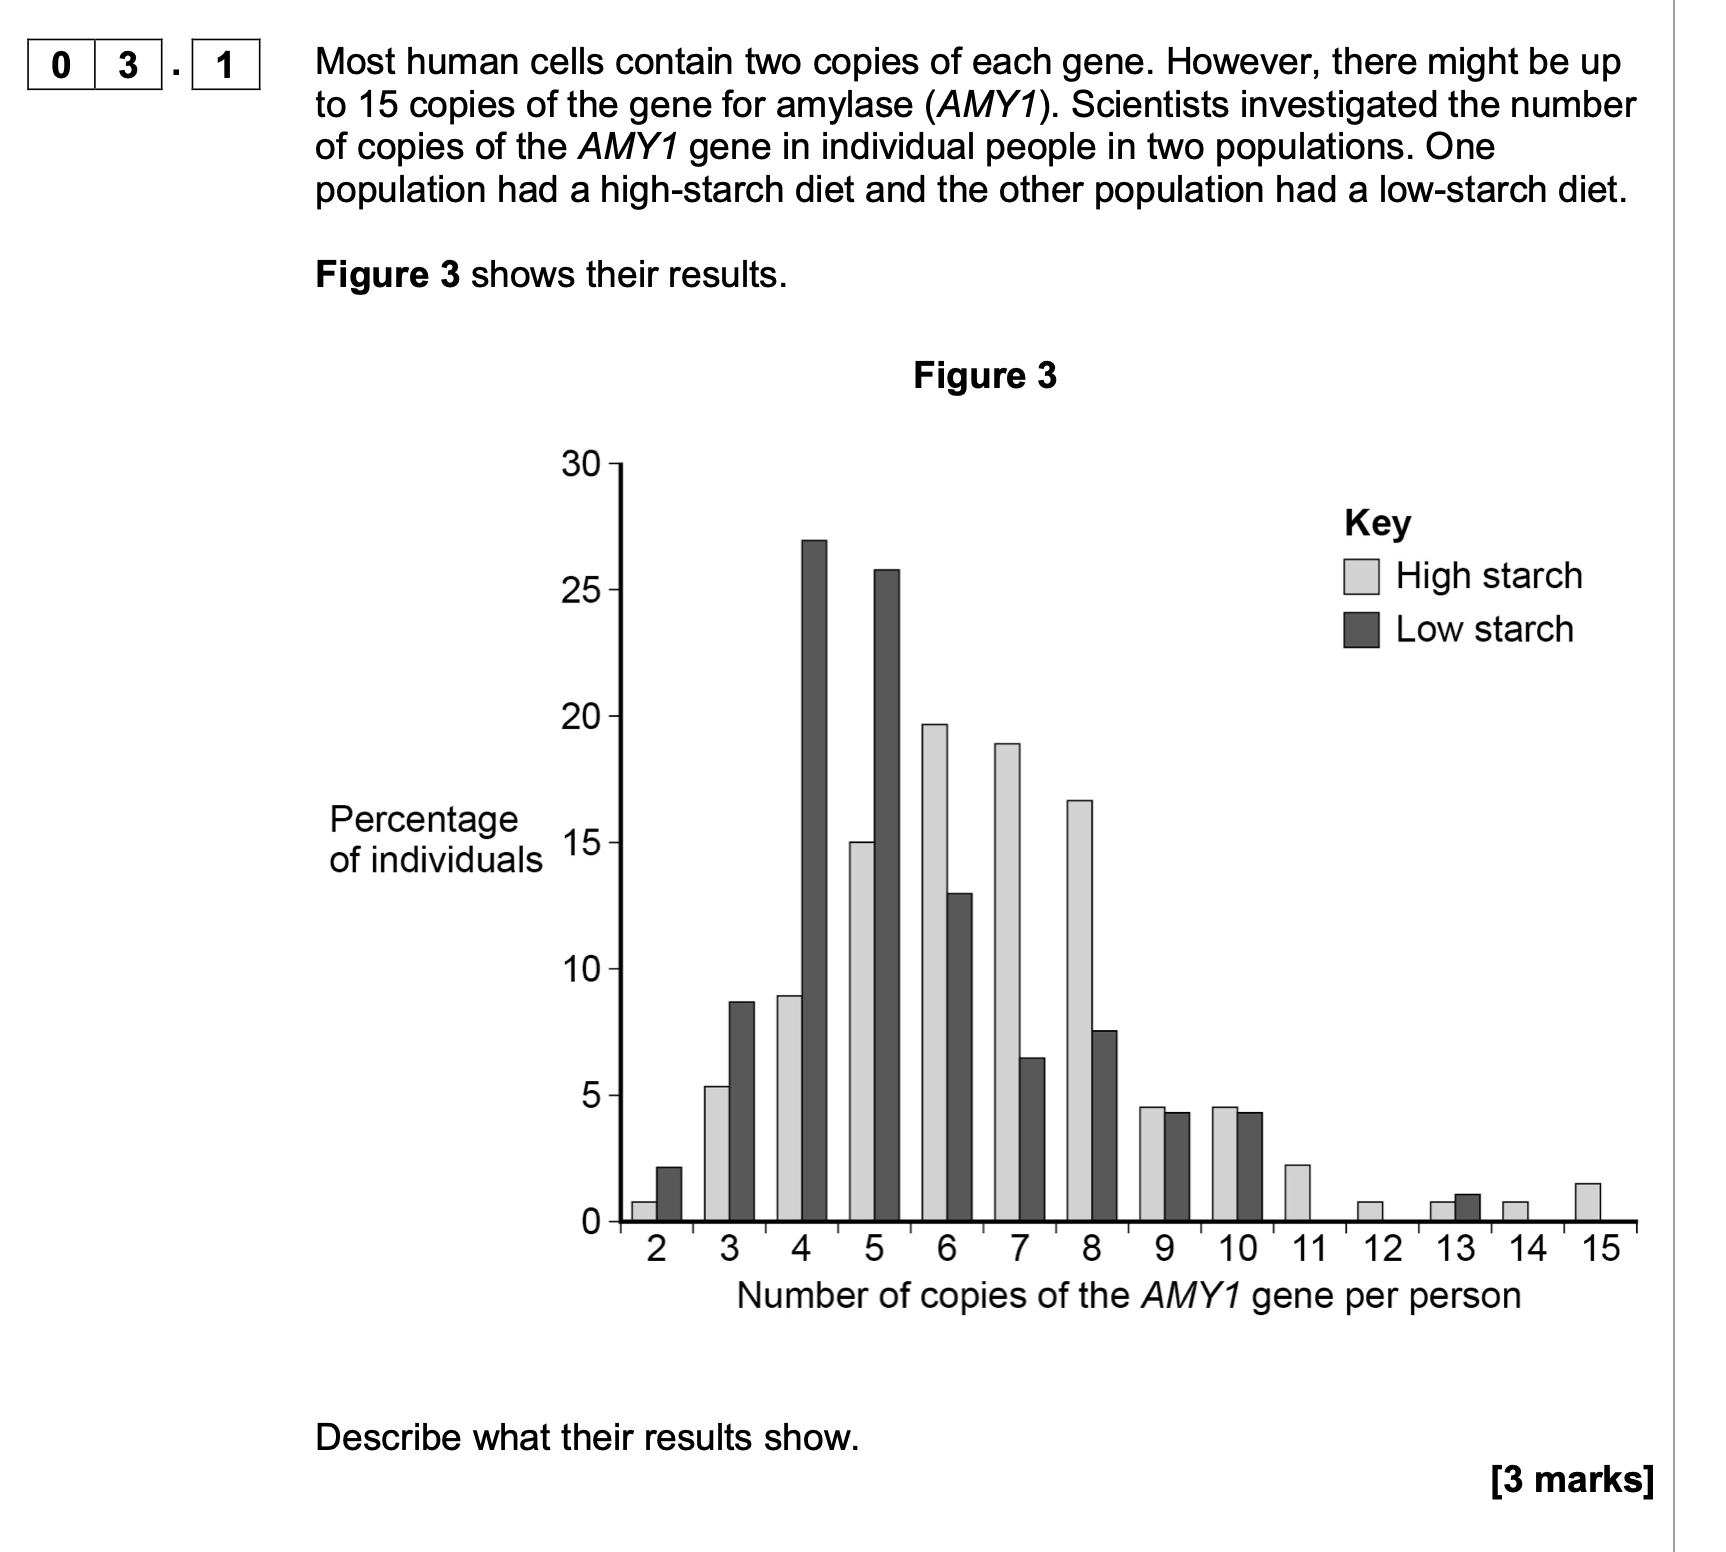
Multiple copies of the AMY1 gene is an adaptation to a high-starch diet.
Use your knowledge of protein synthesis and enzyme action to explain the
advantage of this adaptation.
1. More mRNA / more transcription;
2. More translation / enzyme;
3. So reaction faster;

Multiple copies of the AMY1 gene is an adaptation to a high-starch diet.
Suggest how this evolved through natural selection.
1. Mutation(s) produce extra copies of
(AMY1) gene;
2. Those with more copies / this
adaptation/mutation reproduce / survive
better on high starch diet;
3. And pass on multiple copies / this
adaptation/mutation (to offspring);
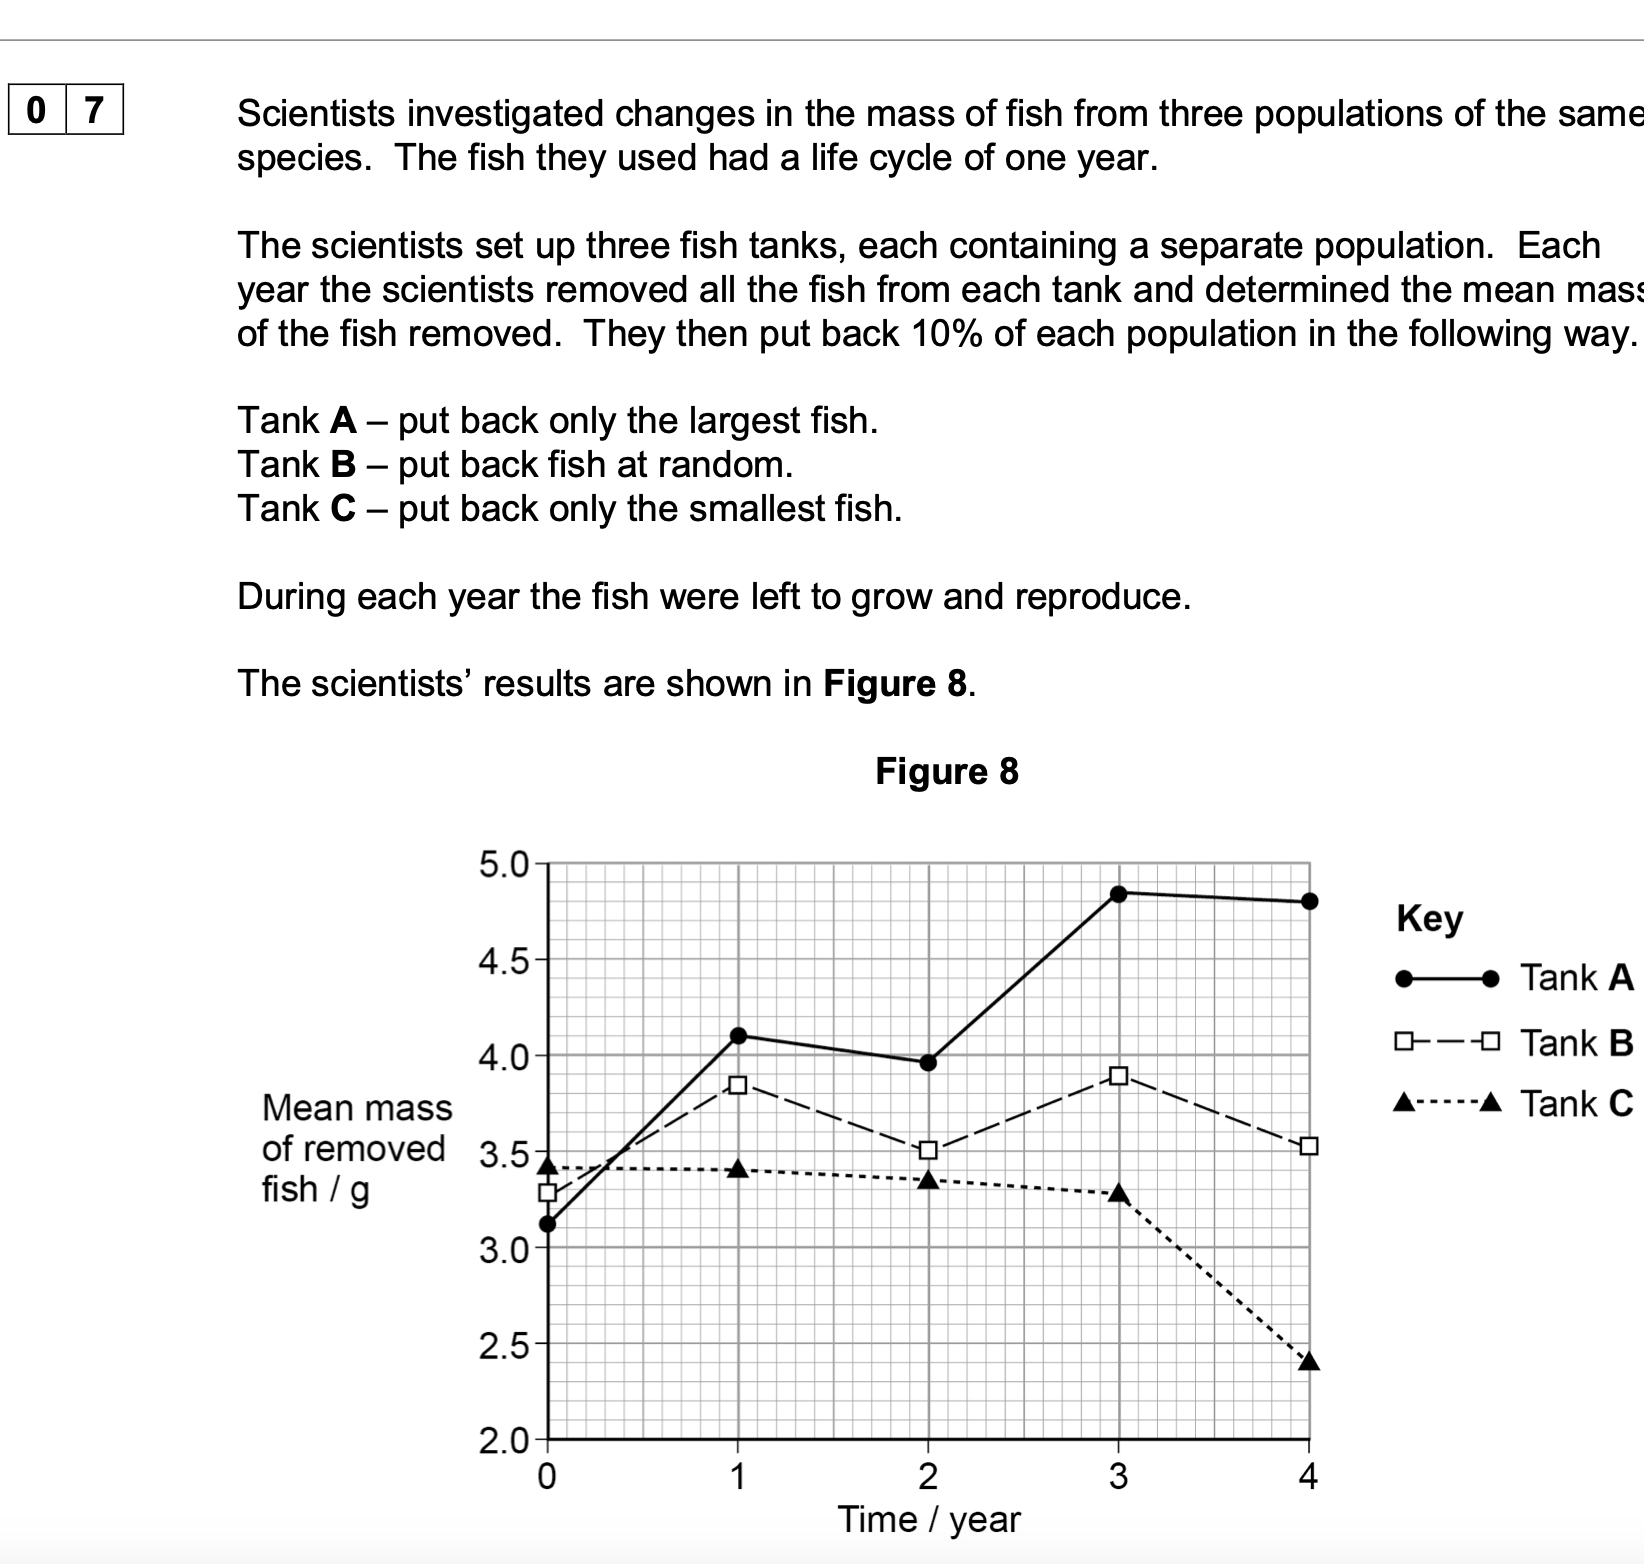
Explain the purpose of Tank B (on page 21).
1. As a baseline/control;
2. To show effect of no selection
OR
To show what happens in a normal
population/naturally
OR
To show effect of/ compare with tank A/tank
C;
2. Ignore reference
to type of selection
2. Accept not
removing/not
catching/not fishing
for ‘selection’
2. Accept genetic
drift for ‘no
selection’
2. Accept no
fishing/no
selection/no caught
fish for ‘normal
population’
2. Accept to
compare with other
results
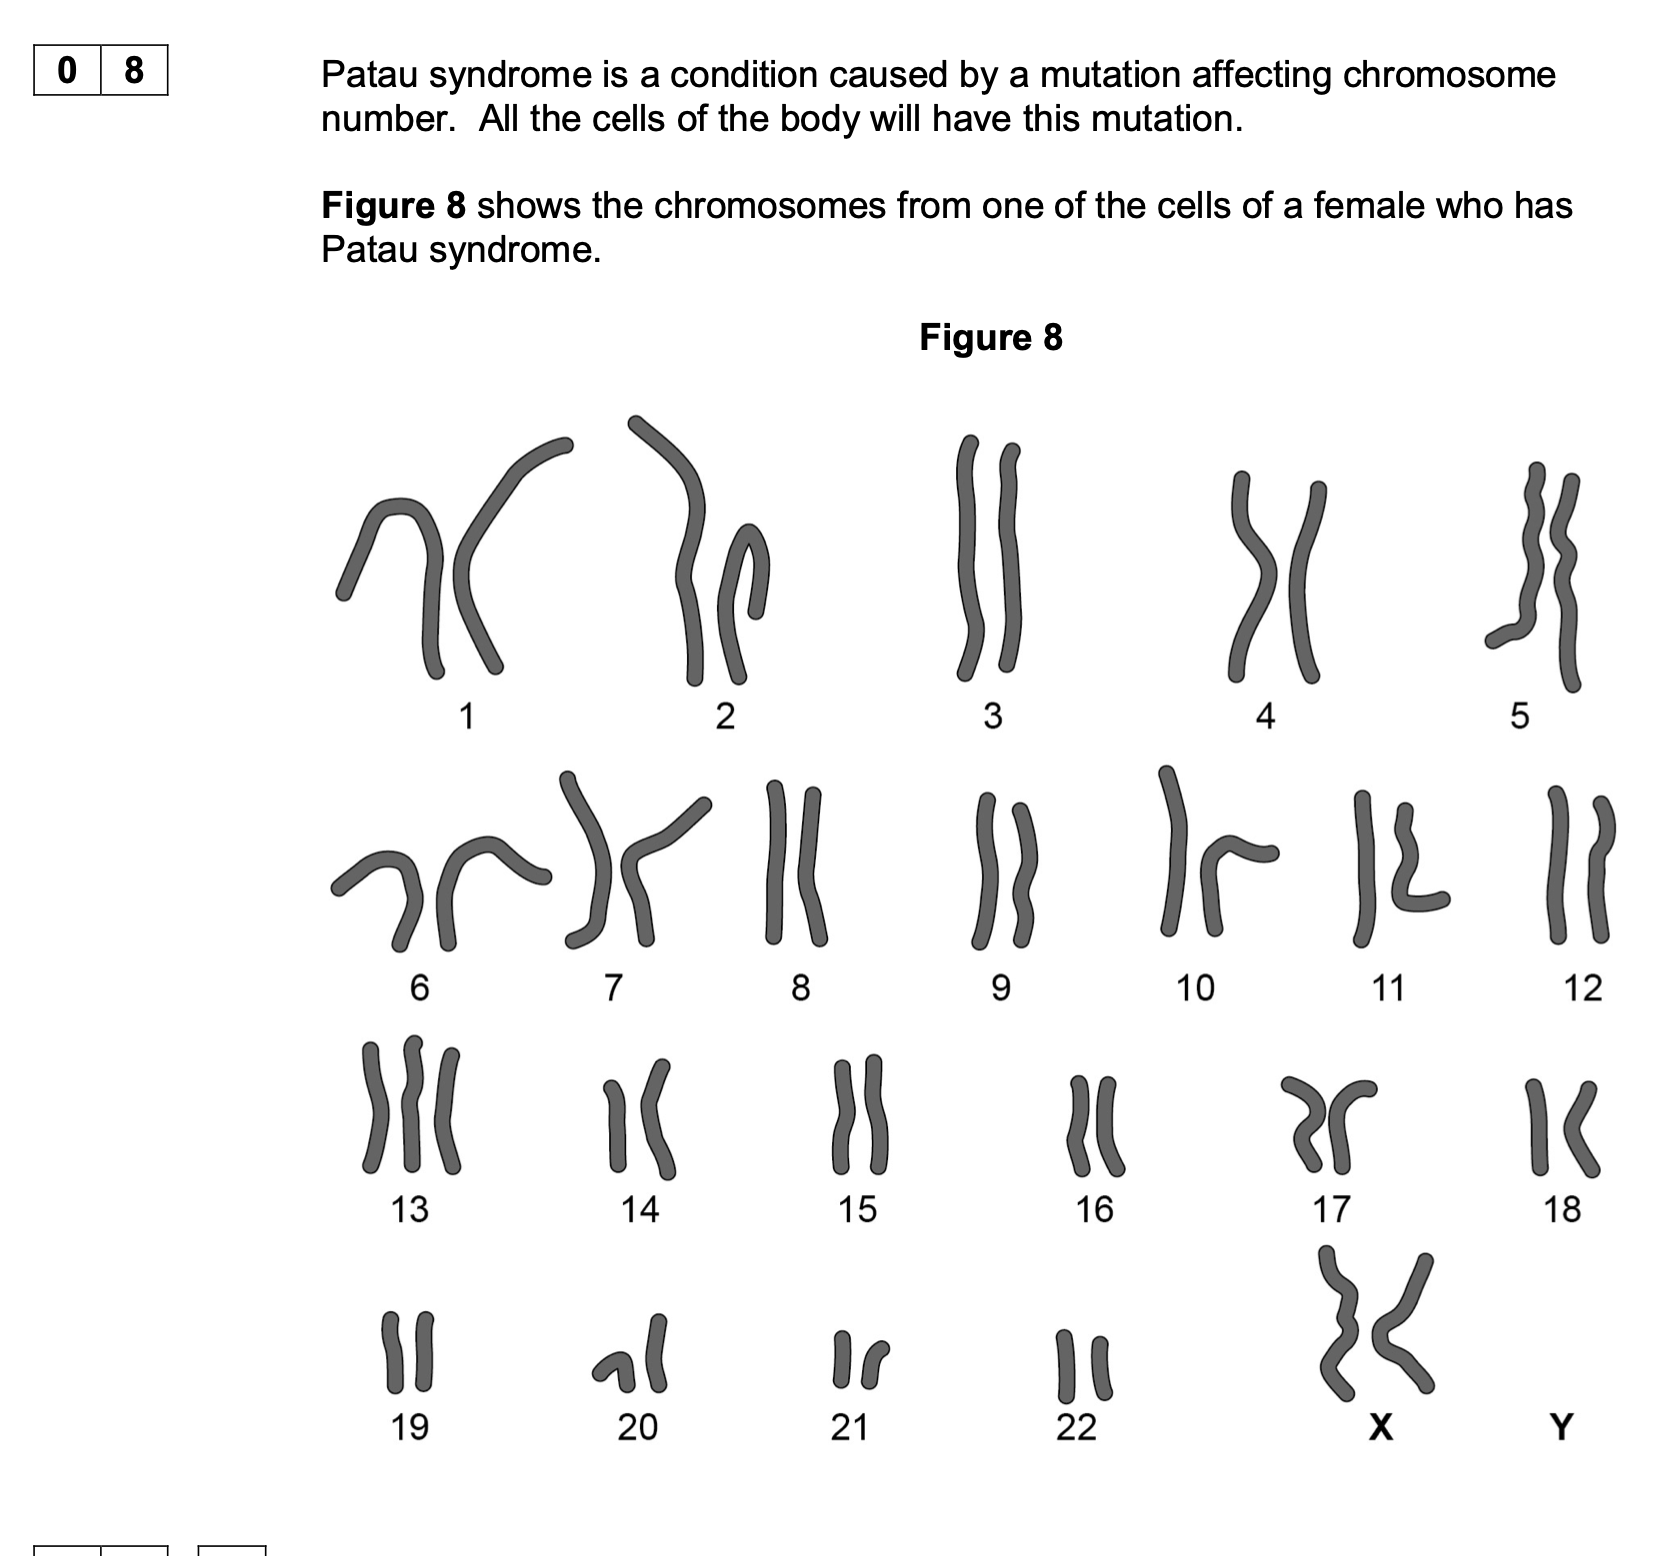
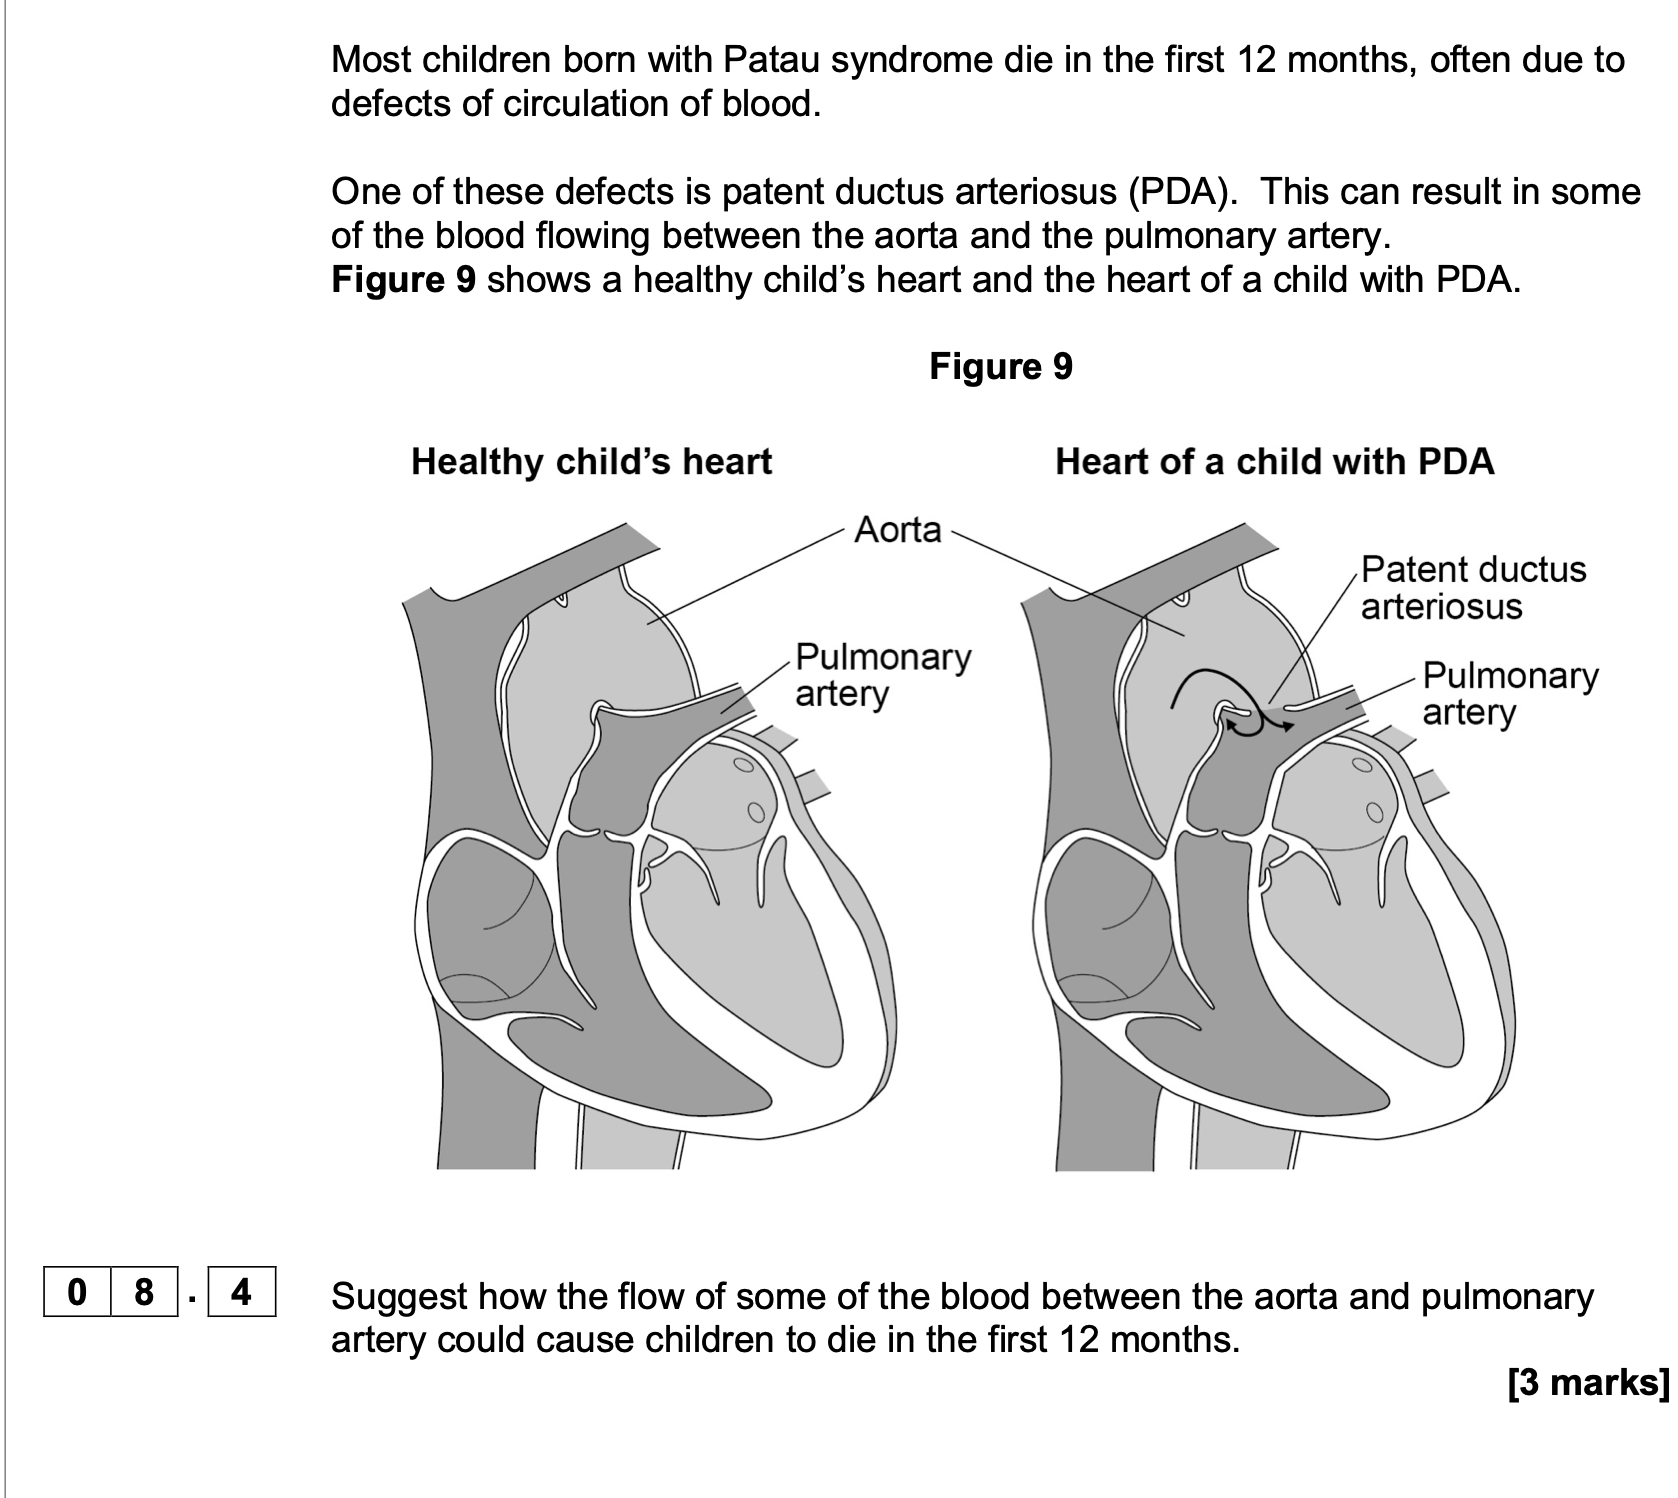
Explain why all the cells of the body will have this mutation.
1. Mutation / extra chromosome in
gamete/egg/sperm (that formed zygote);
2. All cells derived (from a single cell/zygote) by
mitosis;
3. OR
All cells derived from a single cell/zygote by
mitosis;
4. Mitosis produces genetically identical cells / a
clone;
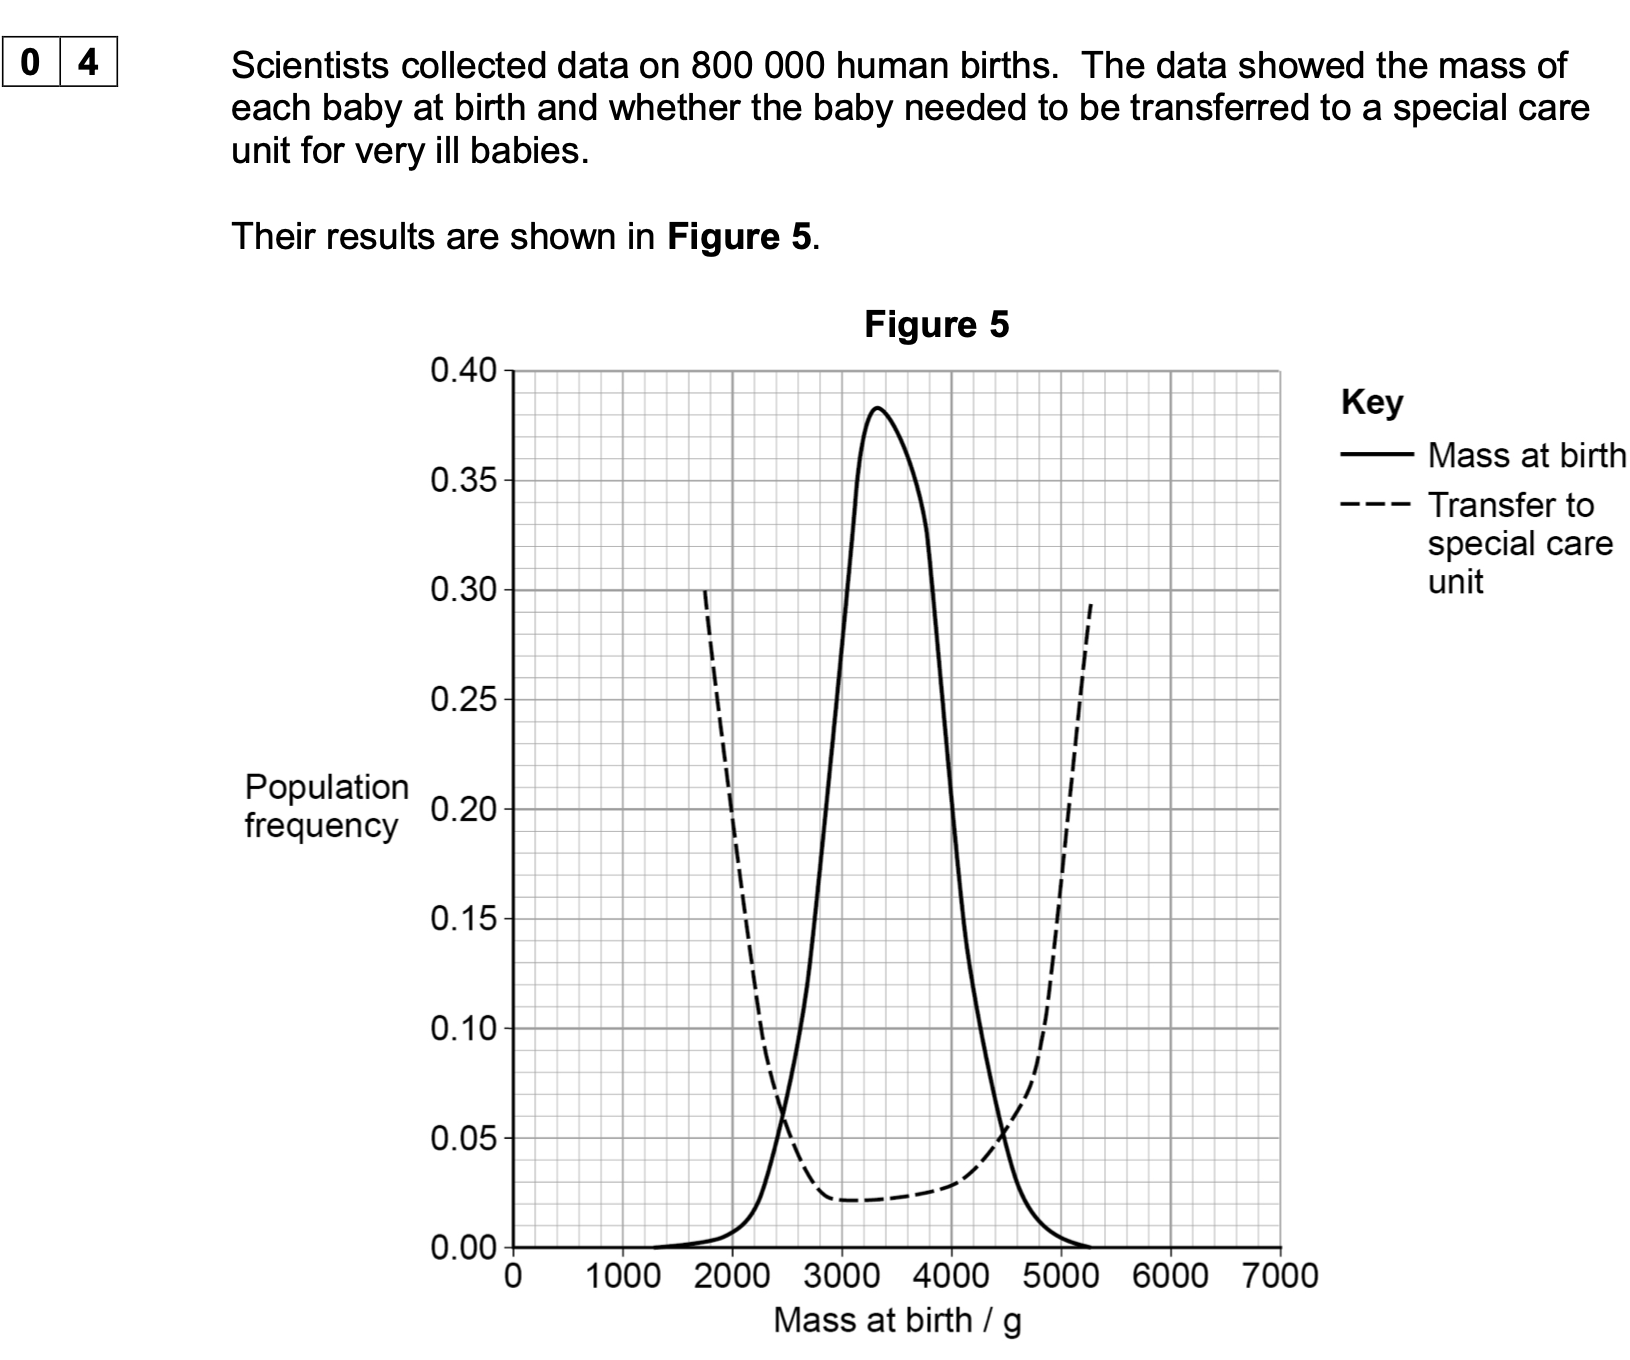
Use Figure 5 to explain how human mass at birth is affected by stabilising selection.
1. (Most likely to be) transferred to a special care
unit are those under 2800 g
OR
(Most likely to be) transferred to a special care
unit are those over 4200 g;
2. Extreme mass babies least likely to survive (to
reproduce) and so less likely to pass on their
alleles (for extreme mass at birth);
3. Extreme mass at birth decreases in frequency
(in the population)
OR
Alleles (for extreme mass at birth) decrease in
frequency (in the population);
If neither 1 or 2 awarded allow correct stated mass
less/more likely to survive for 1 mark
3 Accept converse
answers linked to
those with mass at
birth at any value
between 2800 and
4200 g.
1. For ‘2800 g’ accept
any value between
1400 g and 2800 g.
1. For ‘4200 g’ accept
any value between
4200 g and 5200 g.
1. If values for both
extremes are given,
both must be correct.
1. Reject data quoted
below 1400 g or above
5200 g.
3. Accept
‘proportion/percentage’
for ‘frequency’.
3. Do not accept
‘number’ for
‘frequency’.
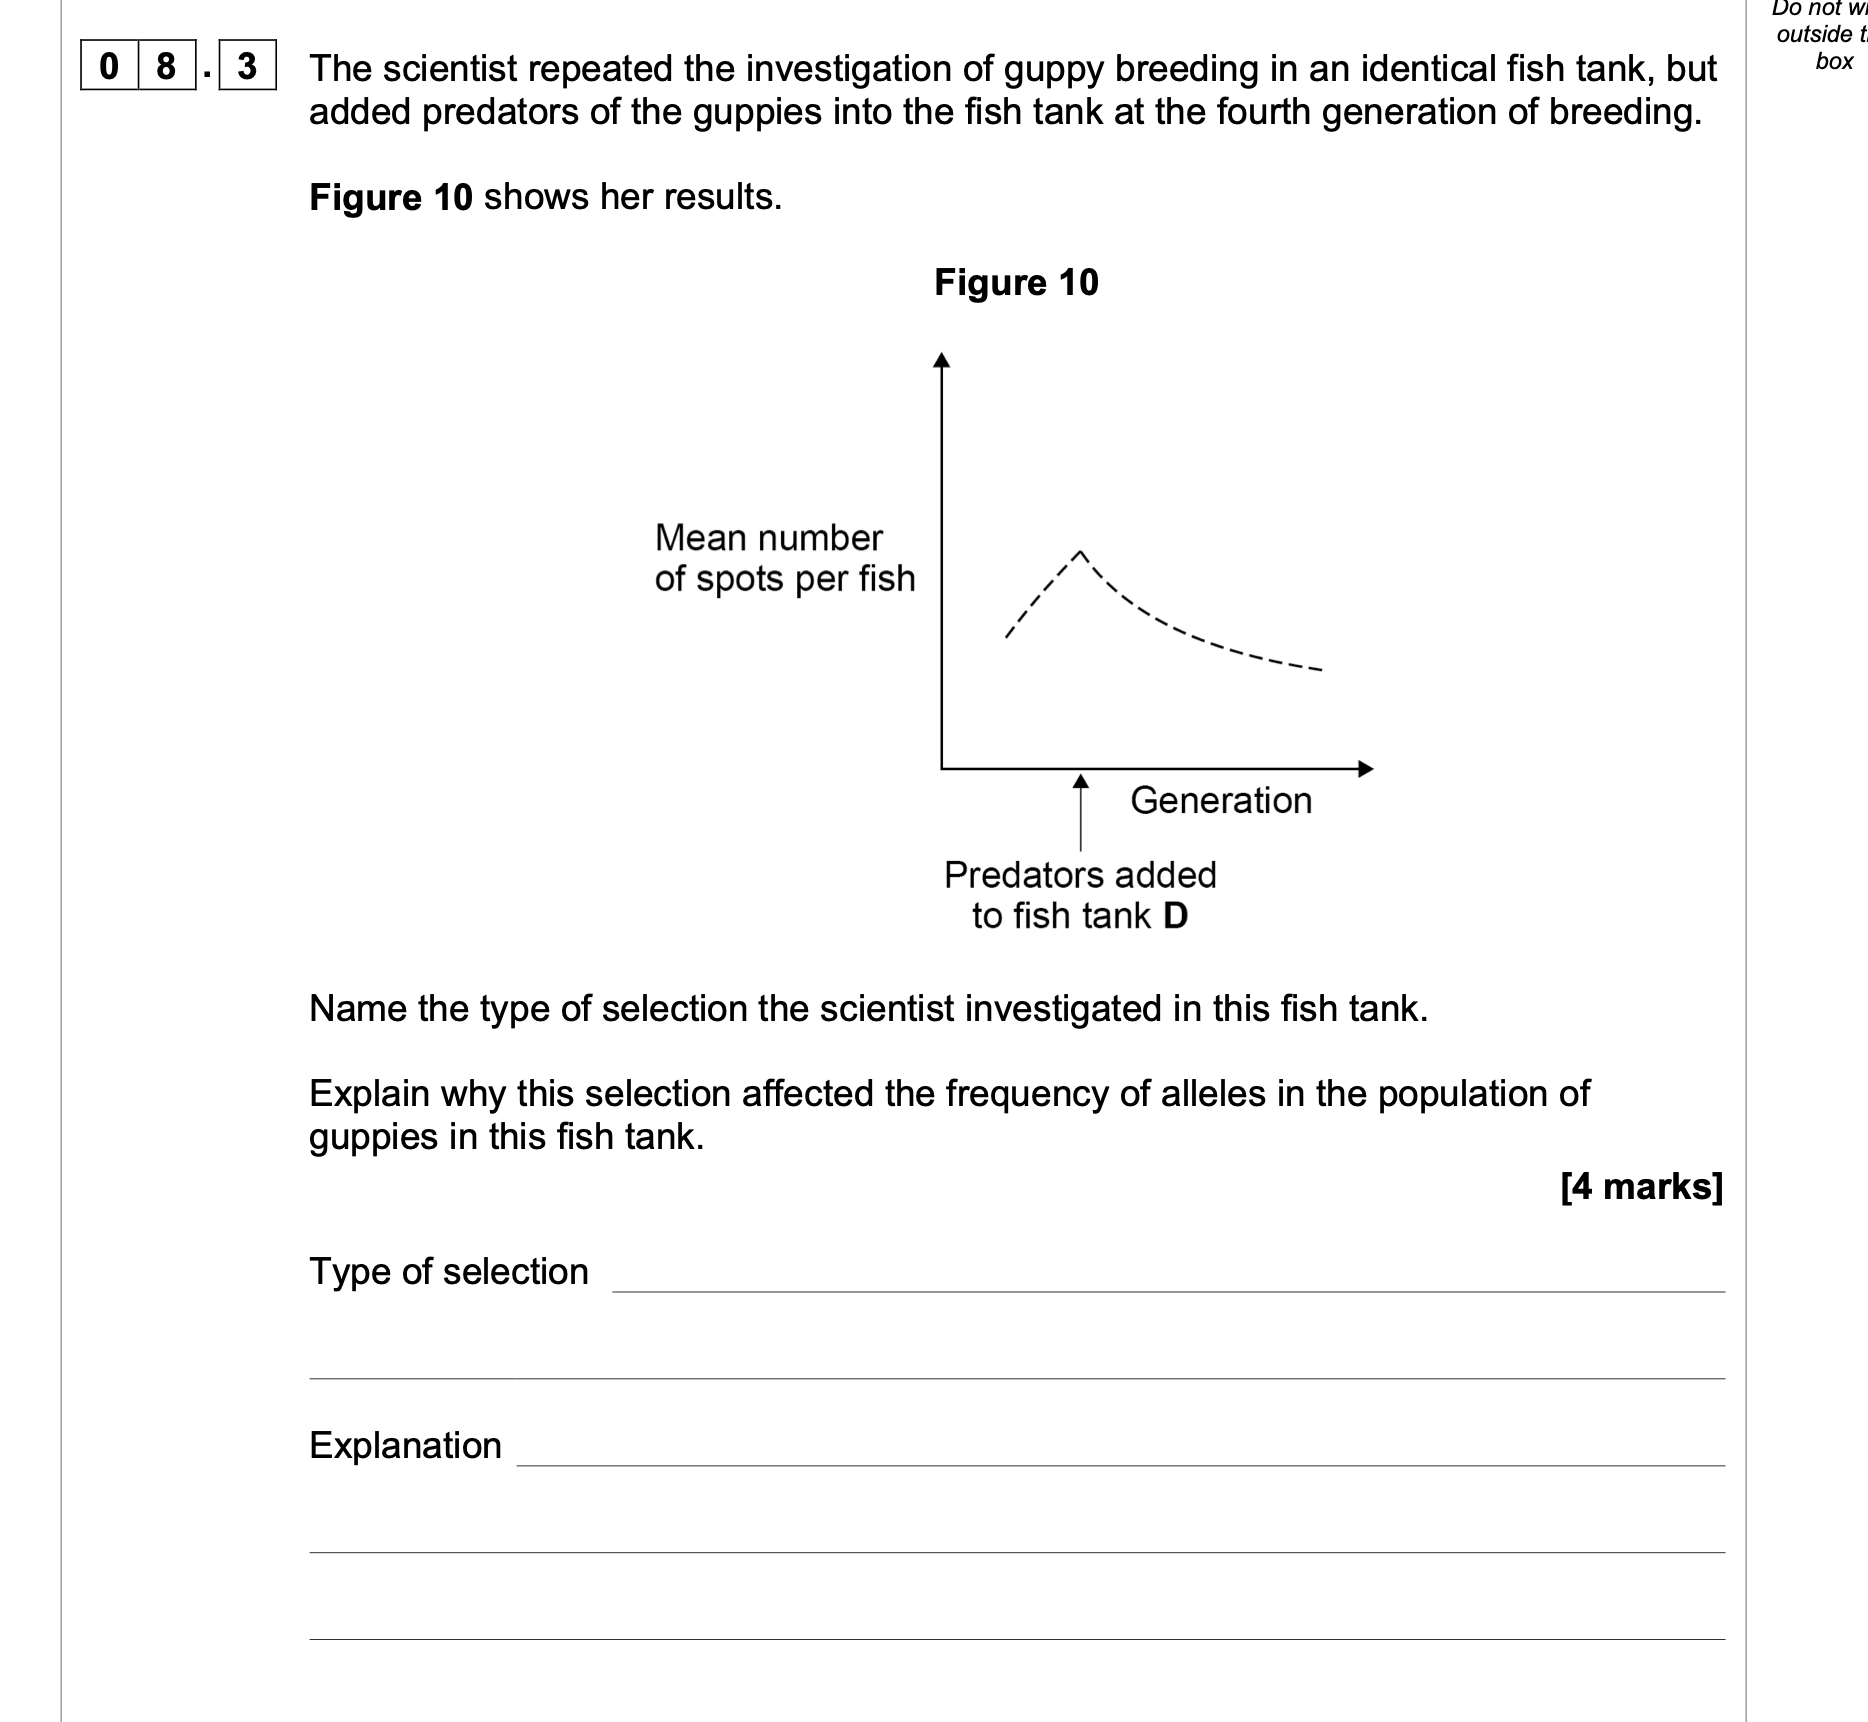
1. Directional;
2. Fish with more spots are more likely to be
predated;
3. Alleles for (more) spots not passed on;
4. (So) frequency of (more) spots alleles
decreases;
4
(4 x AO2)
2. 3. and 4. Accept
converse
2. Accept killed/eaten
for ‘predated’
2. Accept more of
them killed/eaten, for
‘more likely’
3. and 4. Reject ‘gene’
once
4. Accept ‘proportion’
for frequency
Ignore ‘number of
alleles decreases’
![<p>0 7 . 1 Can you conclude that the insect pest resistant to Bt toxin found in the years 2002 to</p><p class="p2">2005 was the same insect species? Explain your answer.</p><p class="p1">[1 mark]</p><p class="p2">7.2 One farmer stated that the increase in the use of Bt crop plants had caused a mutation</p><p class="p2">in one of the insect species and that this mutation had spread to other species of</p><p class="p2">insect. Was he correct? Explain your answer.</p><p class="p1">[4 marks]</p>](https://knowt-user-attachments.s3.amazonaws.com/31979c51-46ac-45d2-99da-a15b494b5557.png)
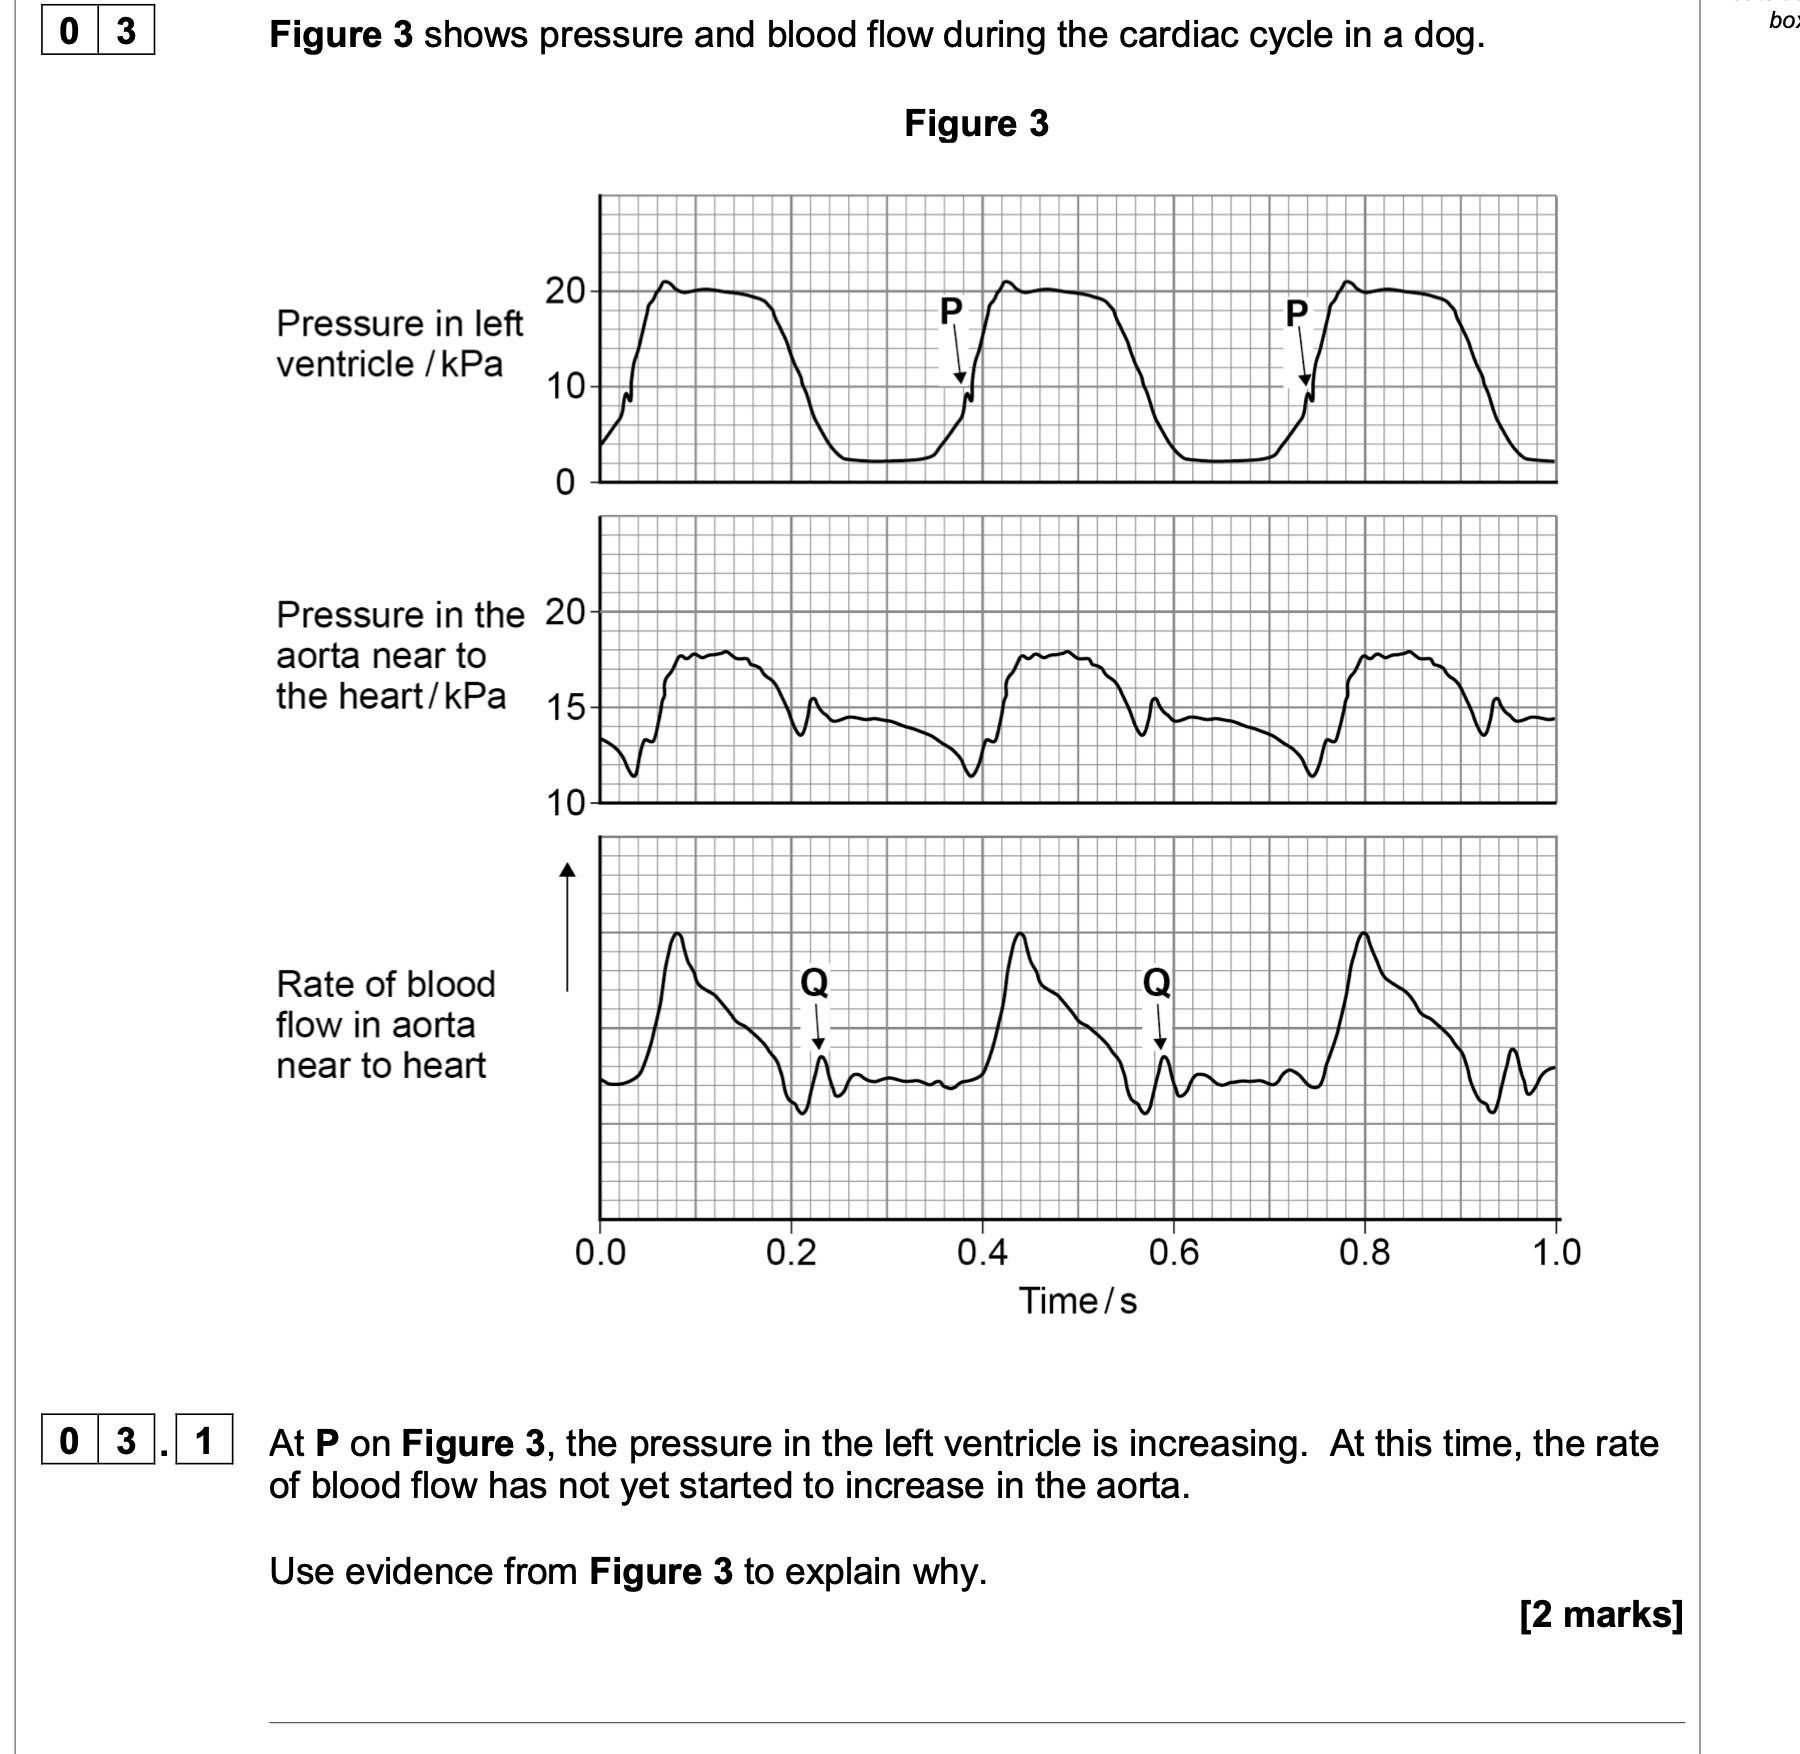
0 7 . 1 Can you conclude that the insect pest resistant to Bt toxin found in the years 2002 to
2005 was the same insect species? Explain your answer.
[1 mark]
7.2 One farmer stated that the increase in the use of Bt crop plants had caused a mutation
in one of the insect species and that this mutation had spread to other species of
insect. Was he correct? Explain your answer.
[4 marks]
7.2 Mutations are spontaneous/random;
2. Only the rate of mutation is affected by
environment;
3. 4. Different species do not interbreed/do not
produce fertile offspring;
So mutation/gene/allele cannot be passed from
one species to another;
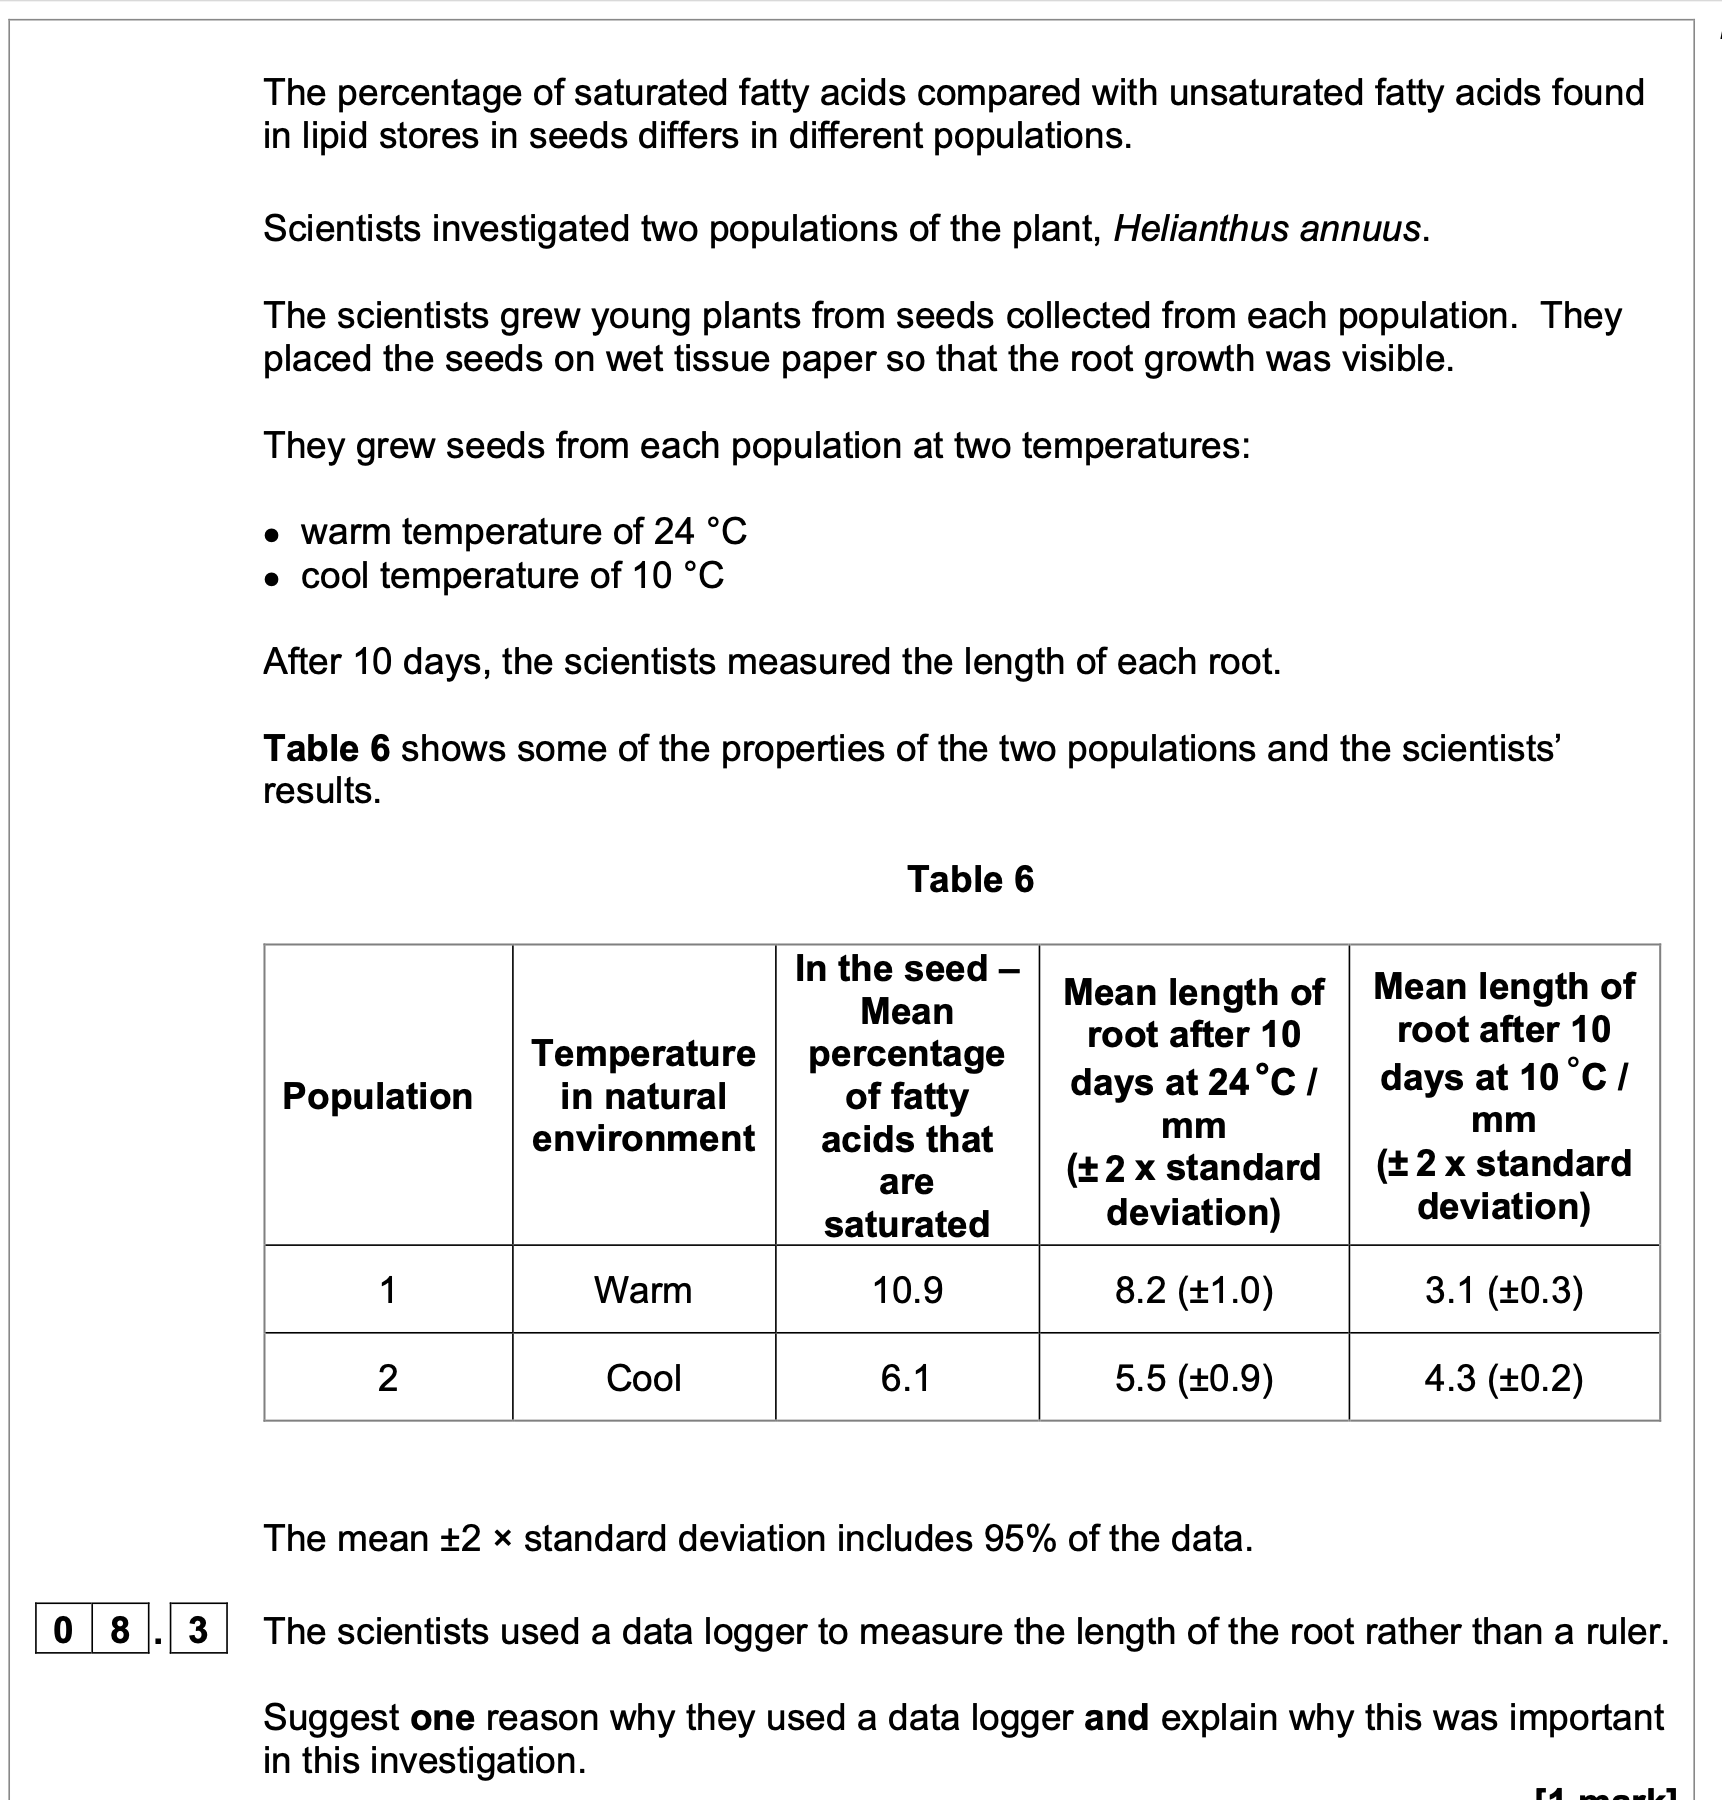
It is known that:
Do not write
outside the
box
• during respiration saturated fatty acids yield more energy than unsaturated fatty
acids
• saturated fatty acids have higher melting points than unsaturated fatty acids
• lipases in seeds act more rapidly on liquid substrates.
Use this information and Table 6 to show how each population is better adapted for its
natural environment when compared with the other population.
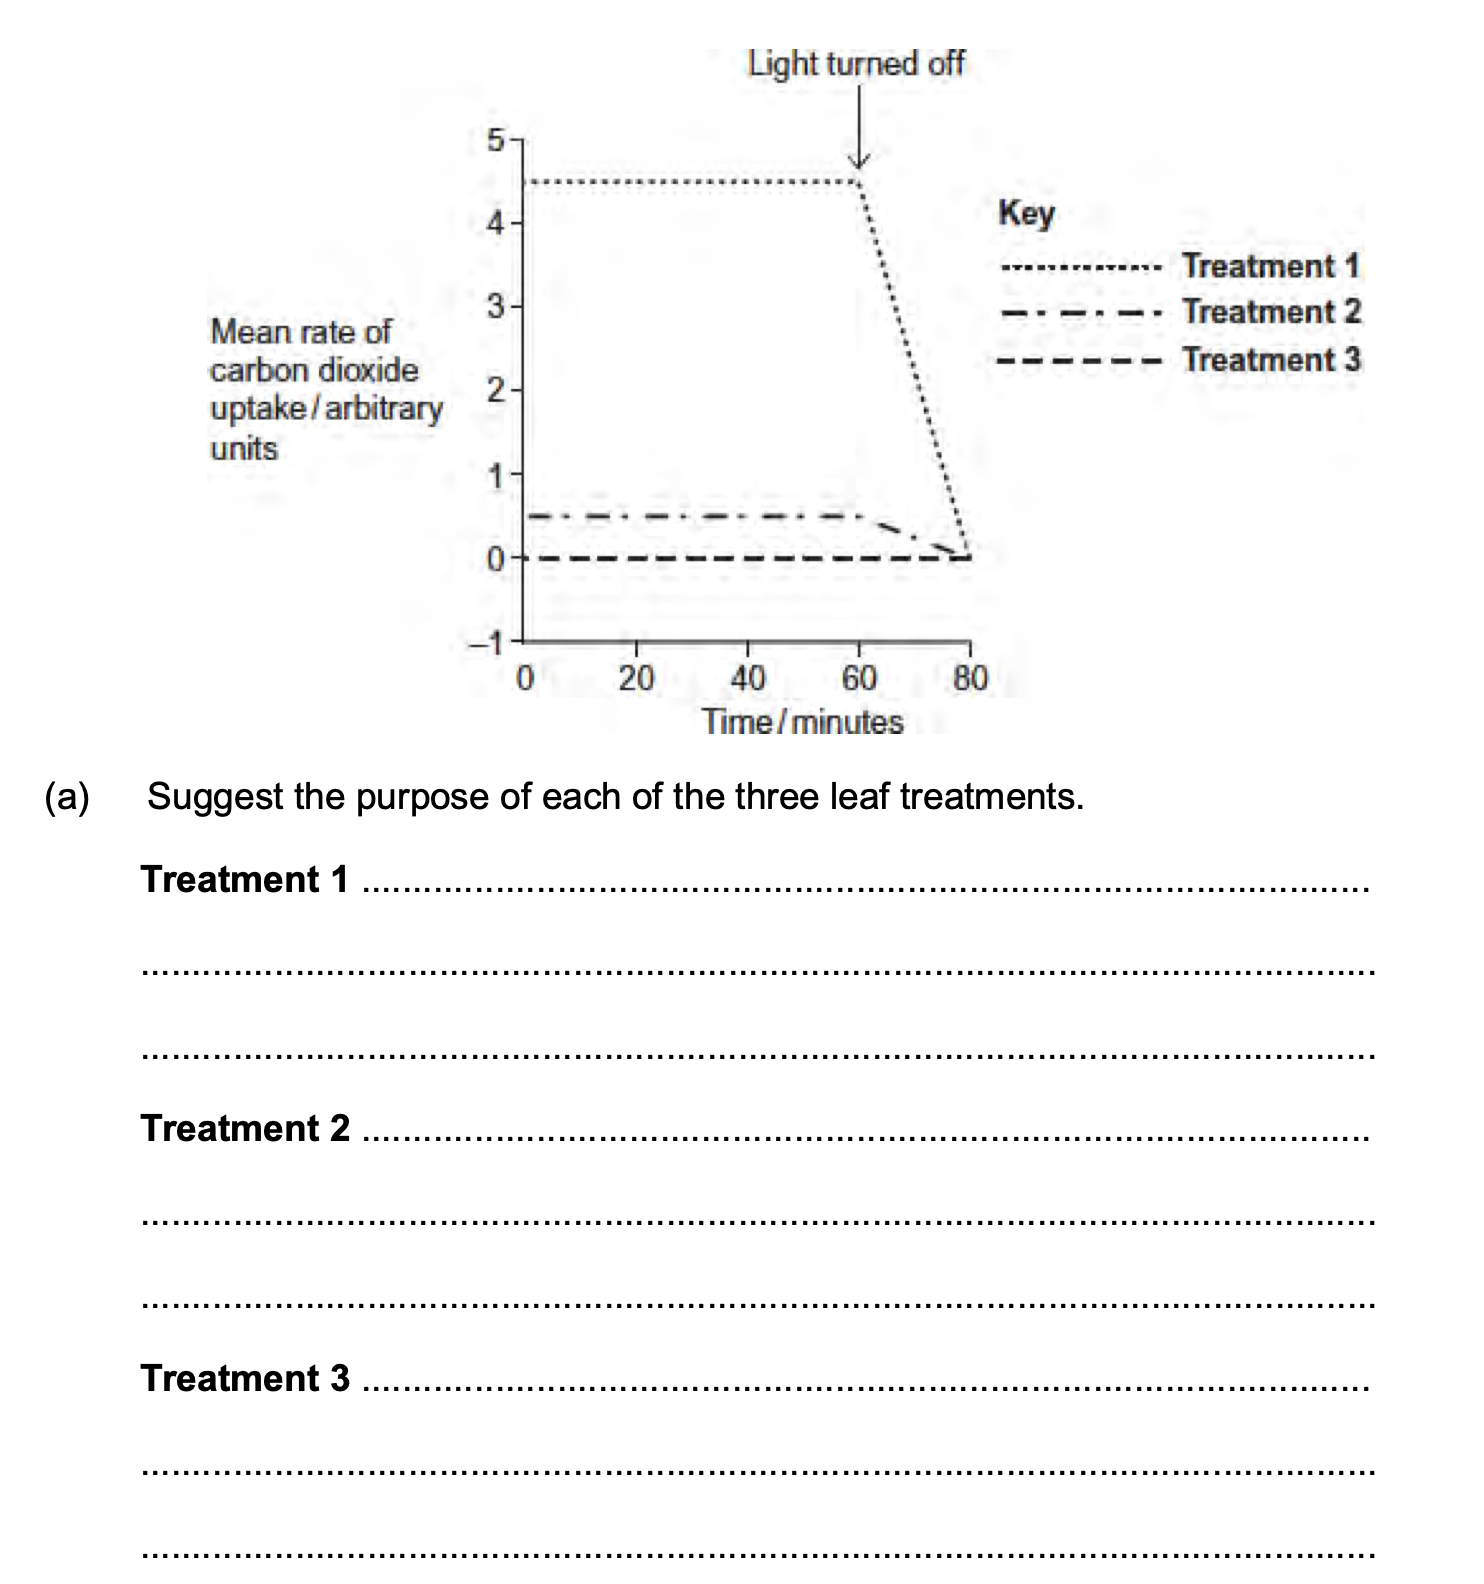
Q3.Scientists studied the rate of carbon dioxide uptake by grape plant leaves. Grape leaves
have stomata on the lower surface but no stomata on the upper surface.
The scientists recorded the carbon dioxide uptake by grape leaves with three different
treatments:
Treatment 1 − No air-sealing grease was applied to either surface of the leaf.
Treatment 2 − The lower surface of the leaf was covered in air-sealing grease that
prevents gas exchange.
Treatment 3 − Both the lower surface and the upper surface of the leaf were covered in
air–sealing grease that prevents gas exchange.
The scientists measured the rate of carbon dioxide uptake by each leaf for 60 minutes in
light and then for 20 minutes in the dark.
The scientists’ results are shown in the diagram below.
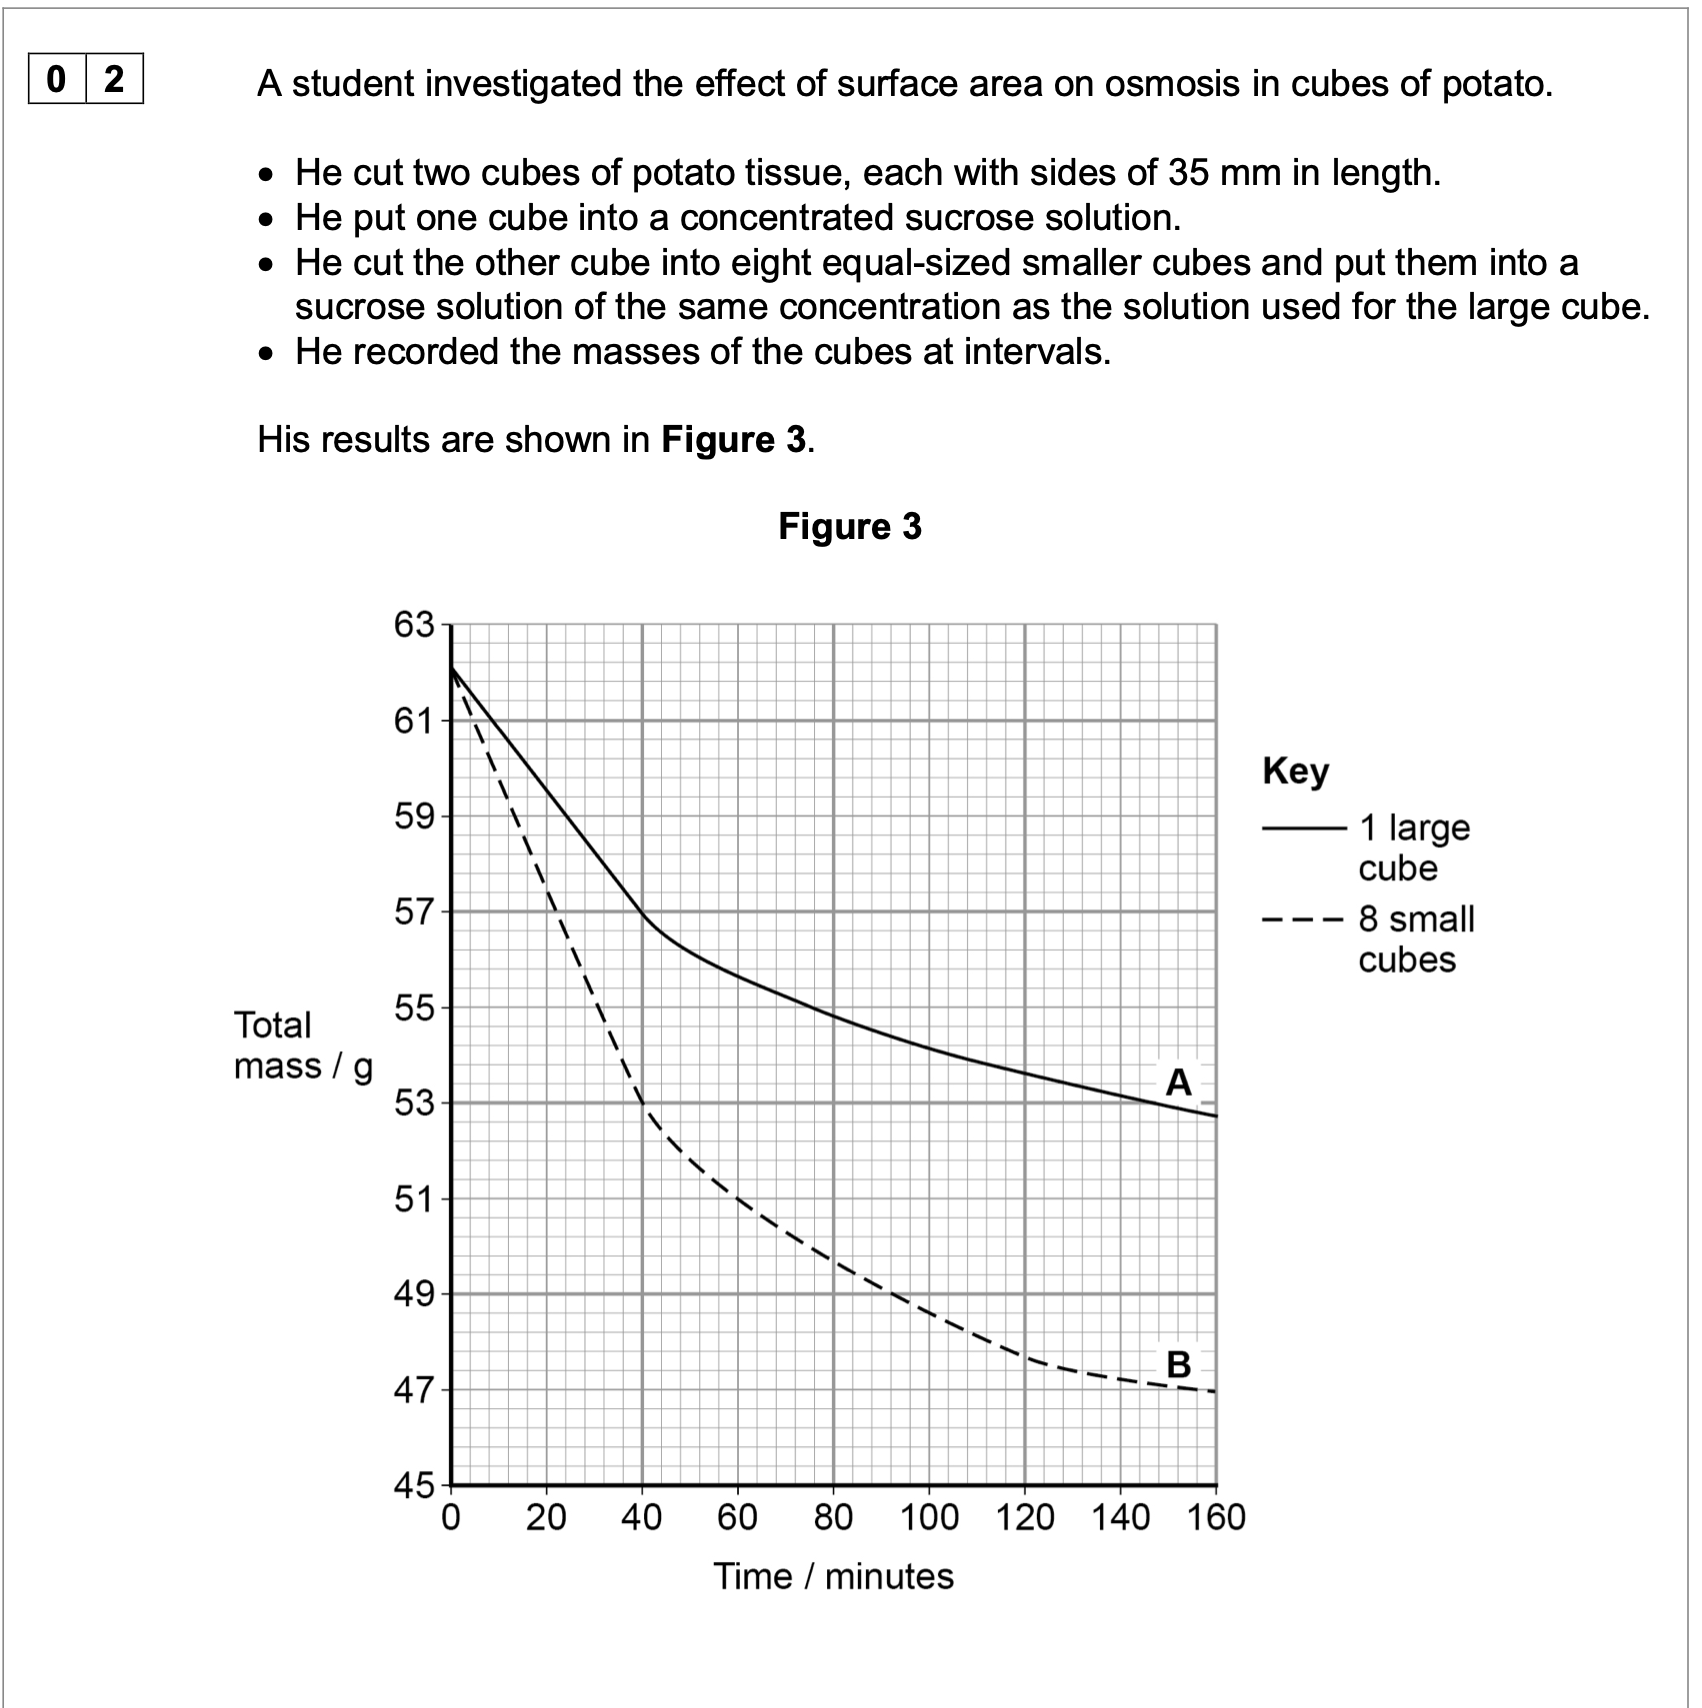
Describe the method the student would have used to obtain the results in
the graph. Start after all of the cubes of potato have been cut. Also
consider variables he should have controlled.
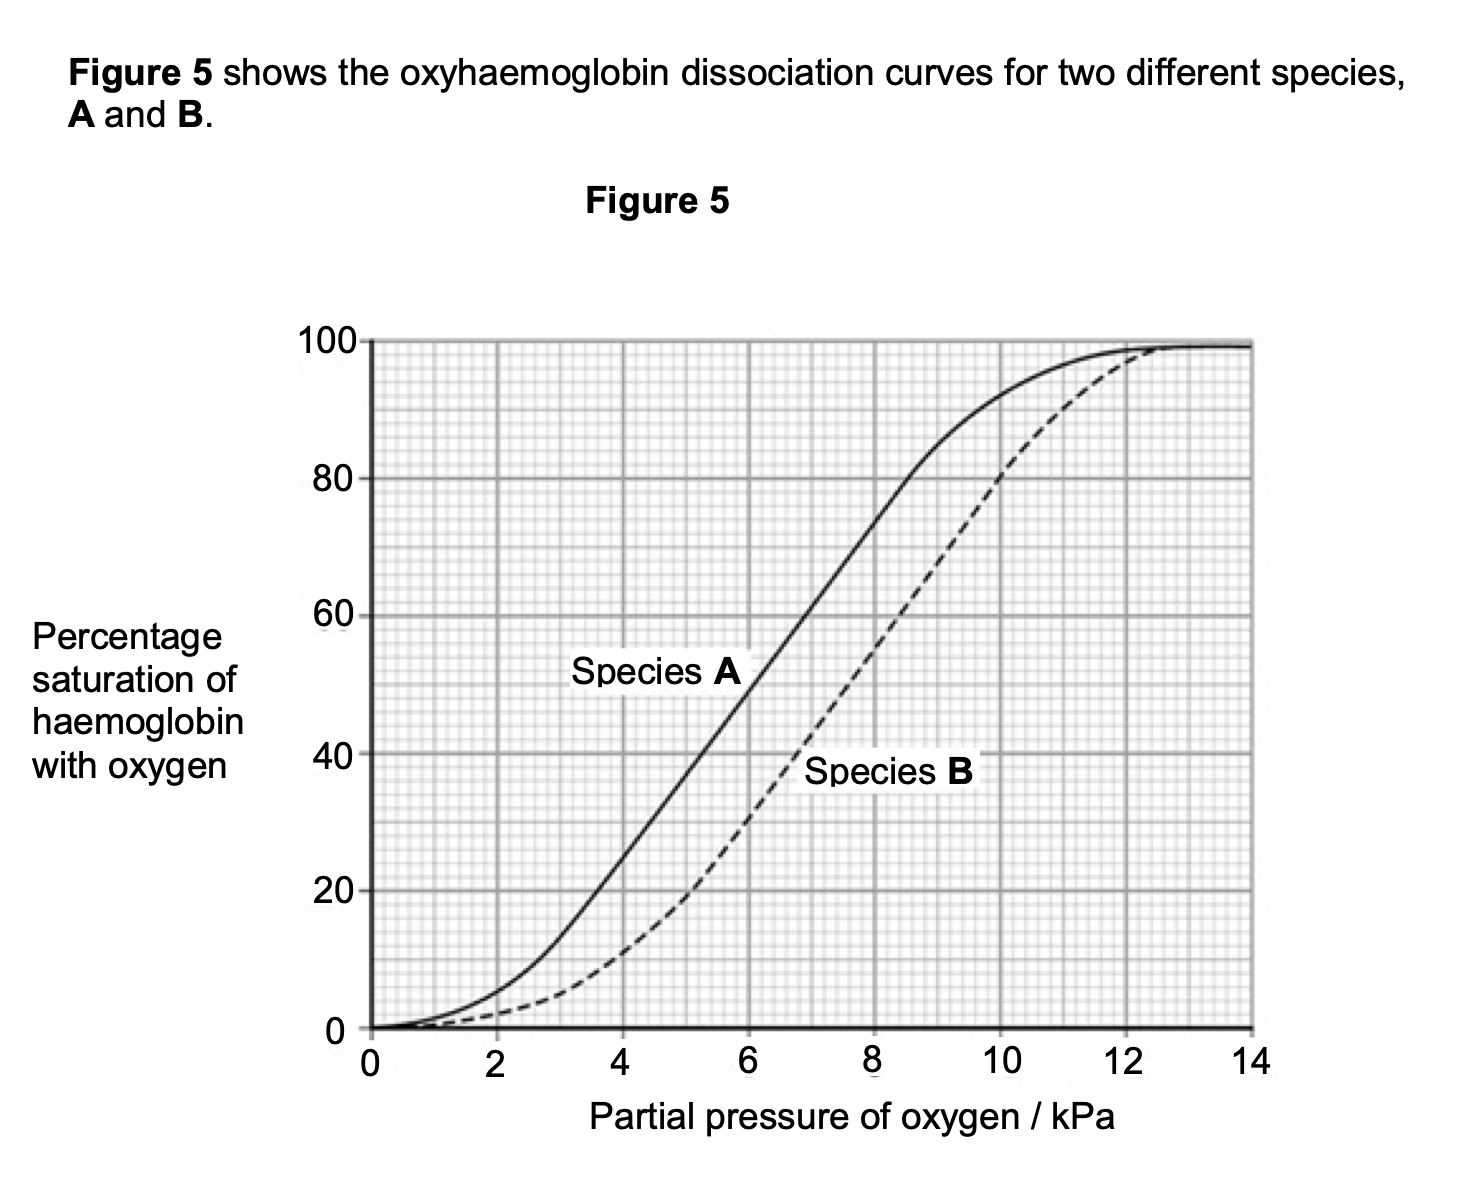
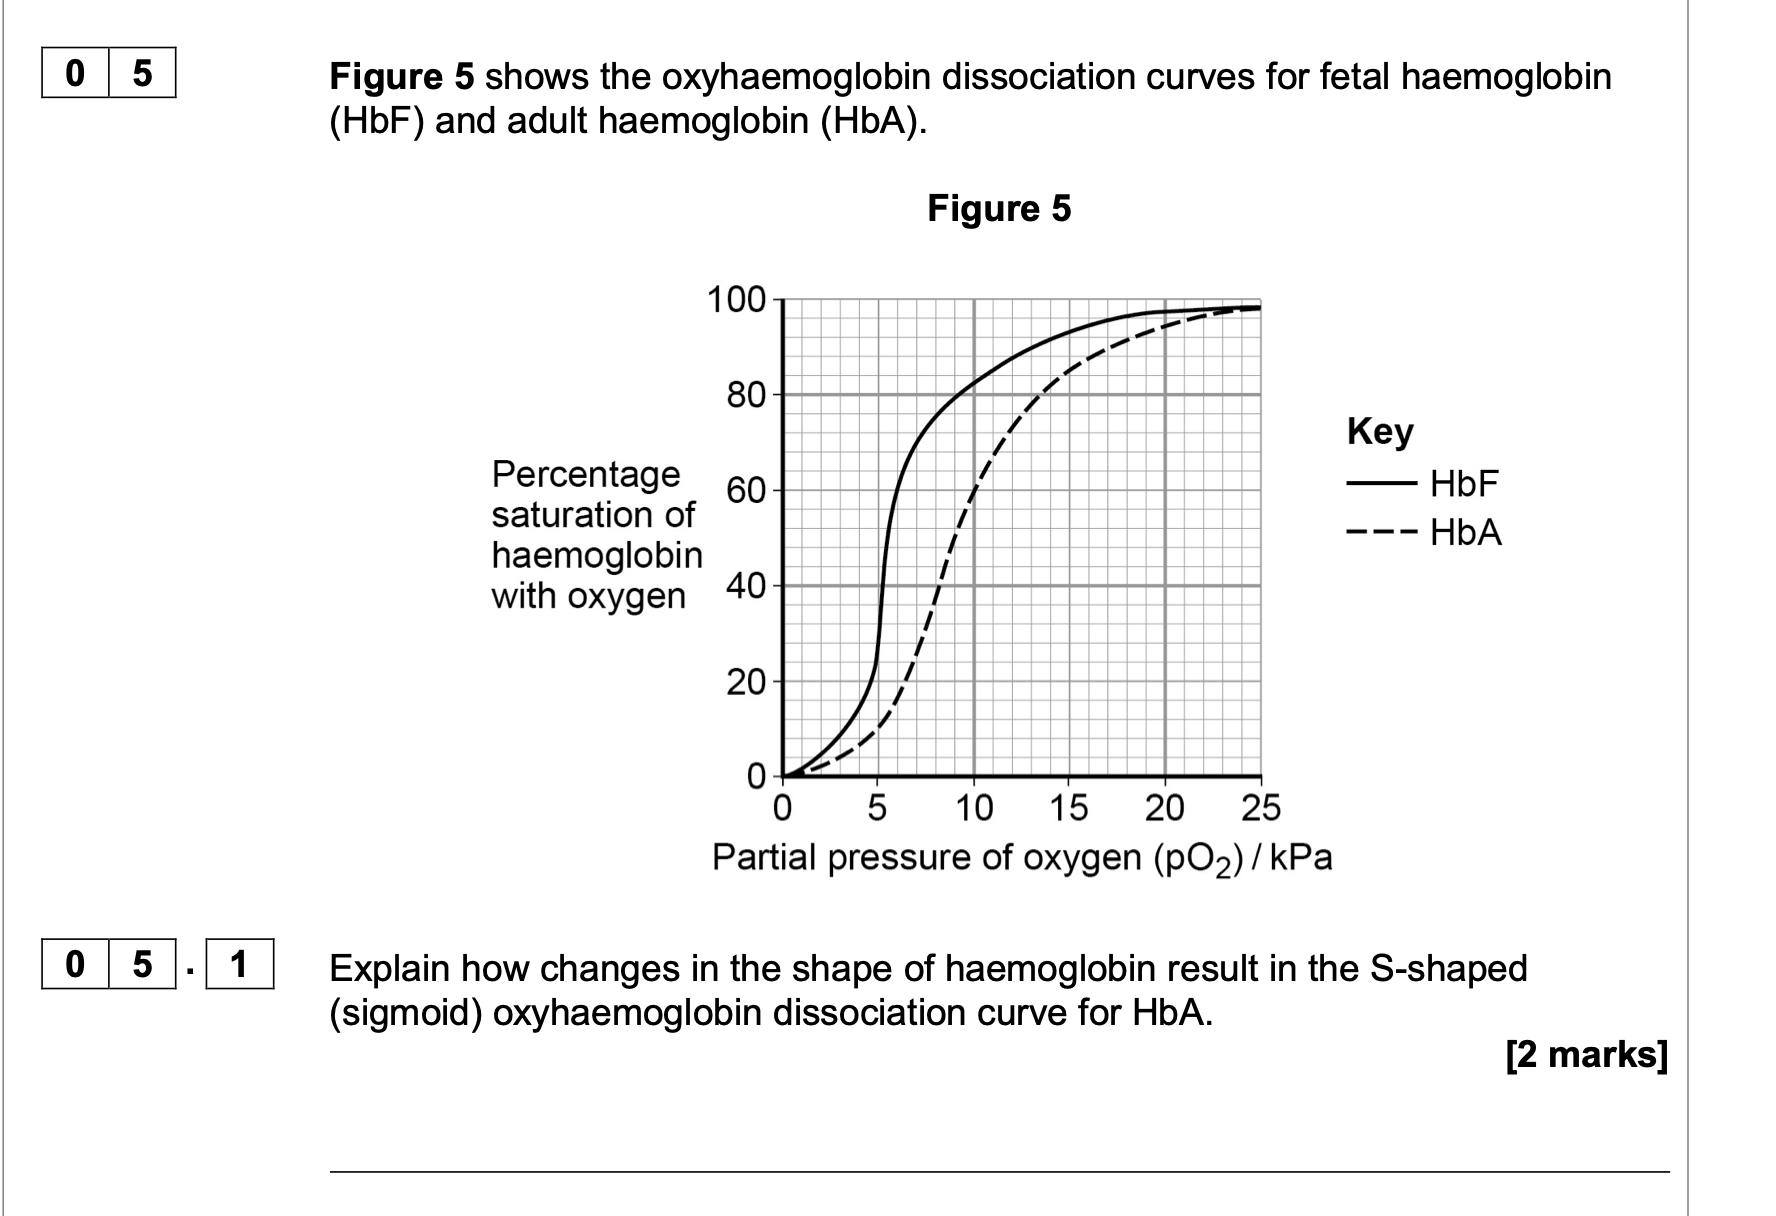
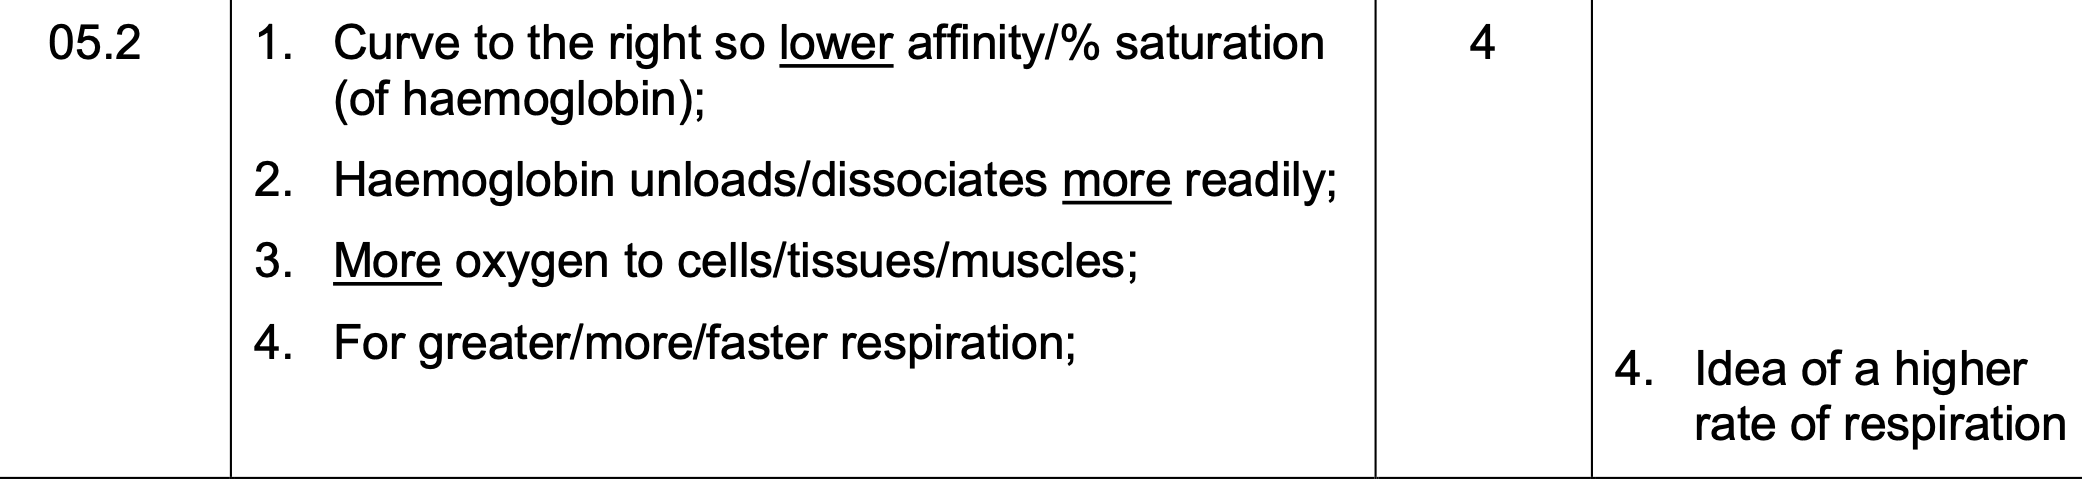
Species B is more active than species A. Use Figure 5 to explain how the
haemoglobin of species B allows a greater level of activity.
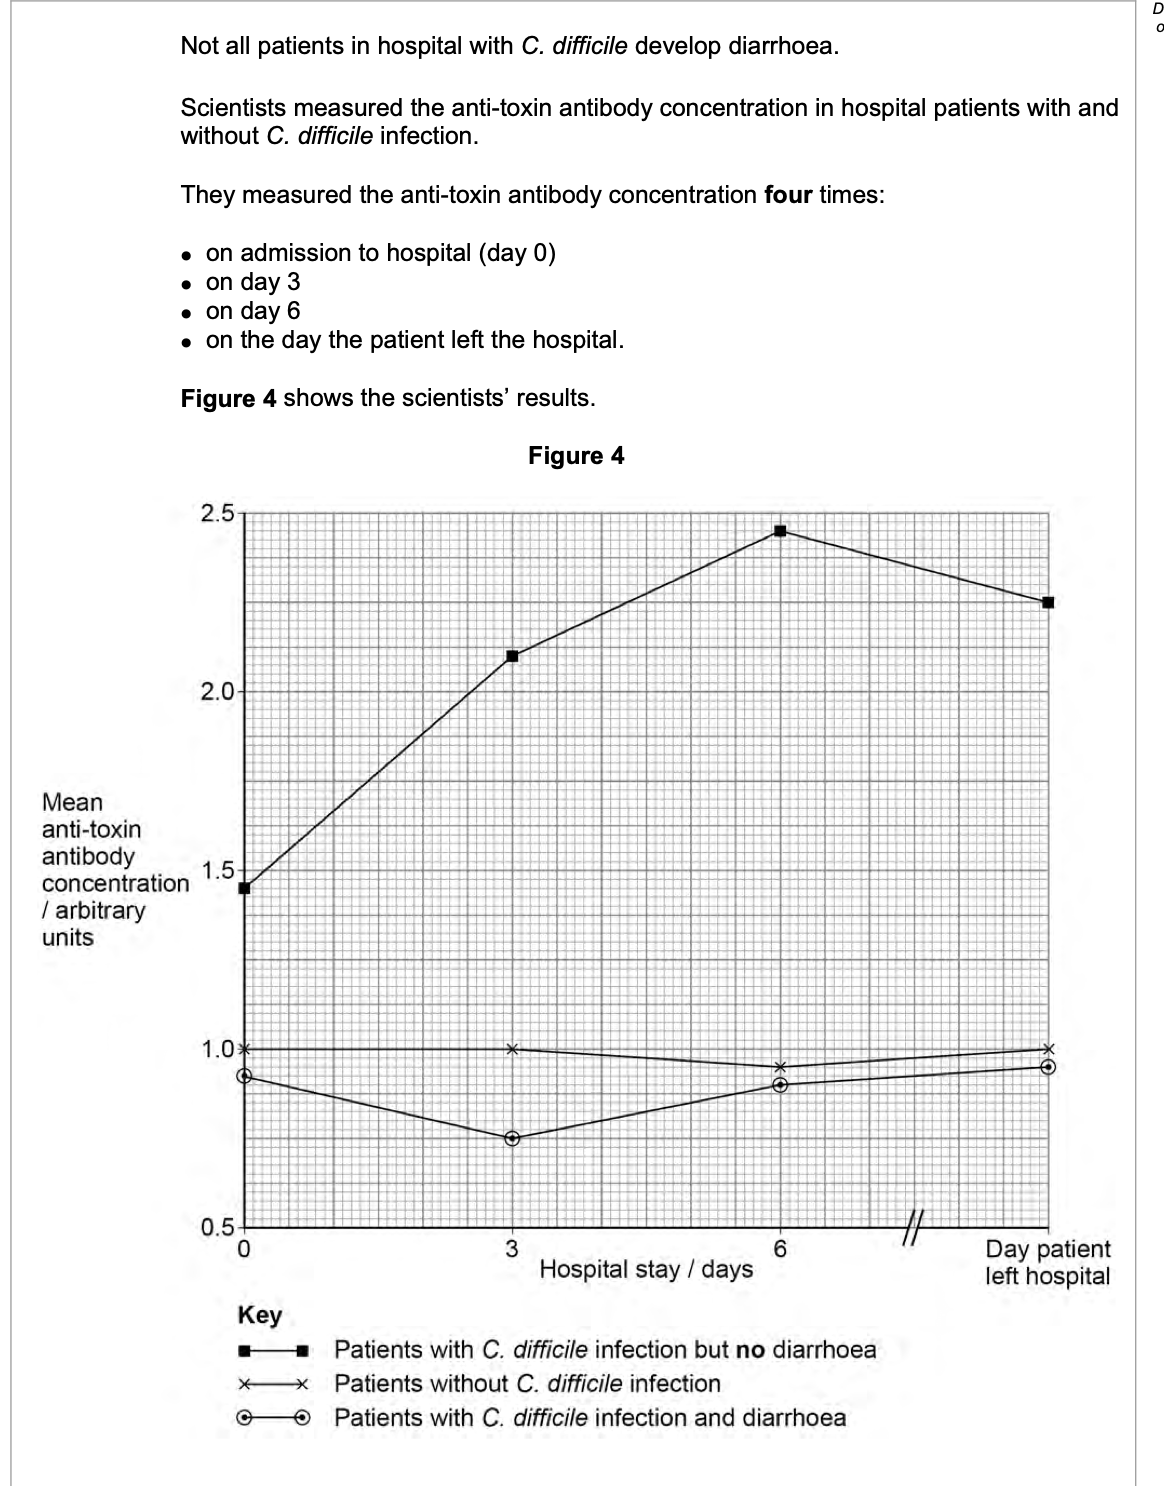
The scientists suggest that the anti-toxin antibody could be given to some patients as
a form of passive immunity.
Use Figure 4 to suggest how this passive immunity would work and which patients
should be offered this anti-toxin antibody.
1. Anti-toxins/antibodies cause phagocytosis/
destruction/agglutination/neutralisation (of
toxin);
2. Anti-toxin/antibody prevents/reduces (chance of)
diarrhoea
OR
(C difficile) patients with no diarrhoea have
high(est) (concentration of) anti-toxin/antibody
OR
(C difficile) patients with diarrhoea have low(est)
(concentration of) anti-toxin/antibody;
3. (Offered to C. difficile) patients with diarrhoea
OR
(Offered to) patients with low (concentrations of)
anti-toxin/antibody;
3
(1 x
AO1, 2
x AO2)
1. For ‘neutralised’,
accept idea of
preventing toxin
binding/damaging
cells lining the
ileum.
2. and 3 Accept
people for patients
2. Ignore symptoms
for diarrhoea
3. Accept ‘passive
immunity offered’ for
‘antibody offered’

0 6 . 2 Using Figure 4 and Table 3, what can you conclude from treatments D and E about root growth?
1. (D shows) substance (X) is not required for
(some) root growth / production of roots;
OR
Substances (already) present in stem cause
(some) root growth;
2. Substance X moves through plant;
3. (E shows) substance (X) causes / increases /
doubles number of roots / root growth;
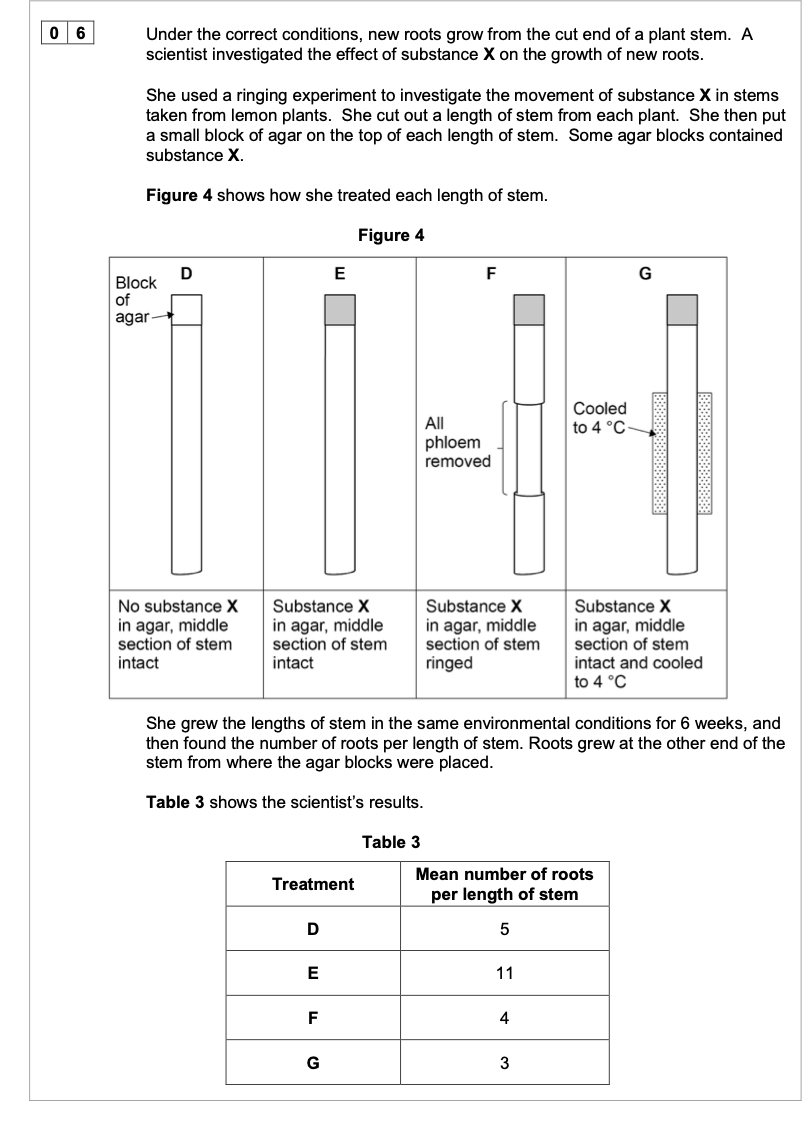
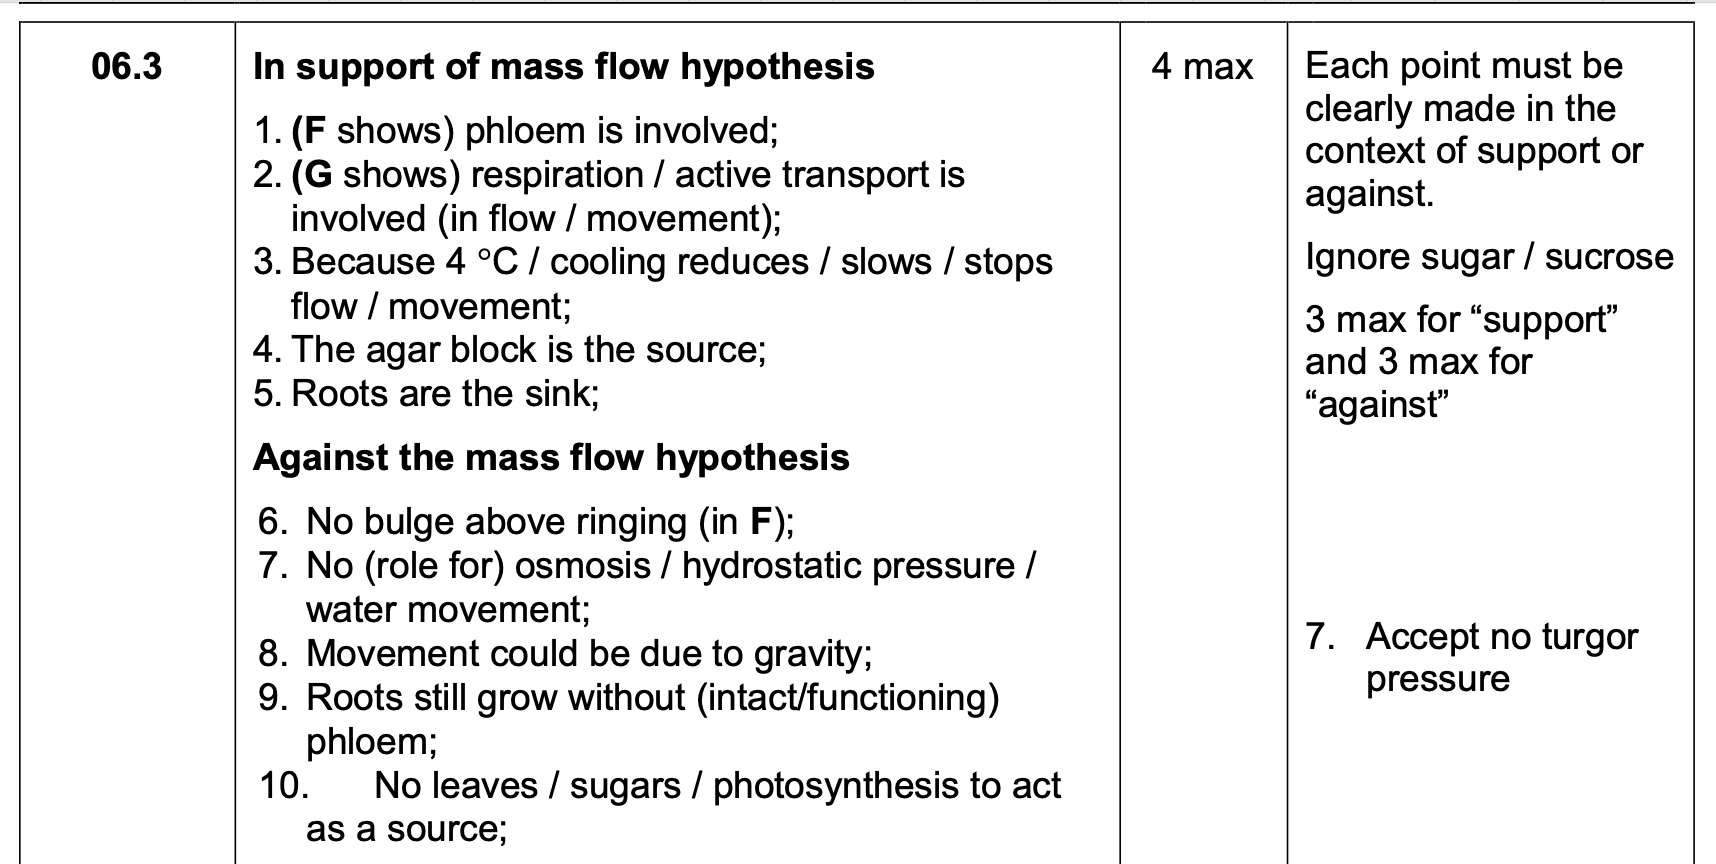
The mass flow hypothesis is used to explain the movement of substances through
phloem.
Evaluate whether the information from this investigation supports this hypothesis.
Do not consider statistical analysis in the answer
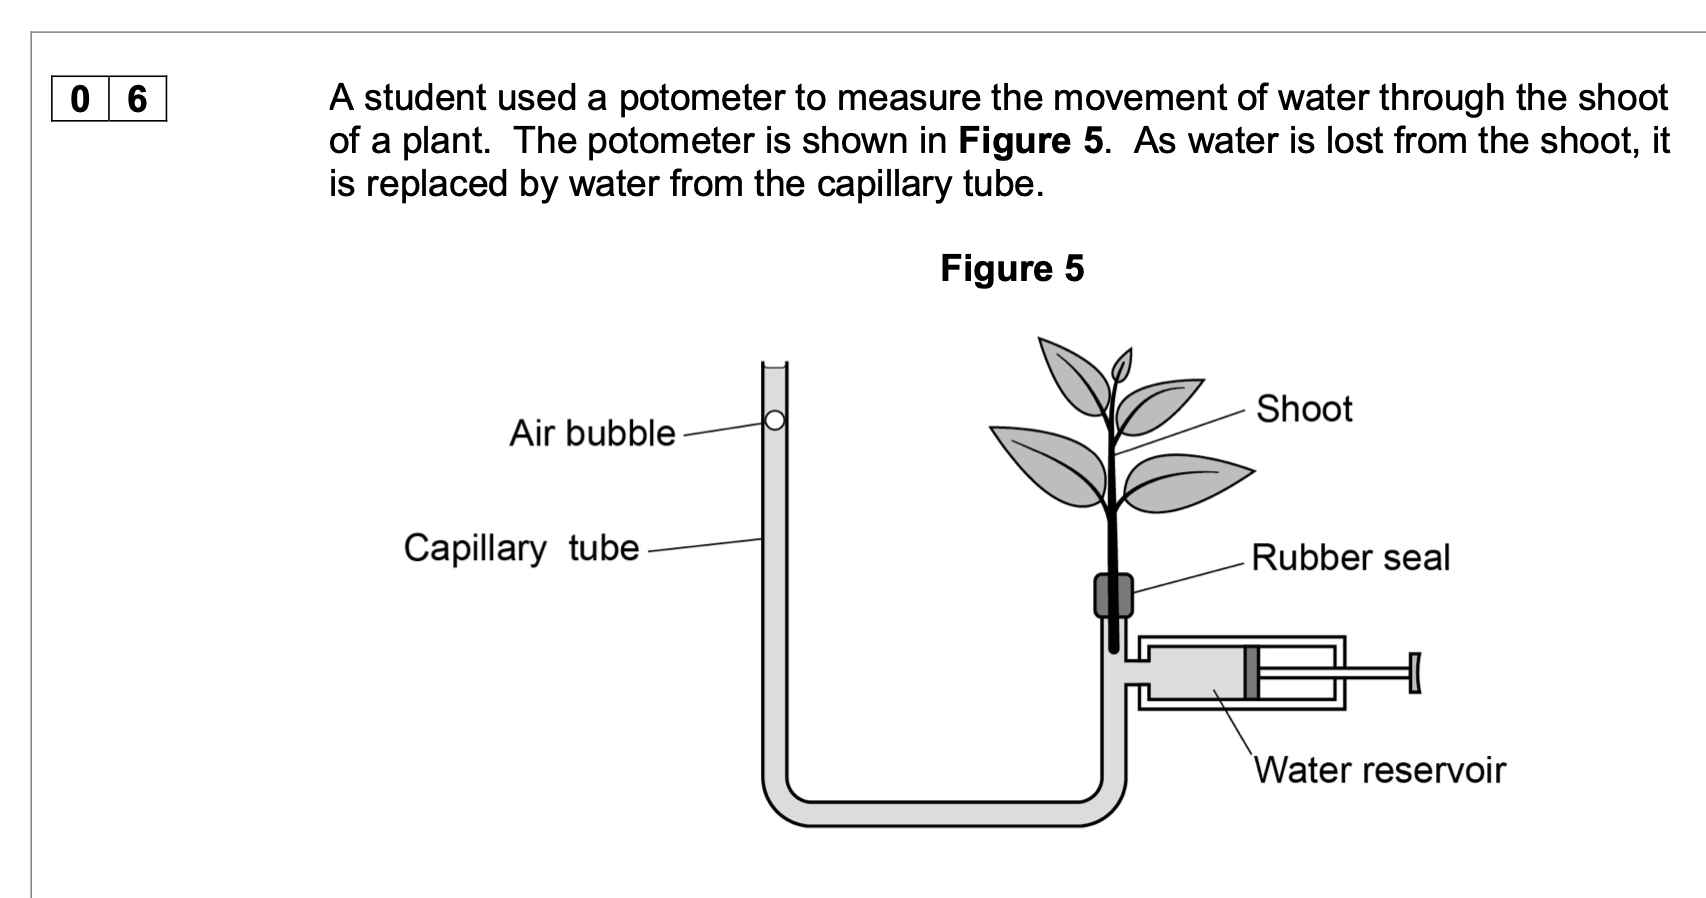
The student wanted to determine the rate of water loss per mm2 of surface area of
the leaves of the shoot in Figure 5.
Outline a method she could have used to find this rate. You should assume that all
water loss from the shoot is from the leaves.
1. Method for measuring area;
eg draw round (each) leaf on graph paper and
count squares;
2. 3. Of both sides of (each) leaf;
Divide rate (of water loss/uptake from
potometer) by (total) surface area (of leaves);