week 8 correlation and regression
1/13
There's no tags or description
Looks like no tags are added yet.
Name | Mastery | Learn | Test | Matching | Spaced | Call with Kai |
|---|
No study sessions yet.
14 Terms
what is causation?
the dependency of something happening based on another factor
what is the pearson’s correlation coefficient
r is a number between -1 and 1 and provides a measure of the strength and direction of the correlation
what is the interpretation of the following results for ‘r’? (negative)
-0 to -0.2
-0.2 to -0.4
-0.4 to -0.6
-0.6 to -0.8
-0.8 to -1
very weak
weak
moderate
strong
very strong
what is the intepretation of the following results for ‘r’
-0 to -0.2
0.2 to 0.4
0.4 to 0.6
0.6 to 0.8
0.8 to 1
very weak
weak
moderate
strong
very strong
what is it important to remember about interpretating ‘r’
correlation does not mean causation → beware of hidden third factors eg does smoking cause cancer or is it the underlying stress that cause people to smoke and this stress causes cancer?
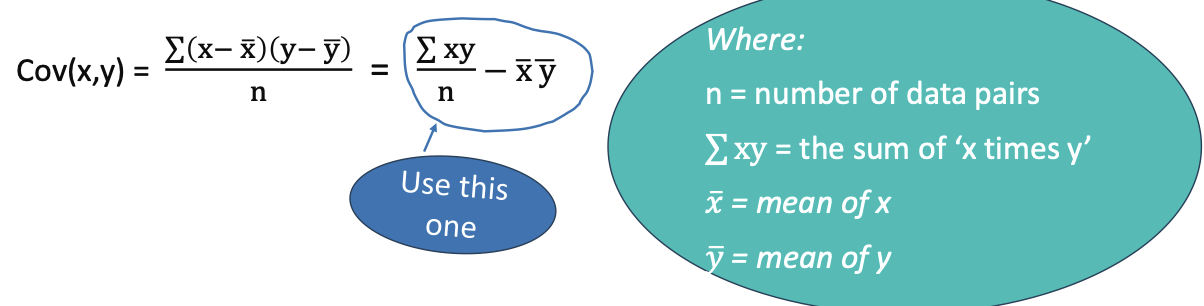
what is covariance?
this is measuring the spread of the data pairs from the mean (similar to standard deviation)
formula for covariance?
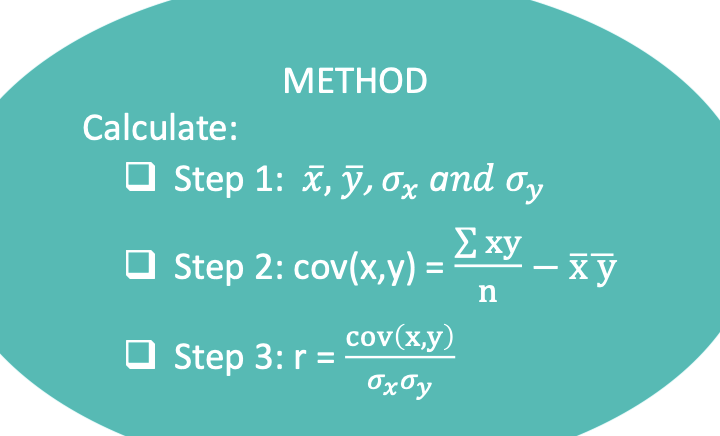
what is the step by step of calculating pearson’s correlation coefficient?
what does r tell us?
the strength and direction of a relationship → if r is strong, we can be confident about making forecasts of Y from X
what is the difference between Y and X
Y = dependent variable
X = independent variableha w
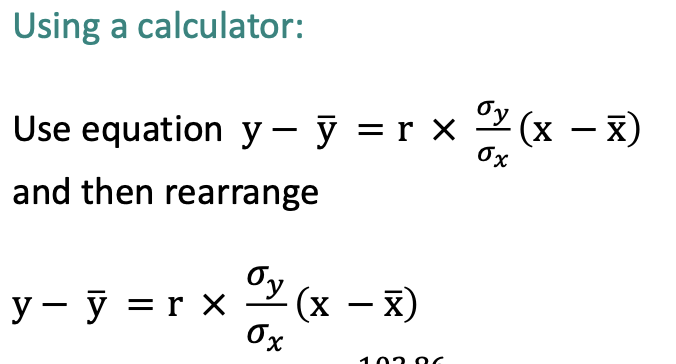
what do u need to make a forecast?
a regression line (line of best fit between the data)
what is equation of straight line?
y = a+bx
a = y intercept
b = gradient/slope
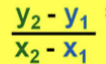
how do u calculate the gradient?
how do u calculate the regression line?