ess test 2.1 and 2.2
1/99
There's no tags or description
Looks like no tags are added yet.
Name | Mastery | Learn | Test | Matching | Spaced | Call with Kai |
|---|
No analytics yet
Send a link to your students to track their progress
100 Terms
Ecology
the study of living/nonliving parts of an ecosystem that interact within it
Levels of ecological organization
biosphere, biome, ecosystem, community, population, individual
Biosphere
an ecological system composed of individuals, populations, communities, and ecosystems
Biome
large, major habitat for a community of flora and fauna
Ecosystem
the organisms and their physical environment, and the interactions between the living and nonliving components within them
Community
a group of two or more populations of species living in the same area at the same time
Population
a group of organisms of the same species living in the same area at the same time
Individual
a singular organism
Species
a group of organisms that can interbreed and produce fertile offspring (i.e. the biological species concept)
binomial nomenclature
two-part name
the first part is the genus
the second part is the name specific to the species
- italicized when typed, underlined when written
clade
a taxonomic group which contains one ancestor and all its descendants
Habitat
the location in which a community, species, population, or organism lives
Niche
the abiotic and biotic conditions + resources upon which the organisms depend on
ecological niche
the role of a species in an ecosystem
Abiotic factors
non-living physical factors that may influence organisms
Temp
Light intensity
pH
DO
Soil texture
Turbidity
Biotic factors
the living components of an ecosystem like the organisms, their interactions, etc. (every organism in an ecosystem affects others and is affected by others)
Types of interaction
competition, predation, herbivory, parasitism, mutualism, disease
Competition
since resources are limited, species must compete for essentials such as food, water, space, light, and mates
- drives natural selection, population dynamics, and community structure
- 2 types: intraspecific and interspecific
Intraspecific Competition
members of the same species contend for resources and essentials
- when population numbers are small, there's little competition, plenty of resources, and population growth
- gulls compete for nesting sites and food
Result of intraspecific competition
as the population increases, there's more competition and resources become limiting factors, the population growth slows and stabilizes at the carrying capacities
- manifests in territoriality (organisms secure areas to get resources) and natural selection (better-adapted individuals are able to reproduce)
Interspecific Competition
members of different species contend for resources and essentials
- when niches overlap, both species use similar resources
- weed species overrun a garden, pushing out original domestic plants
Result of interspecific competition
the two species could either balance by dividing resources or occupying different areas OR one species could "win" and force the other species out (e.g. weeds beating nice plants in a yard)
- no two species can occupy the same niche in the same habitat
predator
a consumer that preys on animals
prey
the animals a predator eats
carnivores
consumers that eat other animals
Predation
predator kills and eats prey
- lynx hunts and eats hare
herbivore
consumers that eat plants
Herbivory
an animal (herbivore) eats green plants
- caterpillar feeds on milkweed leaves
parasite
live on or in living hosts and get their food from the hosts
Parasitism
a parasite lives in or on a host, getting food from it
- cuckoo lays eggs in warbler nest; warbler raises cuckoo chick
Mutualism
both species benefit from the relationship
- bacteria fix nitrogen for plant; plant supplies sugars
scavenger
mostly eat decaying biomass and are usually carnivores
Disease
pathogens cause disease, harming hosts
- virus kills rabbits; over time, both evolve toward stable coexistence
limiting factors
factors in an ecosystem that limit the population size, slowing growth as it reaches carrying capacity
- can be biotic or abiotic
carrying capacity (K)
the maximum number of a species that can be sustainability supported in an area
- determined by competition for limited resources
- fluctuates as conditions change
how humans have eliminated limiting factors
reduced natural predation
technological advances
agricultural revolution
broad and changing niche
density-dependent factors
decrease growth rate as population density increases (like negative feedback), pushes pop. back to K
competition: as a population grows, competition for limited resources intensifies
predation: dense populations are easier targets for predators
diseases and parasites: in crowded conditions, diseases spread more easily and deaths occur
waste accumulation: waste products can harm dense populations
density-independent factors
can impact populations the same way regardless of size
- extreme temperatures, wildfires, floods
j-curves
exponential growth, has no limiting factors (J on a graph)
"Boom and bust" because the population grows exponentially and then collapses suddenly (called a dieback)
S-curves
logistic growth, has limiting factors (S on a graph)
- although S-curves are closer to reality, j and S-curves are both idealized, there could be a lot more population fluctuation around the carrying capacity
environmental resistance
the area between what could be exponential growth and the S-curve
keystone species
A species that influences the survival of many other species in an ecosystem
sampling assumptions
the sample is representative of the whole population
enough samples are taken for accuracy
sampling is unbiased (random, not selective)
sampling for non-mobile organisms
do percentage cover or percentage frequency
Percentage cover
estimates the proportion of the ground area covered by a species
- used when individuals are too numerous to count (e.g. grasses, mosses)
Percentage frequency
measures how often a species appears in sample plots
- indicates distribution rather than exact density
Transects
samples taken at fixed intervals and set up along an environmental gradient
Line transect
measured line is randomly placed across the area in the direction of an environmental gradient; all species touching the line are recorded
- presence/absence along line
Belt transects
transect line is laid out and a quadrant is placed at each survey interval, samples are identified and abundance is estimated
- slow moving animals (limpets, barnacles, snails) are collected, identified, then released
- plants an percent coverage is estimated
Quadrats
counts all individuals within a small frame, used for population density
1. Randomly place quadrats in the study area
2. Count all individuals of each species
3. Calculate population density (N/m²)
considerations for quadrats
Larger quadrats → broader coverage, but less precision
Smaller quadrats → more precision, but may not represent area well
Always think about organism size and total area when deciding quadrat number and size
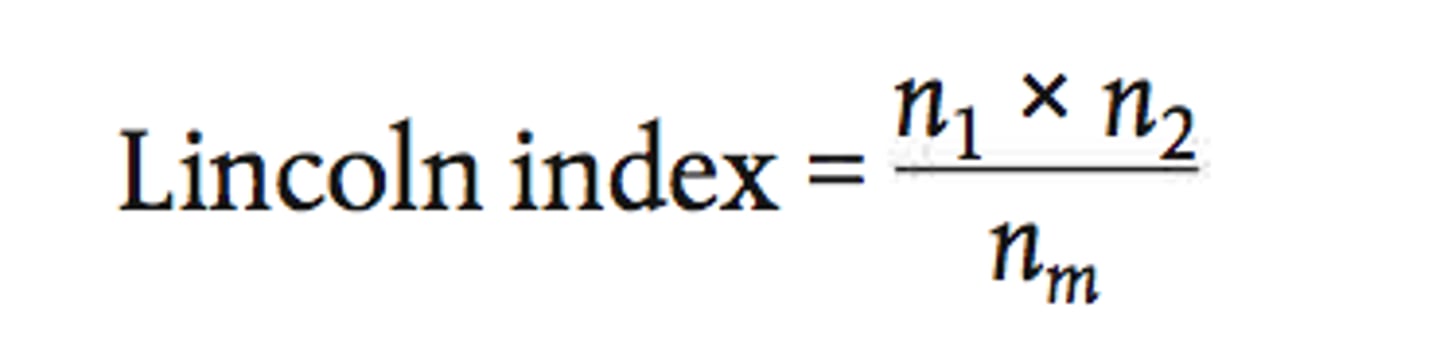
Lincoln Index
n1 = number caught and marked first sample
n2 = number caught second sample
nm = number marked on second sample
Assumptions of Lincoln Index
the population of organisms must be closed, with no exchanges w/ outside populations
the time between samples must be small compared to the life span
the marked organisms mix completely with the rest
equal chance of capturing marked and unmarked individuals upon second capturing
sources of error for the Lincoln Index
emigration & immigration
natural disaster or disturbance
"trap happy" (free shelter and food yay let's go get captured)
"trap shy" (scary scary people run away)
organisms did not have enough time to mix
animals lost their marks
habitat
the location in which a community, species, population or organism lives
Planetary boundaries
human activity has pushed biosphere integrity past safe limits
evidence: extinction rates far above natural background levels
First law of thermodynamics
the principle of conservation of energy: as energy flows through ecosystems, it can be transformed from one form to another but cannot be created or destroyed; the total energy in any isolated system is constant
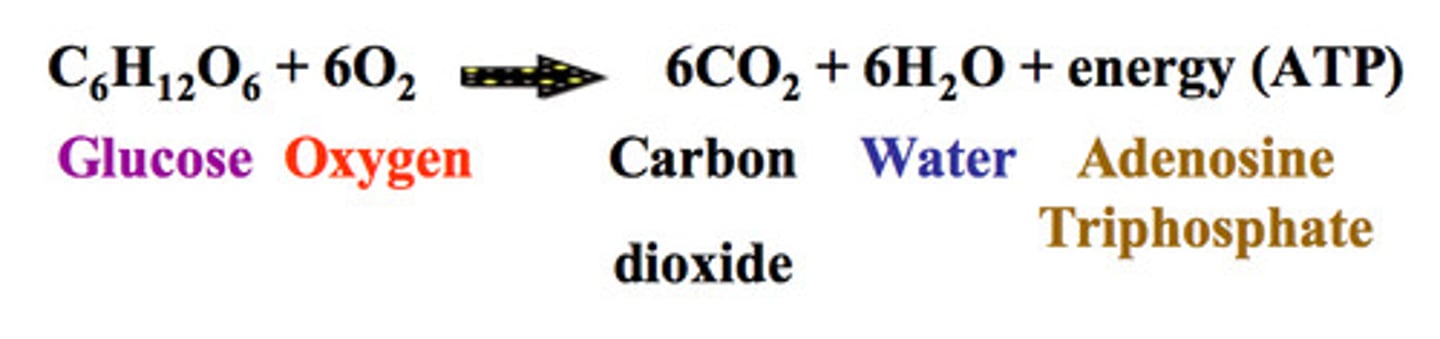
cellular respiration
the process by which glucose is broken down to release energy for living processes
- needed to release energy for living processes
- all organisms respire, even autotrophs
entropy
a measure of the disorder of a system
- much energy produced in respiration is heat energy, cannot be transformed back into chemical energy and is lost
living processes
MRS GREN (movement, respiration, sensitivity, growth, reproduction, excretion, and nutrition)
Photosynthesis
the process by which organisms make their own food from water and carbon dioxide using energy from sunlight
- produces the raw material for making biomass; animals are totally dependent on the chemicals produced by plants
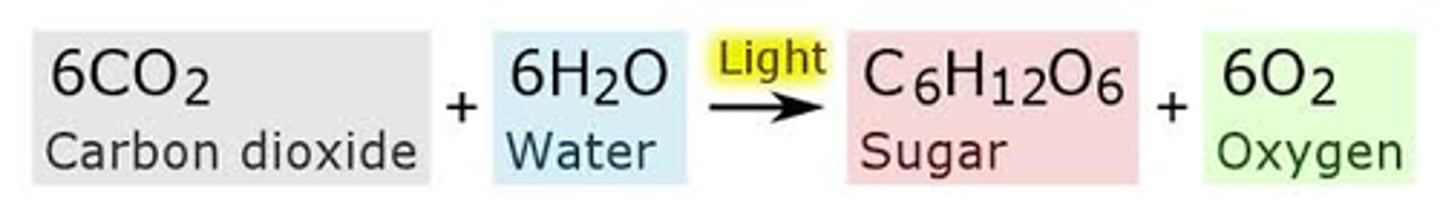
processes for photosynthesis
- in chloroplasts, the energy of sunlight is used to split water and combine it with carbon dioxide to make food (glucose)
- water reaches the leaves of plants from the roots by transpiration
- the byproduct of photosynthesis is oxygen, which is used in aerobic respiration
compensation point
when all the carbon dioxide that plants produce in respiration is used up in photosynthesis, the rates of respiration and photosynthesis are equal and there is no net release of either oxygen or carbon dioxide
producer
makes its own food by photosynthesis
photoautotroph
does photosynthesis, gets energy from light
heterotroph
organism that obtains energy from the foods it consumes
consumer
gains its food from other organisms
herbivore
carnivore
omnivore
saprotroph
an organism that feeds on dead organic material
- decomposers and detritivores
decomposer
external digesters, releases enzymes to break down dead organic matter
- bacteria and fungi
detritivore
organism that feeds on plant and animal remains and other dead matter
- snails, slugs, maggots, vultures
trophic level
the position that an organism occupies in a food chain, or a group of organisms in a community that occupy the same position in food chains
second law of thermodynamics
as energy is transferred or transformed in a system, it is degraded to a less useful form of energy such as heat energy and entropy increases
efficiency
the useful energy or work produced by a process divided by the amount of energy consumed during the process
efficiency of transfer between two trophic levels =
amount of biomass transferred / amount of biomass available * 100
Energy =
Work + Heat
rule of 10
only about 10% of energy is transferred from one trophic level to the next
- greater losses at higher trophic levels due to more energy used for life processes/survival
reasons for inefficiencies in transfers of energy between trophic levels
not everything is eaten
digestion is inefficient
heat is lost in respiration
some energy assimilated is used in reproduction and other life processes
gross productivity (GP)
the total gain in biomass by an organism
net productivity (NP)
the amount of energy remaining after losses due to cellular respiration
- this goes into biomass
NPP (net primary productivity)
= GPP - R (respiratory loss)
- this accounts for respiratory loss
NSP (net second productivity)
= GSP - R
maximum sustainable yield
the net productivity of any organism or trophic level is that can be harvested without diminishing the availability for the future
biomass
the quantity of dry organic material in an organism, population, or particular trophic level in an ecosystem
= mass of each individual x number of individuals
determining biomass
measure dry mass (units are g m^-2 or Mg ha^-1)
- Water is a main component and can be removed through drying (lots of water weight)
Ecological pyramids
graphical models of the quantitative differences between amounts of living material stored at each trophic level of a food chain
pyramid of numbers
shows the number of organisms at each trophic level in a food chain at one time (standing crop)
advantages of pyramids of numbers
- simple, easy method of giving an overview
- good for comparing changes in population numbers with time or season
disadvantages of pyramids of numbers
- all organisms are included, regardless of their size, so a pyramid based on an oak tree is inverted
- doesn't allow for juveniles or immature forms
- numbers can be too great to represent accurately
pyramid of biomass
contains the biomass at each trophic level
- exception: phytoplankton, since they reproduce fast but are only available in small amounts at any one time
advantages of pyramids of biomass
overcome some of the problems of pyramids of numbers
disadvantages of pyramids of biomass
- only use samples from populations, so impossible to measure biomass exactly
- organisms must be killed to measure dry mass
- time of year at which biomass is measured affects the result
pyramid of energy (productivity)
shows the rate of flow of energy or biomass through each trophic level, shows it being generated and available as food to the next trophic level during a fixed period of time
productivity
rates of flow, whereas biomass values are stores existing at one particular time
advantages of pyramids of energy
- allow for rate of production over time
- allow comparison of different ecosystems
- can add solar radiation input
- never have inverted pyramids of energy
disadvantages of pyramids of energy
- need to measure growth and reproduction over time
- still have issues of consumers at more than one trophic level and where to put decomposers and detritivores
biocides
substances or microorganisms that destroy, deter or render harmless living things
bioaccumulation
the buildup of nonbiodegradable pollutants within an organism or trophic level because they cannot be broken down
biomagnification
the increasing concentration of non-biodegradable pollutants along a food chain
- bioaccumulation causes biomagnification*, decrease in biomass and energy means more concentrated at the top
pesticides
chemicals that kill pests, may also kill non-target organisms
human activity's effects on ecosystems
- biomass is lost to ecosystems when we build on land, grow crops, and cut down trees
- deforestation means less photosynthesis so less of the sun's energy is captured and turned into chemical energy
- solar farms can capture some sun energy but efficiency is about 20% at best