chm317 spectroscopy unit
1/10
There's no tags or description
Looks like no tags are added yet.
Name | Mastery | Learn | Test | Matching | Spaced | Call with Kai |
|---|
No analytics yet
Send a link to your students to track their progress
11 Terms
spectroscopy
is based on light-matter interactions
energy + intensity of light absorbed, emitted, or scattered —> shows the set of allowed states —> helps identify matter + amount
absorbance spectroscopy
useful for both atomic + molec identification (using spectra)
and for quantitation (using Beer’s law) bc matter gains energy due to electronic and/or vib. absorptions - amount of light absorbed proportional to the concentration
how can absorbance spec be classified + what happens in UV-vis/elec spec vs. IR/vib spec
absorbance spec can be classified by range of EM spectrum used or type of resonant transitions occurring
UV-vis/electronic spectroscopy uses UV/vis radiation to resonantly excite electronic transitions, changing electron occupancy in molecular orbitals and therefore corresponding electronic states
eg, when Na absorbs photons, there is a 3s to 3p transition, and electronic state changes from D0 to D1
eg, Rhodamine B absorbs photons, HOMO to LUMO transition, electronic state changes from S0 to S1
IR/vib. spectroscopy uses lower E light to resonantly excite vibrational and rotational (nuclear) motions in molecules
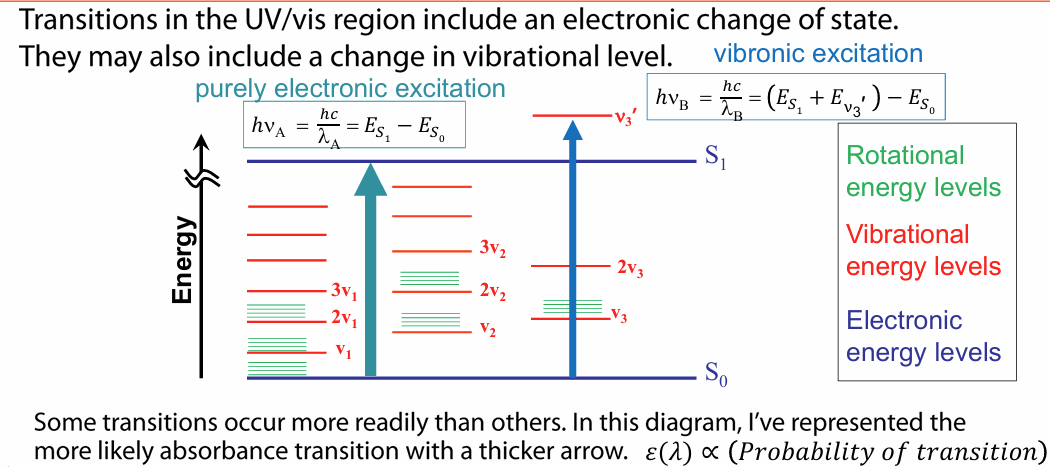
UV/vis absorbance transitions
recall: UV/vis transitions involve change in electron occupancy in molecular orbitals and therefore electronic state changes (electronic excitation)
transitions may also include change in vibrational levels (vibronic excitation)
molar absorptivity ε(λ) is a measure of how strongly a compound absorbs light at a given wavelength —> this is proportional to the probability of transition (how likely electronic transition occurs)
IR absorbance transitions
vibronic transitions are lower in E than electronic transitions
energy changes in matter occur due to vib transitions in the IR region
eg, bond stretching, bending, scissoring, etc.
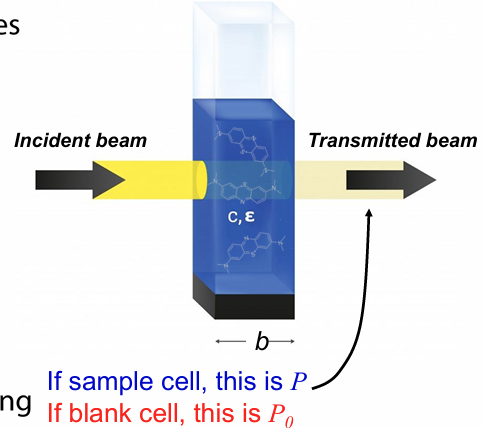
transmittance in absorbance spec
we track fraction of power lost as light passes through a sample
transmittance (T) = P/P0
power through sample cell over power through blank cell (containing only matrix) to account for phenomena that causes loss of power (like scattering)
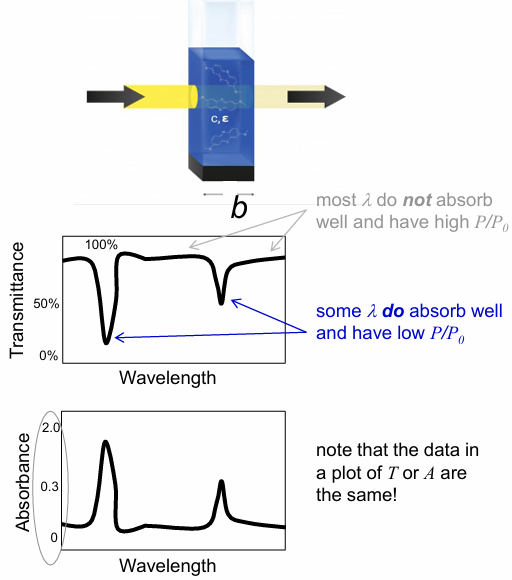
data often reported in absorbance (A)
A = -logT = -log(P/P0) = log(P0/P)
relationship between transmittance and absorbance
high T means most of the light passes through, which means low A
low T (P/P0) means little light passes through, which means high A
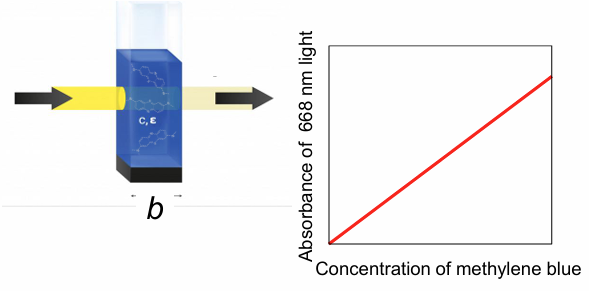
Beer-Lambert law - relationship between A, T, and concentration
A = log(P0/P) = εbc (molar absorptivity (L mol-1 cm-1) x path length of cuvette (cm) x concentration (M)
T = P/P0 = 10^-A = 10^-εbc
if sample has a well-defined path length, there is linear dependence of absorbance on concentration at a given wavelength, and we can quantify concentration (there are limitations though)
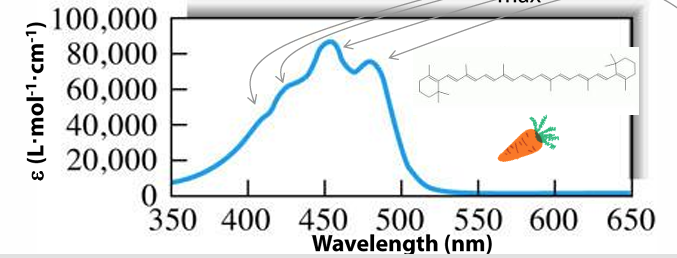
absorbance spectra
spectra shows probability matter will have lower E state to higher E state transitions upon photon absorption
good chromophores usually have ε(max) of 10^4 to 10^5 L mol-1 cm-1 at electronic/UV/vis absorbance maxima
spectral features / bands = possibly correspond to excitation from ground elec state to several different excited elec states (elec transitions) or to diff vib levels within an excited elec state (vibronic transitions)
limitations of absorbance spec for quantitation
range of linearity is limited (absorbance measurements work best between 10-4 to 2.0
Caveat 1: Beer-Lambert law is strictly true only for an infinitely narrow wavelength, but wavelengths selectors use a small range of wavelengths Δλeff, so if A isn’t constant over the bandwidth, the B-L relationship is non-linear
best to choose the narrowest bandwidth at wavelength of maximum A (λmax) that is ~constant with respect to λ
Caveat 2: interferences - if there are multiple absorbing species present, total absorbance is the sum of each species’ absorbance Aλ = ε1bc1 + ε2bc2 +… —> this is fine for atomic absorbance which have narrow peaks, but for molecular absorbance, there are many overlapping broad peaks (especially in higher E regions) that can affect quantitation
best to use separation methods (like HPLC before taking UV-Vis spectra) - usually done by selecting a wavelength common to analytes of interest so they can all be detected, but taking spectra over range of λ obtains more information
absorbance spec for trace analysis
not a good choice for trace analysis (< nM or ppb)
P0 and P may both be large which fine, but absorbance depends on the small diff b/w 2 large signals and noise may make small absorbance differences hard to measure, especially with small sample volumes that limits path length