Chapter 13: Consumption and Saving
1/72
There's no tags or description
Looks like no tags are added yet.
Name | Mastery | Learn | Test | Matching | Spaced |
|---|
No study sessions yet.
73 Terms
household spending on final goods and services
consumption
Spending on just about anything people buy in their personal lives (Food, clothes, medical bills, cars, internet services, rent, electricity, etc.)
consumption
the single largest component of GDP
consumption
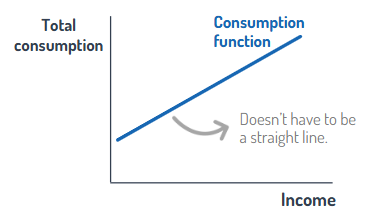
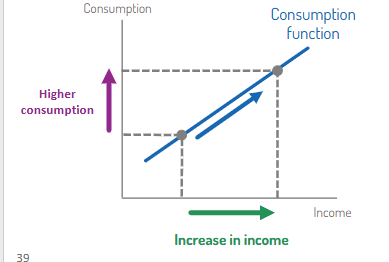
a curve plotting the level of consumption associated with each level of income
consumption function
more income leads to more
consumption
Draw the consumption function
y
the fraction of each extra dollar of income that households spend on consumption
Marginal propensity to consume
Marginal propensity to consume formula
Change in consumption/change in income
If you receive an additional $1,000 in income, and you spend all $1,000, then your marginal propensity to consume is
1
If you receive an additional $1,000 in income, and you spend $600, then your marginal propensity to consume is
0.6
Determines the slope of the consumption function
marginal propensity to consume
the portion of income that you don’t spend in a given period
saving
savings =
income - consumption
the excess amount you consume above your income in a given period that you therefore must pay for by either withdrawing money from your savings or borrowing money
dissaving
Also referred to as negative saving
dissaving
putting unspent income in the bank
saving
using your unspent income to pay down existing debt
saving
When you graduate and start paying your student loans out of your income, you are
saving
Borrowing money to fund the gap between your spending as a student and your income
dissaving
New saving, consumption, and income in a specific period of time are considered
flows
the amount by which your assets exceed your debts
net wealth
Consume more today if the marginal benefit of a dollar of consumption today is greater than (or equal to) the marginal benefit of spending a dollar plus interest in the future
rational rule for consumers
maintaining a steady or smooth path for your consumption spending over time
consumption smoothing
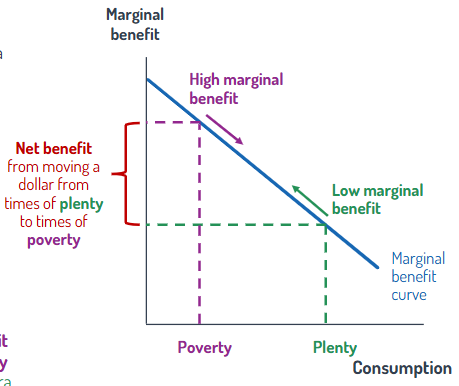
requires redistributing spending from times of plenty to times of poverty
consumption smoothing
the marginal benefit of an extra dollar during times of poverty (BLANK) the marginal benefit of an extra dollar during times of plenty
exceeds
Draw the marginal benefit curve
y
your best estimate of your long-term average income
permanent income
Measures the resources available for you to consume, on average, over the course of your lifetime
permanent income
A couple with a child applies for a home loan. Both are in graduate school, but close to finishing: While their current income is (BLANK), their permanent income is expected to be (BLANK)
low, high
the idea that consumption is driven by permanent income rather than current income
permanent income hypothesis
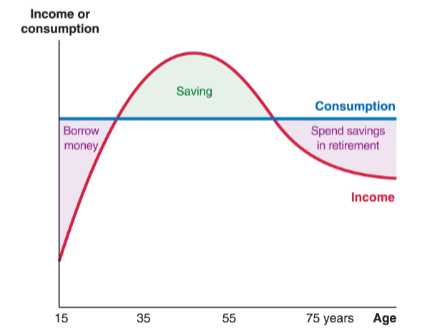
(BLANK) when your current income is below your permanent income
borrow (or dip into your savings)
(BLANK) whenever your current income exceeds your permanent income
save
Draw the income and saving over the typical life cycle
y
A temporary change in income leads to a (BLANK) change in consumption
small
A permanent change in income leads to a (BLANK) change in consumption
large
An anticipated change in income leads to (BLANK) change in consumption
no
News of a future rise in income leads to a (BLANK) change in consumption
large
It’s (BLANK) to forecast changes in consumption
hard
One-time signing bonus from a job
Monetary gift from a relative
One-time government payment
temporary change
You get a $10,000 gift from a relative, and decide to spend an additional $1,000 over the next 10 years. Your temporary Marginal Propensity to Consume is
0.1
Your new job unexpectedly pays $20,000 a year more than your old job
permanent change
Your new job unexpectedly pays $20,000 a year more than your old job. What is the permanent Marginal Propensity to Consume?
1
April through October you earn $70,000, but only $20,000 from small projects the rest of the year
anticipated change
If your company unexpectedly tells employees about company-wide plans for layoffs next month, then you immediately start cutting back on your consumption today
learning about future income changes
Changes in macroeconomic policy begin to affect consumption from the moment the policy is (BLANK), rather than when the policy is implemented
announced
Changes in consumption are driven by reactions to
unexpected news
limits on how much you can borrow
credit constraints
spend their income as they receive it
hand-to-mouth consumers
the marginal propensity to consume of hand-to-mouth consumers is
1
Hand-to-mouth consumers (BLANK) smooth consumption
don’t
Hand-to-mouth consumers’ consumption reflects their (BLANK) rather than their permanent income
current income
A temporary change in income for hand-to-mouth consumers leads to a (BLANK) change in consumption
large
A permanent change in income for hand-to-mouth consumers leads to a (BLANK) change in consumption
large
An anticipated change in income for hand-to-mouth consumers leads to a (BLANK) change in consumption
large
Learning about a future change in income for hand-to-mouth consumers leads to a (BLANK) change in consumption
no
Forecasting changes in consumption depends on the share of
hand-to-mouth consumers
An increase in income leads to
higher consumption
The four factors that shift the consumption curve:
1. Real interest rates
2. Expectations
3. Taxes
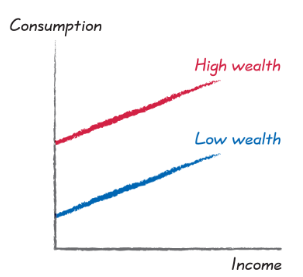
4. Wealth
A shift in the consumption curve does not change
income
Draw consumption curve
y
High real interest rates (BLANK) current consumption
reduce
Draw if interest rates are low and if they are high on a consumption graph
y
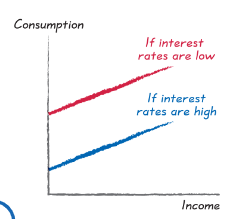
a high real interest rate boosts income for lenders, but decreases income for borrowers
income effect
Draw optimistic about future income vs. pessimistic about future income on the consumption curve
y
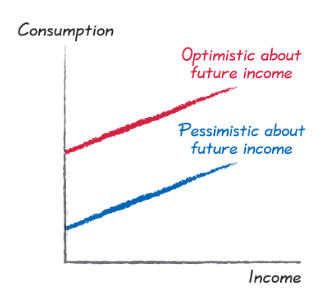
Optimistic about future economic growth translates into (BLANK) consumption
higher
Pessimistic about future economic growth translates into (BLANK) consumption
lower
your after-tax income
disposable income
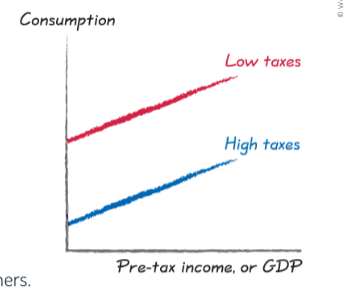
Tax cuts translate into (BLANK) consumption
higher
Higher taxes translate into (BLANK) consumption
lower
Draw low taxes vs. high taxes on consumption curve
y
Greater wealth translates into (BLANK) consumption
higher
Lower wealth translates into (BLANK) consumption
lower
Draw high wealth vs low wealth on the consumption curve
y
