Aggregate supply
1/9
There's no tags or description
Looks like no tags are added yet.
Name | Mastery | Learn | Test | Matching | Spaced | Call with Kai |
|---|
No analytics yet
Send a link to your students to track their progress
10 Terms
Definition
the total amount of goods and services that all industries in the economy will produce at every given price level
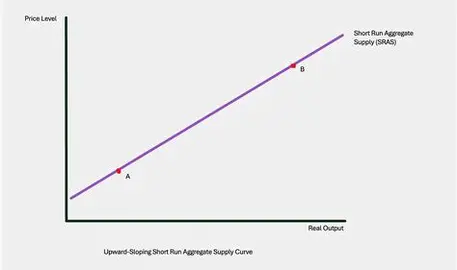
Diagram and why its upward sloping - SRAS
As price rises, firms make more profit while the nominal wages are fixed in the short run. Firms produce more to make more profit, causing the whole economy to produce more.
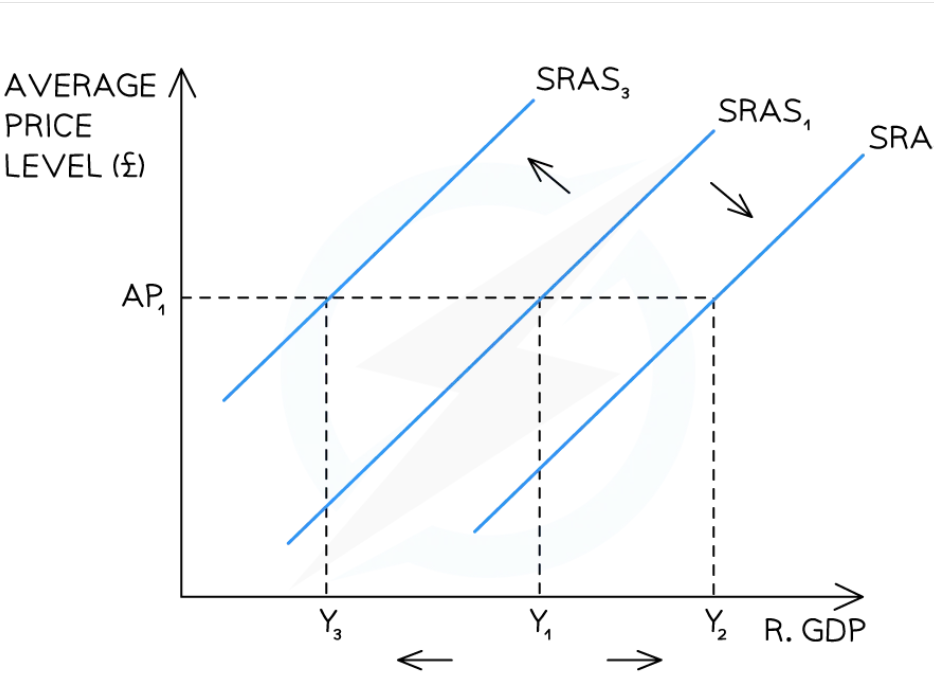
What causes shifts in SRAS
changes in resource prices - wages increase - inward shift, oil cost decreases, outward shift
taxes - increased taxes - increased costs - inward shift
supply shocks - hurricanes, floods - inward shift
SRAS shift diagram
1 FOP is fixed (land or capital)
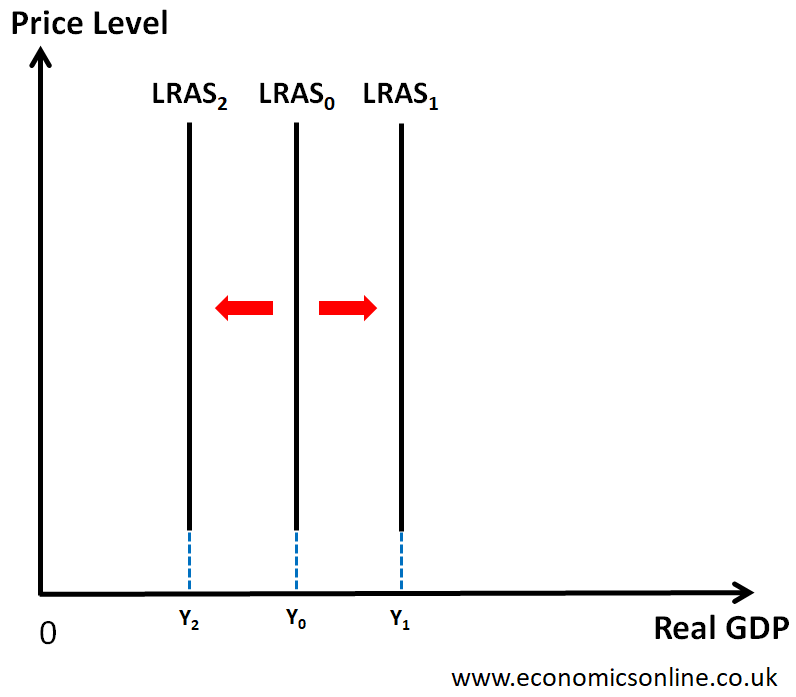
LRAS - classical vs Keynesian
Classical - perfectly inelastic
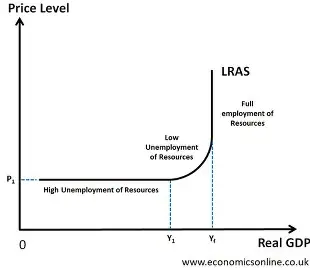
Keynesian - becomes inelastic at full employment YFE
increase and decrease in costs on SRAS
increased costs - leftward shift
decreased costs - rightward shift
Classical LRAS
Why is the LRAS perfectly inelastic
no unemployment of resources as markets will clear so firms provide the maximum at every price level
shows the productive capacity of the economy
Keynesian LRAS
Elastic - high levels of unused FOP like unemployment
Middle - FOP become scarce - higher costs lead to higher prices
Inelastic - Full employment of resources
Shifts in LRAS
represent economic growth
quality and quantity of FOP shifts curve
land - discovery of new resources - fertilisers
labour - increased birth rate and immigration - education and training
capital - investment - technological advancements