International Marketing Session 7
1/17
There's no tags or description
Looks like no tags are added yet.
Name | Mastery | Learn | Test | Matching | Spaced |
|---|
No study sessions yet.
18 Terms
Cross-cultural Equivalence
→ Measurement equivalence
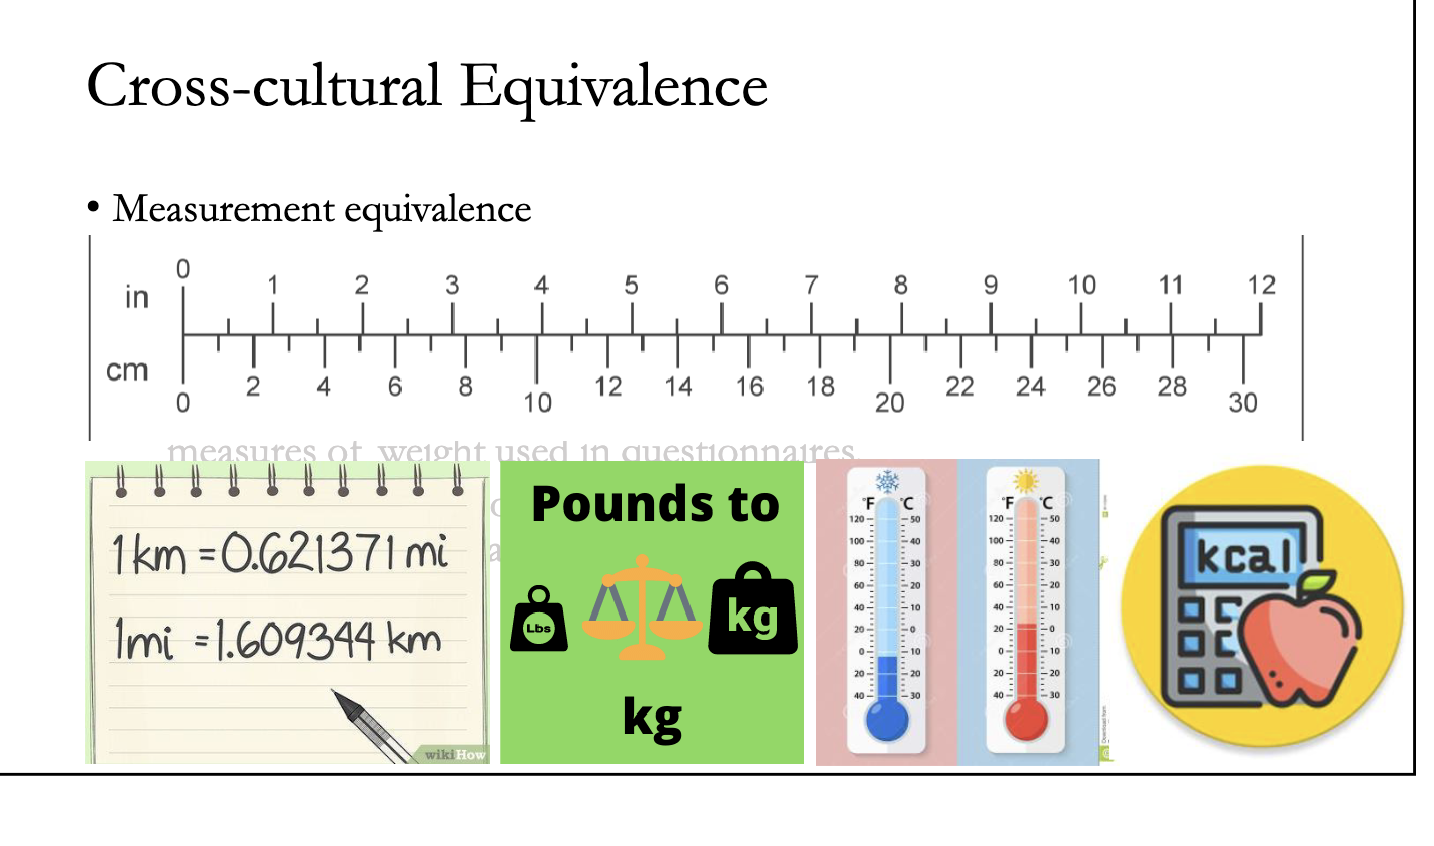
→ • Calibration: equivalence of units of measurement, for example, monetary units and measures of weight used in questionnaires.
1. The Big Picture The lecture continues the topic of "Equivalence" (making sure research works across countries). It specifically focuses on Measurement Equivalence, which is ensuring that the tools used to measure data are fair and accurate everywhere.
2. The Three Types Slide 4 breaks measurement equivalence into three parts, but this session focuses on the last two:
Translation: (Covered previously) Do the words mean the same thing?
Calibration: Do the units of measurement mean the same thing? (e.g., Money, Weight, Distance).
Metric: Do people use the scale the same way? (e.g., Do they tend to rate things 7/7 or 4/7?).
Calibration Equivalence (The "Units" Problem)
The Problem: Different Rulers The lecture picks up from the previous session on "Measurement Equivalence." Specifically, it focuses on Calibration Equivalence.
Definition: This refers to the units of measurement used in a survey.
The Issue: Different countries use different systems to measure reality. If you don't account for this, your data is useless.
Visual Examples:
Distance: Miles vs. Kilometers.
Weight: Pounds (Lbs) vs. Kilograms (Kg).
Temperature: Fahrenheit vs. Celsius.
Why it matters: If an American says it is "100 degrees" outside, they mean it is hot. If a European says it is "100 degrees," they mean they are dead (boiling point of water). You cannot compare the raw numbers .
Calibration Equivalence: Measuring Preferences (Conjoint Analysis)
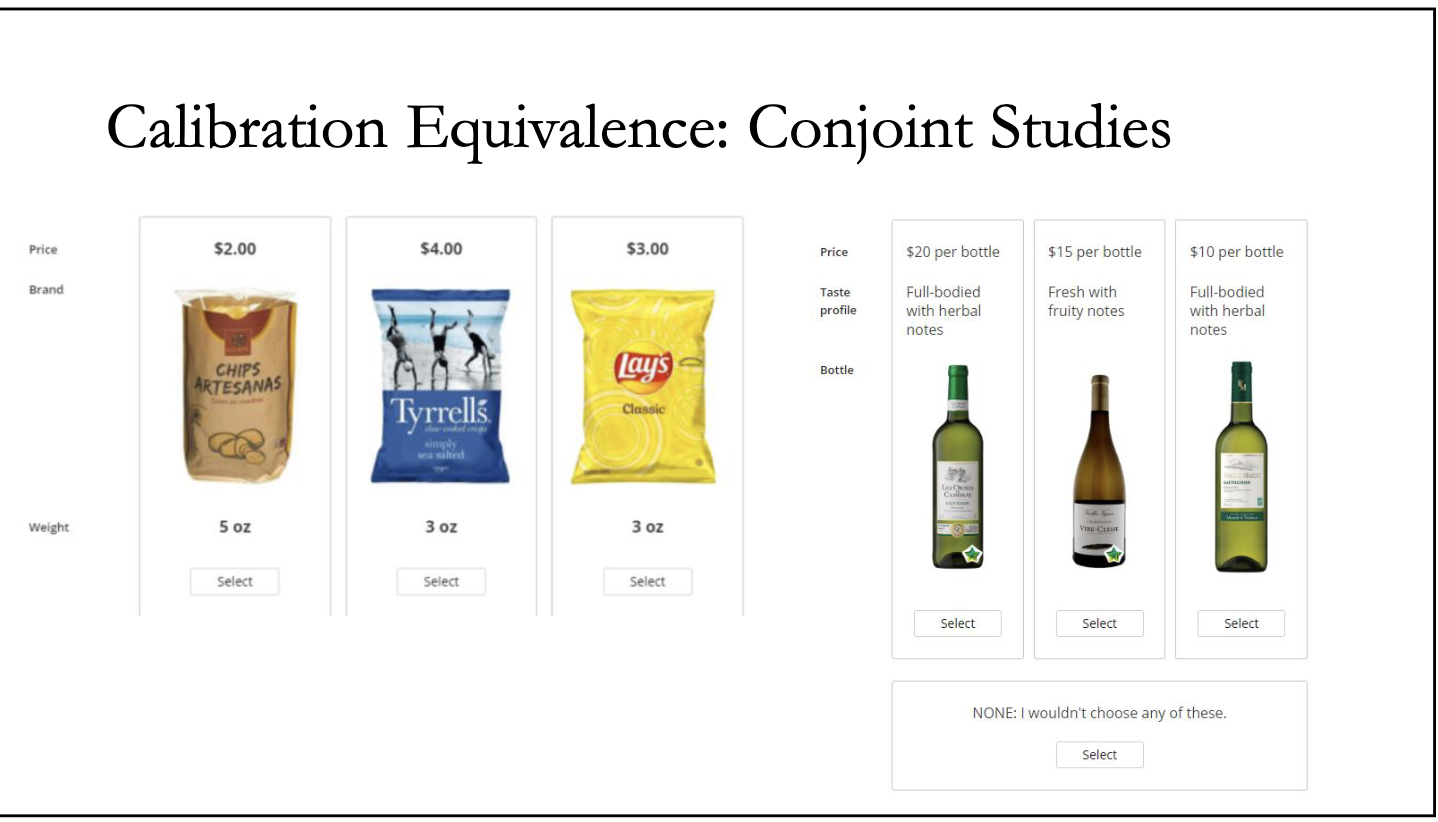
How do we test Calibration? To understand how consumers trade off different units (like money vs. weight), marketers use Conjoint Studies.
The Method: Instead of asking "Do you like chips?", you force the customer to choose between specific options (bundles).
The Examples:
Chips Scenario: The customer must choose between:
Option 1: $2.00 for 5 oz (Cheap & Big, but unknown brand).
Option 2: $4.00 for 3 oz (Expensive & Small, but premium brand "Tyrrells").
Option 3: $3.00 for 3 oz (Medium price, medium size, famous brand "Lays") .
Wine Scenario: The customer chooses between bottles priced at $20, $15, or $10 with different taste profiles .
The Goal: By seeing which "bundle" people pick, researchers figure out if the customer cares more about the Price Unit (Dollars) or the Weight Unit (Ounces).
The Psychology of Numbers (Numerosity)
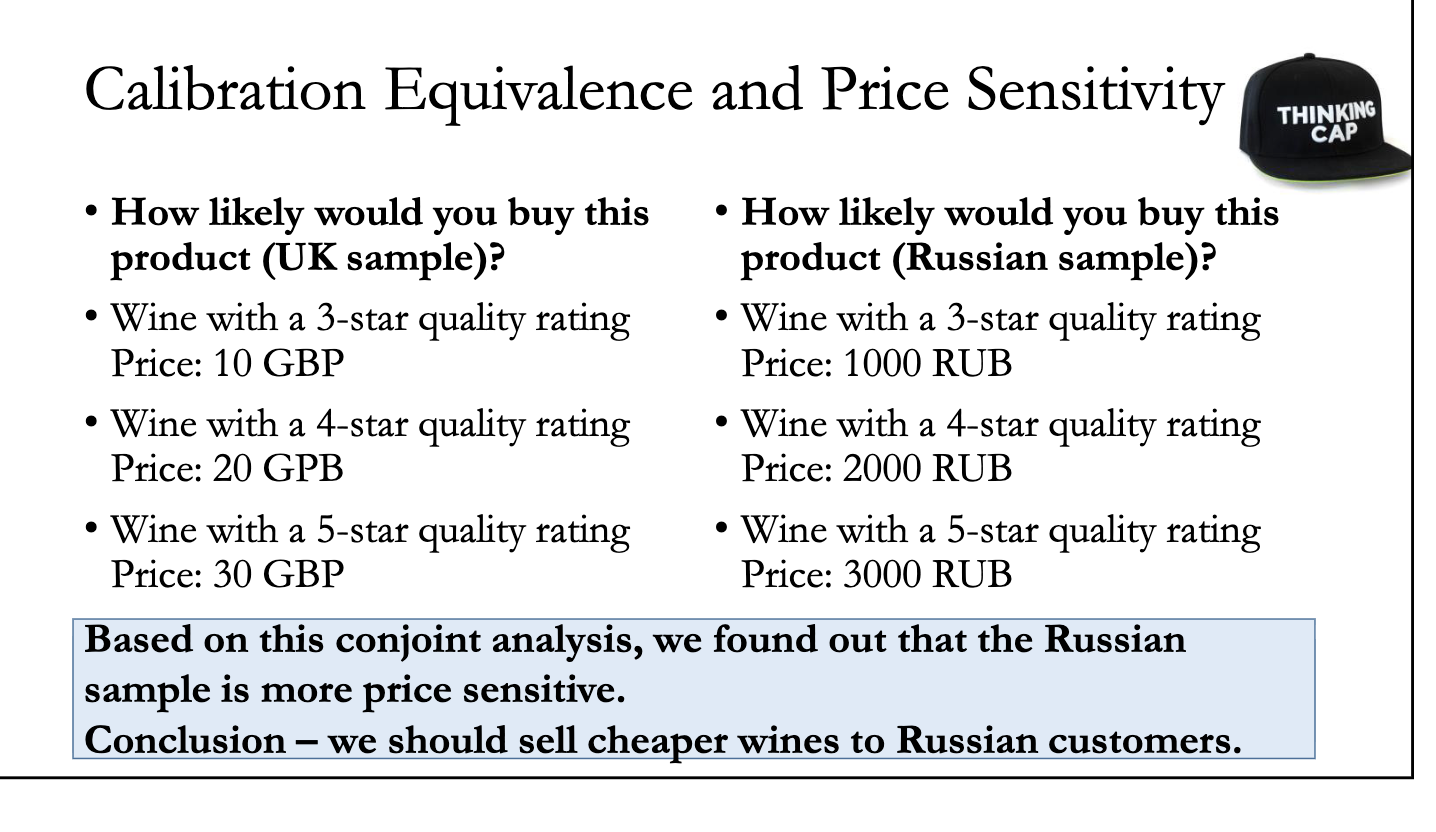
The "Expensive" Illusion (UK vs. Russia) Slide 7 presents a tricky research finding involving wine sales.
The Data:
UK Sample: Prices were listed as 10, 20, 30 (GBP).
Russian Sample: Prices were listed as 1000, 2000, 3000 (RUB).
The Result: The study found that Russians were more price sensitive (they didn't want to buy the expensive one).
The Question: Are Russians actually "cheaper" customers?
The Answer: Probably not. It is likely a calibration error. The numbers 1000/2000/3000 look psychologically "bigger" and more painful to spend than 10/20/30, even if the real value is similar .
The Numerosity Heuristic (The "More is Better" Trick) Slide 8 explains the psychological rule behind this: The Numerosity Heuristic.
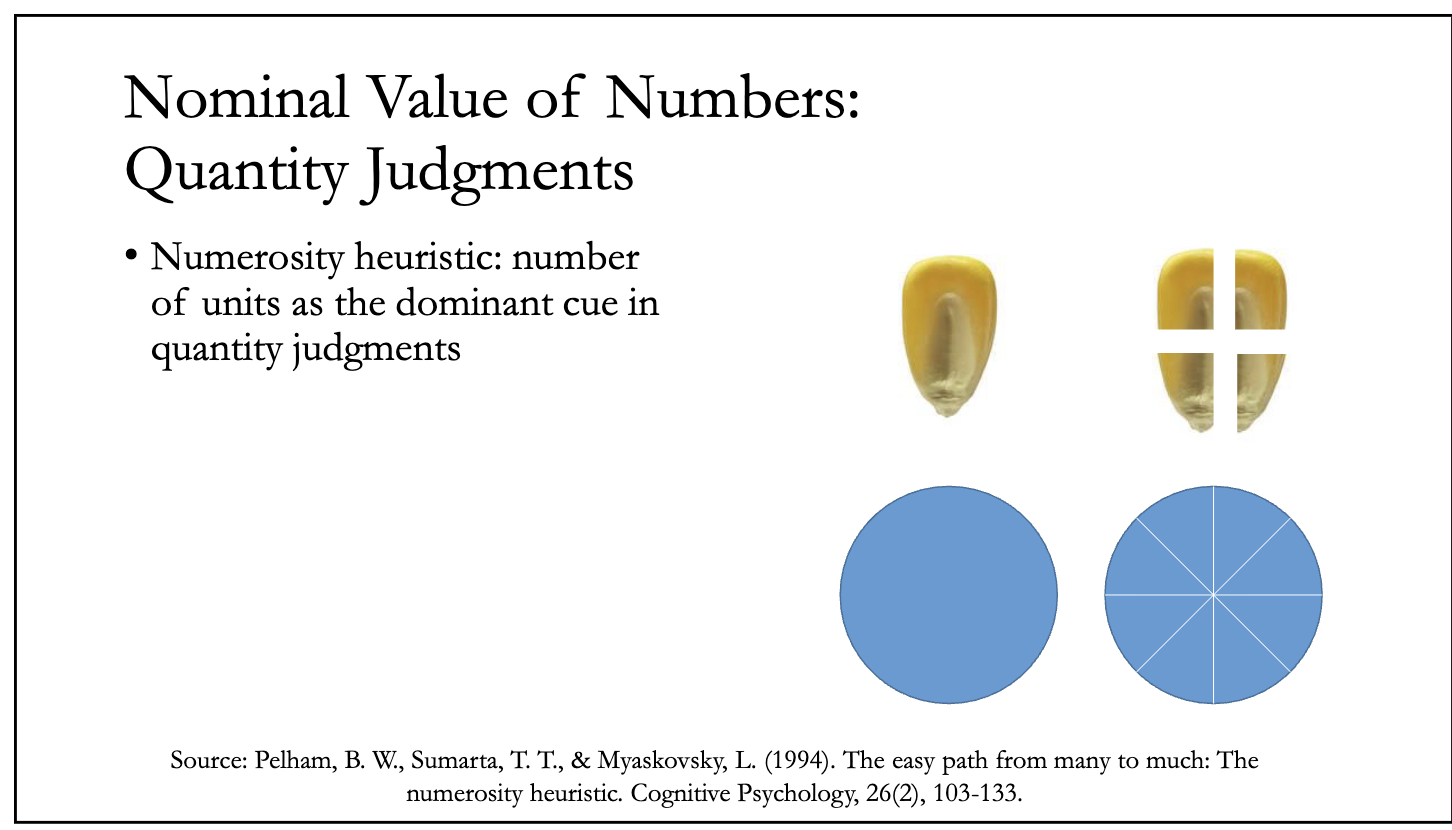
Definition: People judge "amount" based on the number of units, not the actual size.
Visual Example:
Corn: A pile of 4 corn kernels looks smaller than the same pile cut into 8 pieces.
Pizza: A pizza cut into many small slices looks like "more food" than the same pizza cut into a few big slices.
Marketing Lesson: If you want a price to look small, use a currency with low numbers (like Euros). If you want a discount to look big, use a currency with high numbers (like Yen or Rubles) .
Currency and Value Perception
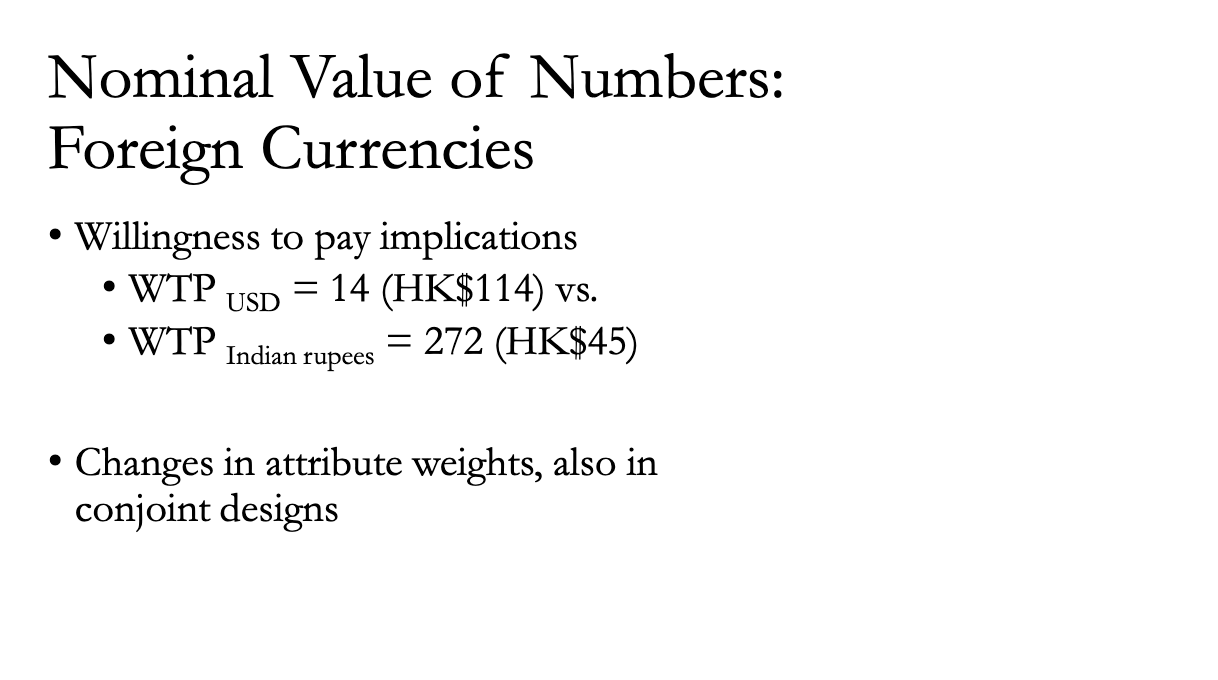
The Money Illusion Slide 9 proves that the "Face Value" (the number written on the price tag) changes how much people are willing to pay (WTP).
The Study: They compared people paying in US Dollars (USD) vs. Hong Kong Dollars (HKD).
The Finding: Even when the real value is identical, people react differently depending on whether the number looks small (14) or big (114) .
The Final Checklist (Takeaways):
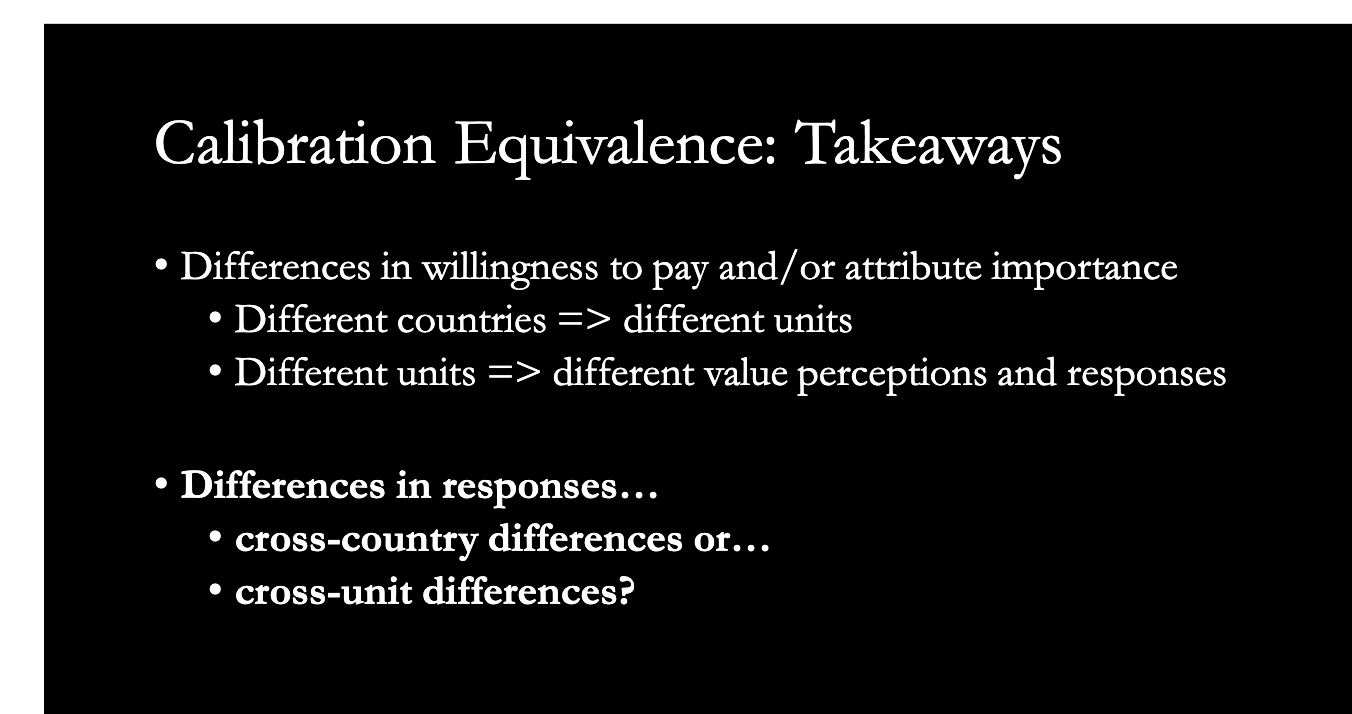
Slide 10 summarizes why Calibration Equivalence is critical for your exam or strategy. Before you say "Consumers in Country A are different from Country B," you must check:
Units: Are the units (kg vs lbs) different?
Perception: Does the currency size (10 vs 1000) trigger a psychological reaction (Numerosity)?
Conclusion: Differences in data might just be "Cross-unit differences," not real cultural differences .
Cross-cultural Equivalence
→ Measurement equivalence
→ • Metric: equivalence of scale or scoring procedure used for assessment
Metric Equivalence (The Ruler Problem)
(Page 6 / Slides 11–12)
1. What is Metric Equivalence? Metric Equivalence asks: “Does the scoring system mean the same thing to everyone?” Even if you translate the question perfectly and use the same currency units, people might still use the rating scale differently.
The Problem: If I give a movie a 7/10 and you give it a 7/10, do we like it the same amount? Maybe for me, a 7 is "Amazing," but for you, a 7 is just "Okay."
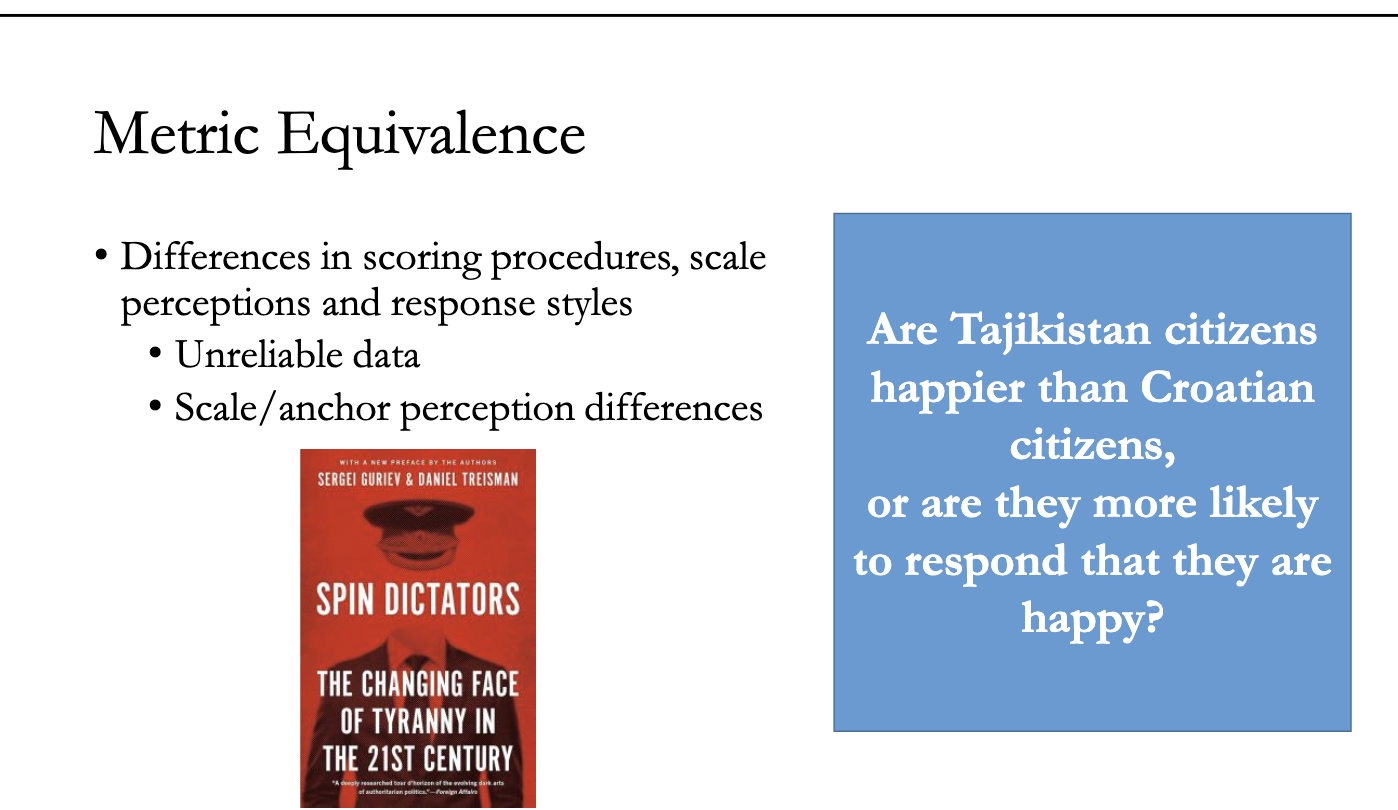
The Challenge of Unreliable Data The slide poses a critical question: “Are Tajikistan citizens happier than Croatian citizens, or are they just more likely to SAY they are happy?”
If one culture is naturally optimistic and another is cynical, comparing their happiness scores directly is dangerous. You might be measuring their response style, not their actual happiness
Scale Perception (How we see numbers)
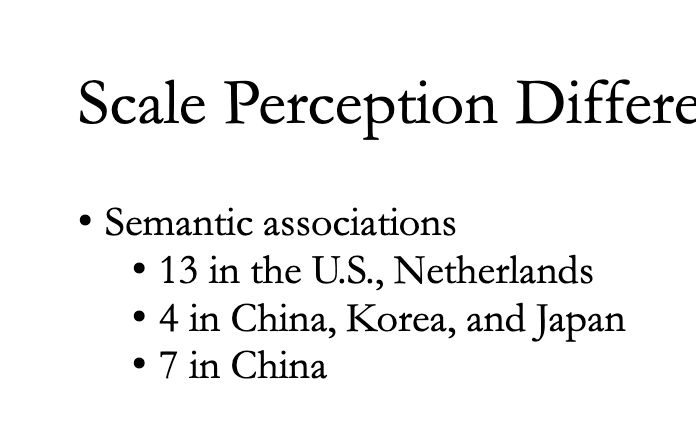
1. Semantic Associations (Lucky/Unlucky Numbers) Numbers have meaning beyond math.
USA / Netherlands: 13 is unlucky.
China/Japan/Korea: 4 is unlucky (sounds like "death").
China: 7 is lucky.
Implication: If your rating scale has 4 points or 7 points, cultural superstition might subtly influence which number people pick or avoid .
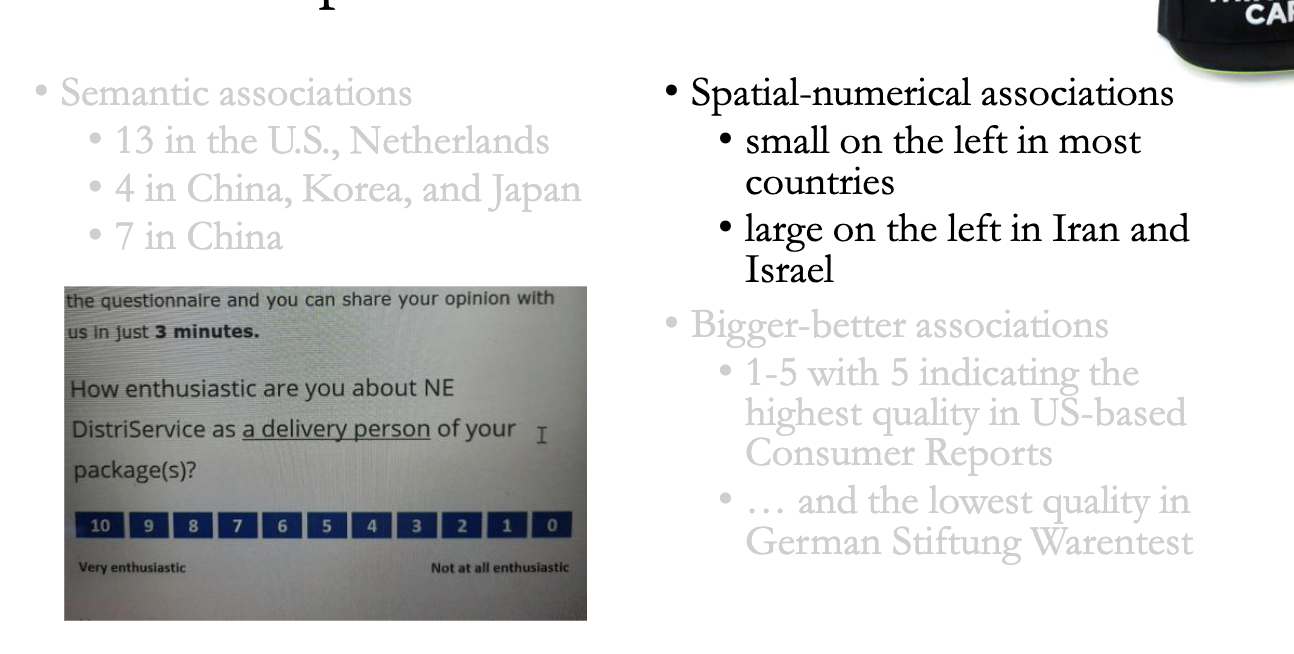
2. Spatial Associations (Left vs. Right) Where do the small numbers go?
Most Countries: Small numbers are on the Left (1 2 3 4 5).
Iran/Israel: Small numbers are on the Right (5 4 3 2 1) because they read right-to-left.
Implication: If you don't adjust the layout, people might accidentally tick "1" thinking it is the highest score .
3. "Bigger is Better" Associations
USA: A 5-star rating (5/5) is the best.
Germany: In school grading and some systems (like Stiftung Warentest), 1 is the best grade, and 5 is failure.
The Risk: An American sees a "1" and thinks "Terrible." A German sees a "1" and might think "Excellent" .
The German vs. American Case Study
The German vs. American Case Study
(Page 8 / Slides 15–16)
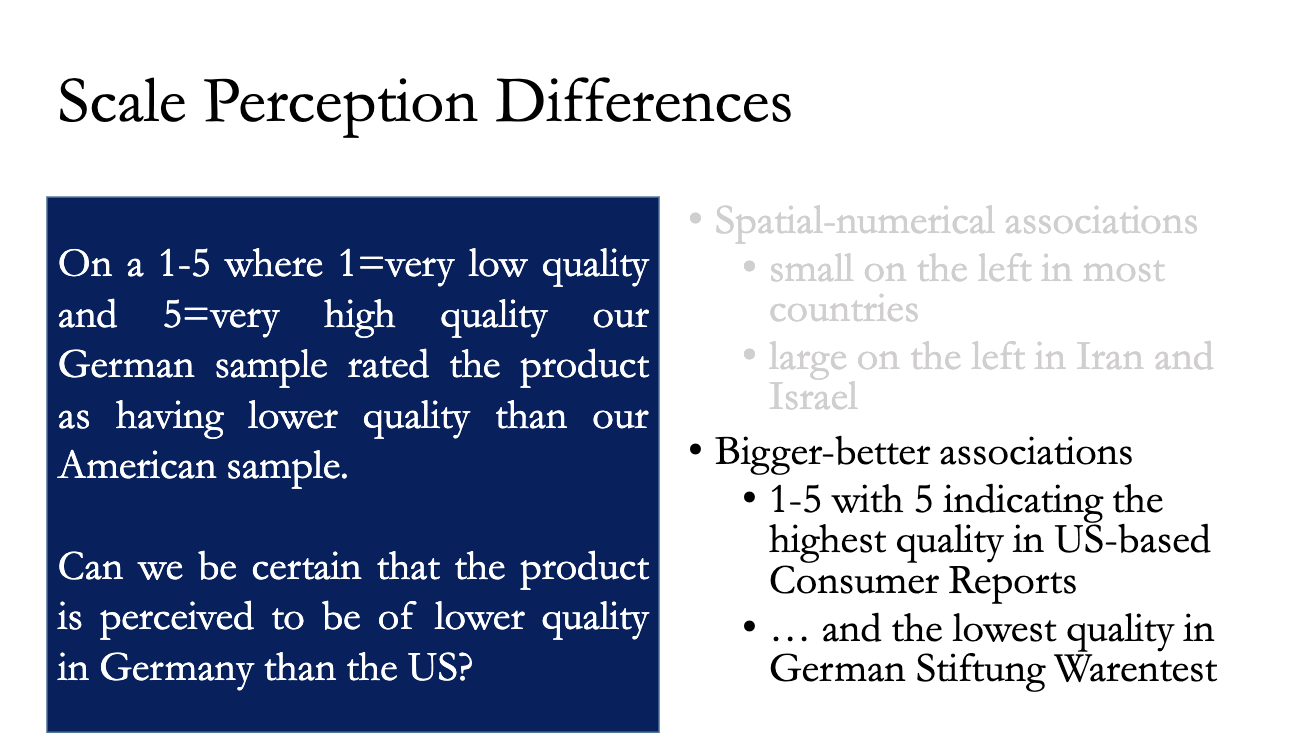
1. The Scenario
A company asked Germans and Americans to rate a product on a 1–5 scale ($1=$ Low Quality, $5=$ High Quality).
The Result: The German sample gave lower ratings than the American sample.
2. The Interpretation Trap
Wrong Conclusion: "Our product is failing in Germany. They hate it."
Alternative Conclusion: "Germans are just tougher graders." Or perhaps they were confused by the scale direction (since 1 often equals 'best' in Germany).
The Lesson: You cannot be certain the product is actually worse in Germany unless you check for
→ Scale Perception Differences first.
Response Styles (How people tick boxes)
Response Styles (How people tick boxes)
(Pages 8–9 / Slides 17–18)
People have "habits" when taking surveys. The lecture identifies four specific styles:
Acquiescence (The "Yes" Man):
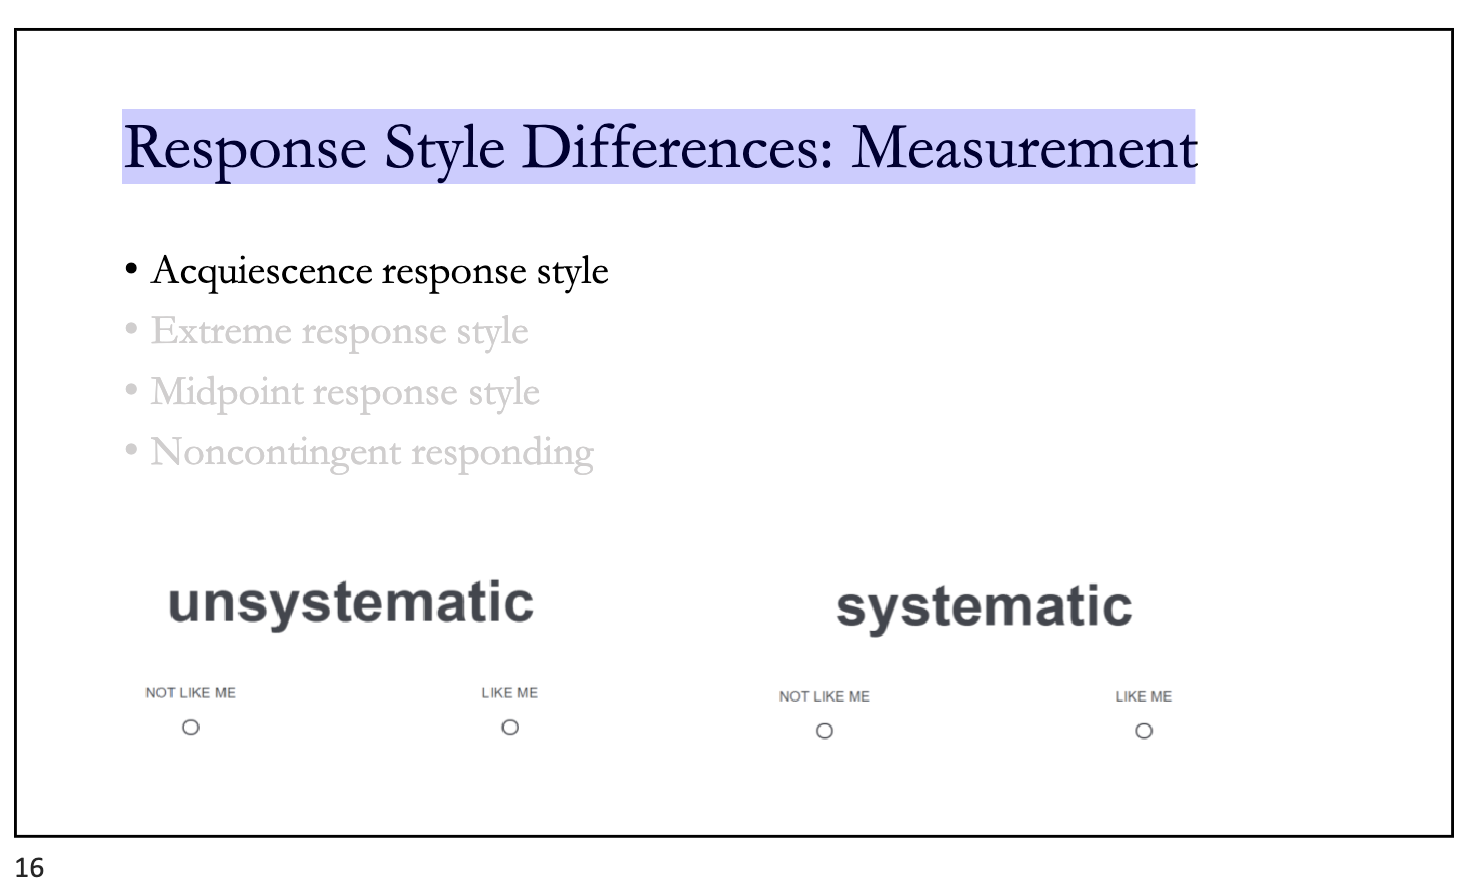
Tendency to agree with everything, regardless of the question content.
Measure: Do they agree with Statement A ("I love parties") and agree with its opposite Statement B ("I hate parties")?
Extreme Response Style (The Dramatic):
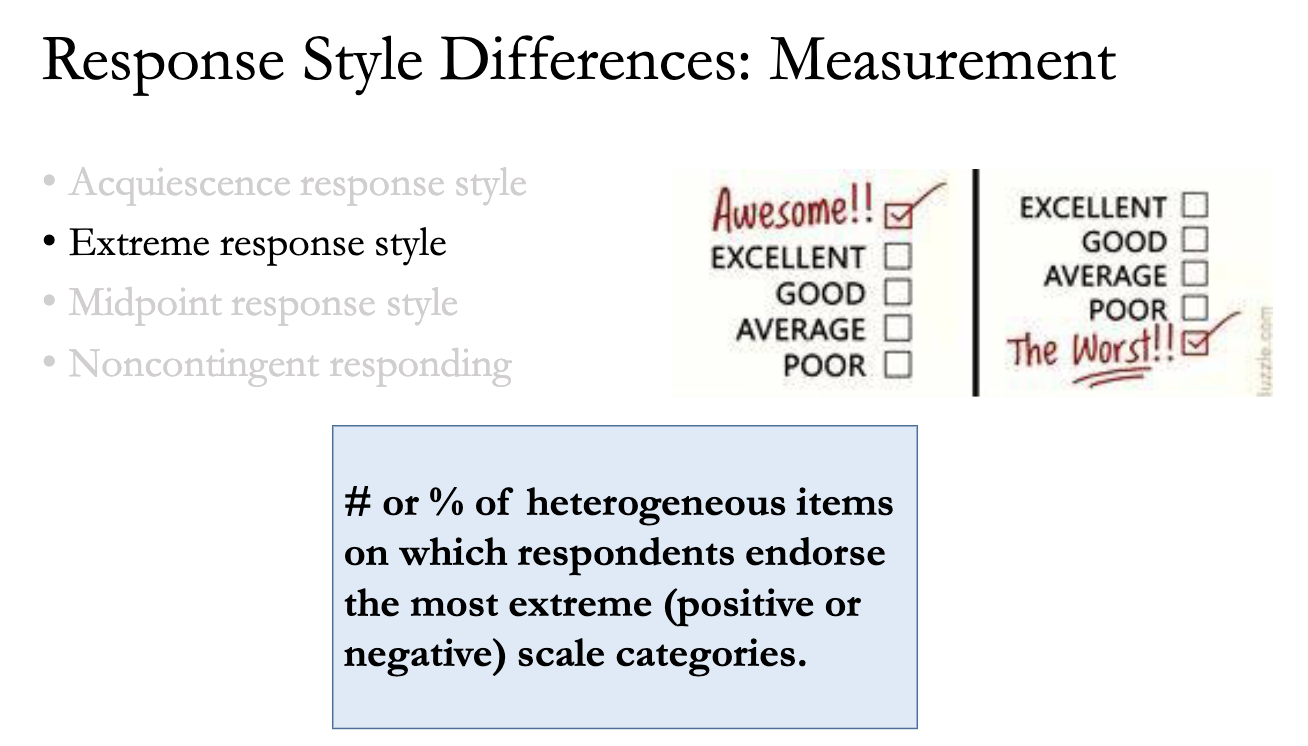
Tendency to always pick the endpoints (1 or 5). "Everything is either AMAZING or TERRIBLE."
Measure: Count how many times they pick the most extreme options.
Midpoint Response Style (The Neutral/Safe):
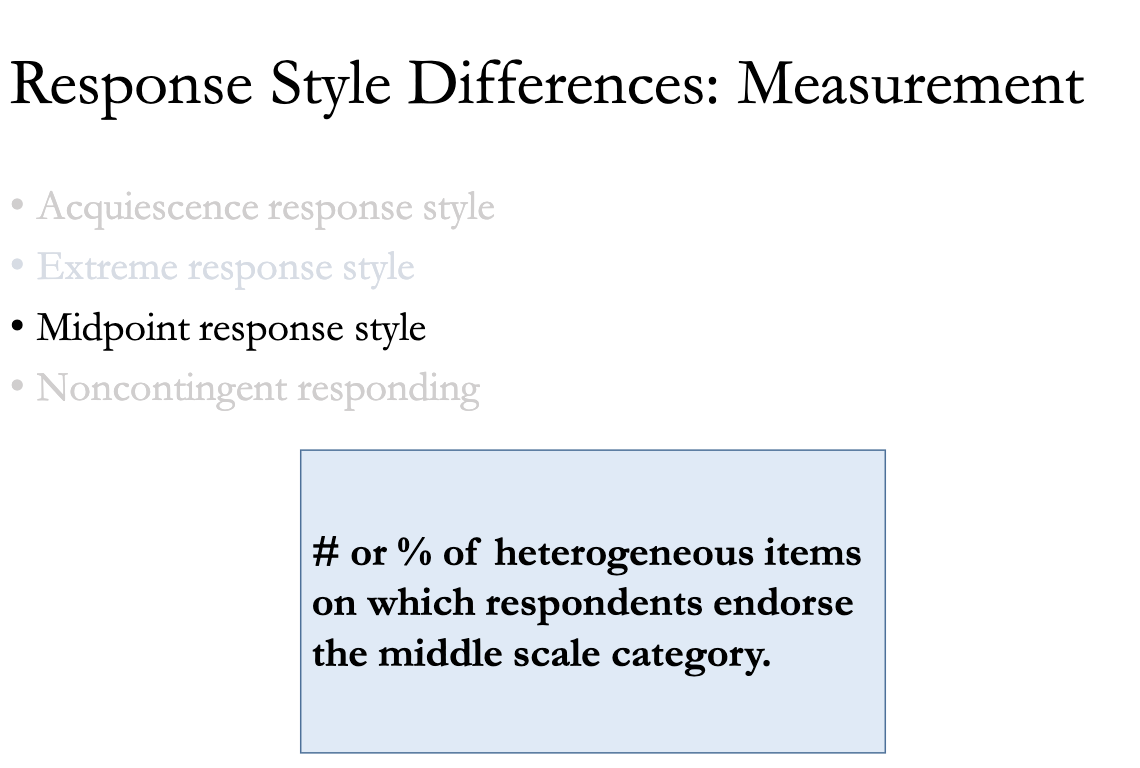
Tendency to hide in the middle (3). "I don't know," "Average," "Maybe."
Measure: Count how many times they pick the middle option.
Noncontingent Responding:
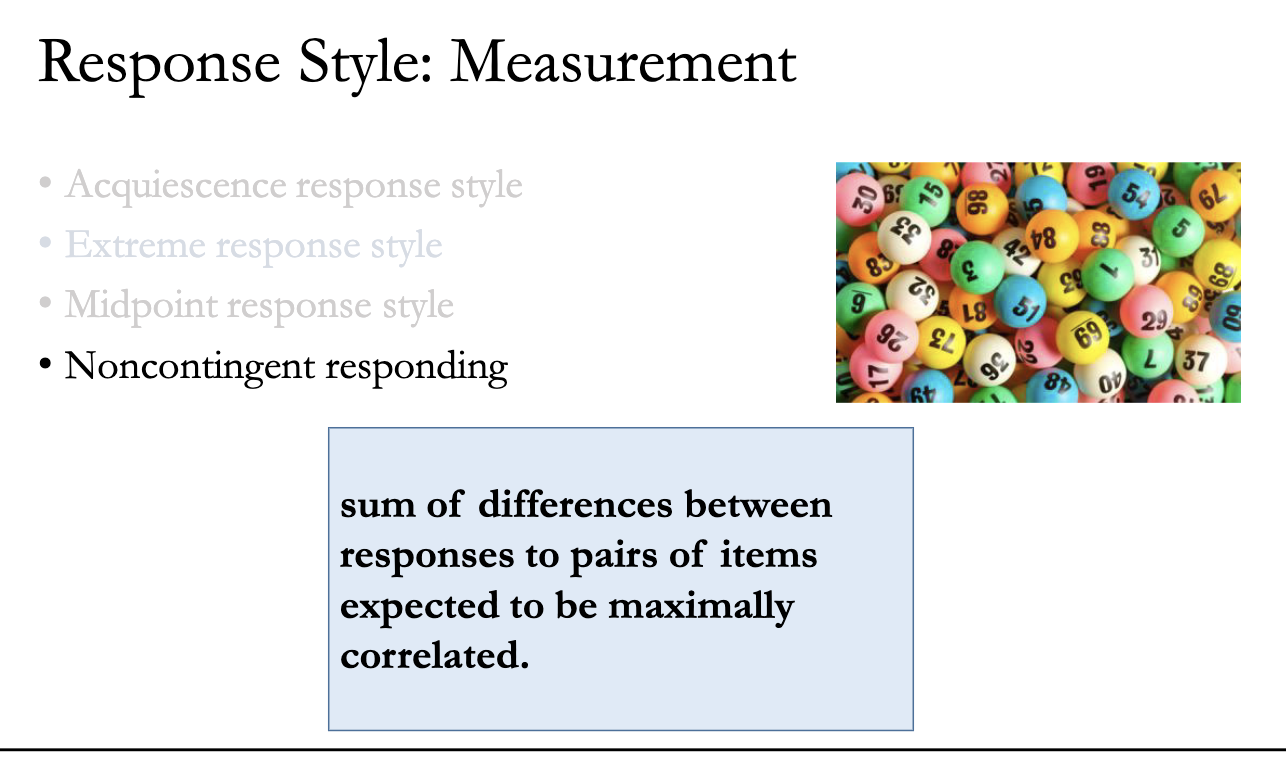
Answering randomly without reading.
What drives these styles? (The EU Study)
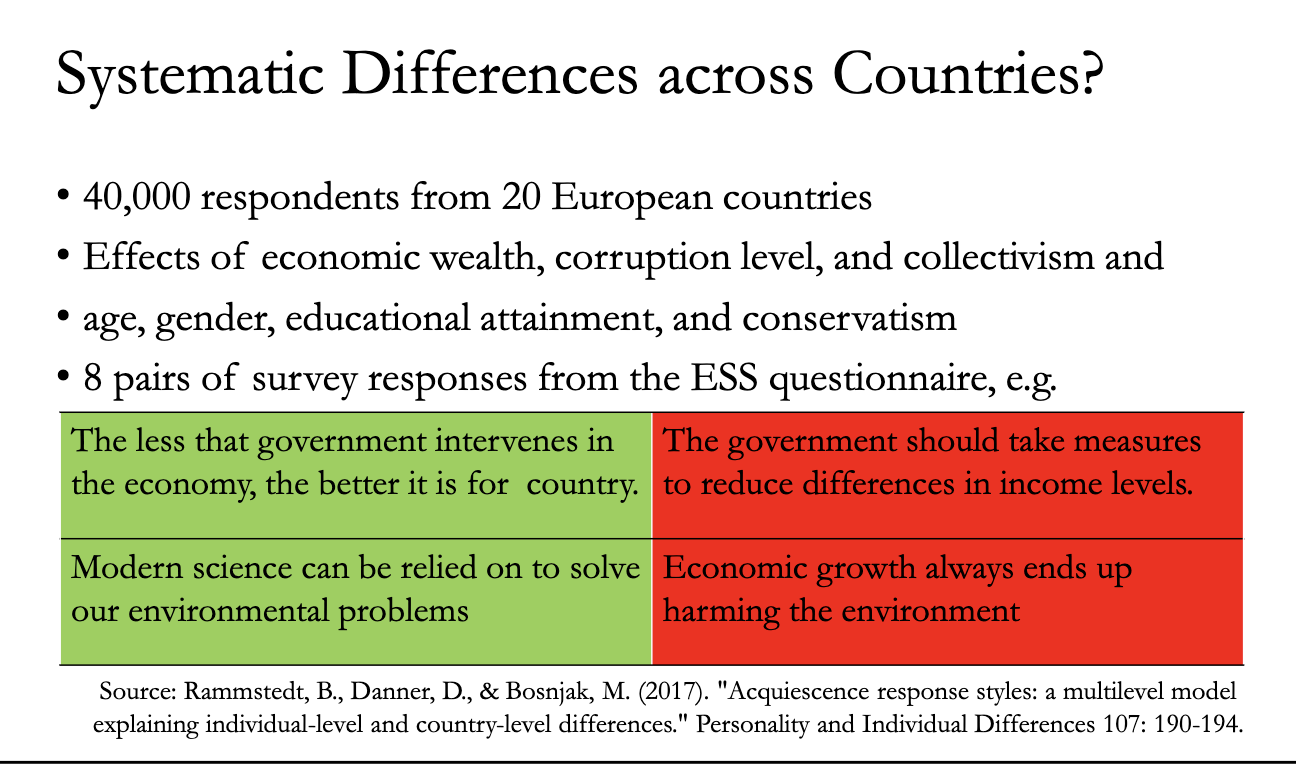
The Study Researchers looked at 40,000 people across 20 European countries to see who falls into these traps.
Who does what? (The Drivers) The findings show that culture and economics predict how people answer surveys.
Acquiescence (The "Yes" People):
Drivers: High Corruption and Collectivism.
Why? In corrupt or collectivist societies, it is safer to be agreeable and polite. You don't want to stand out or cause trouble by disagreeing.
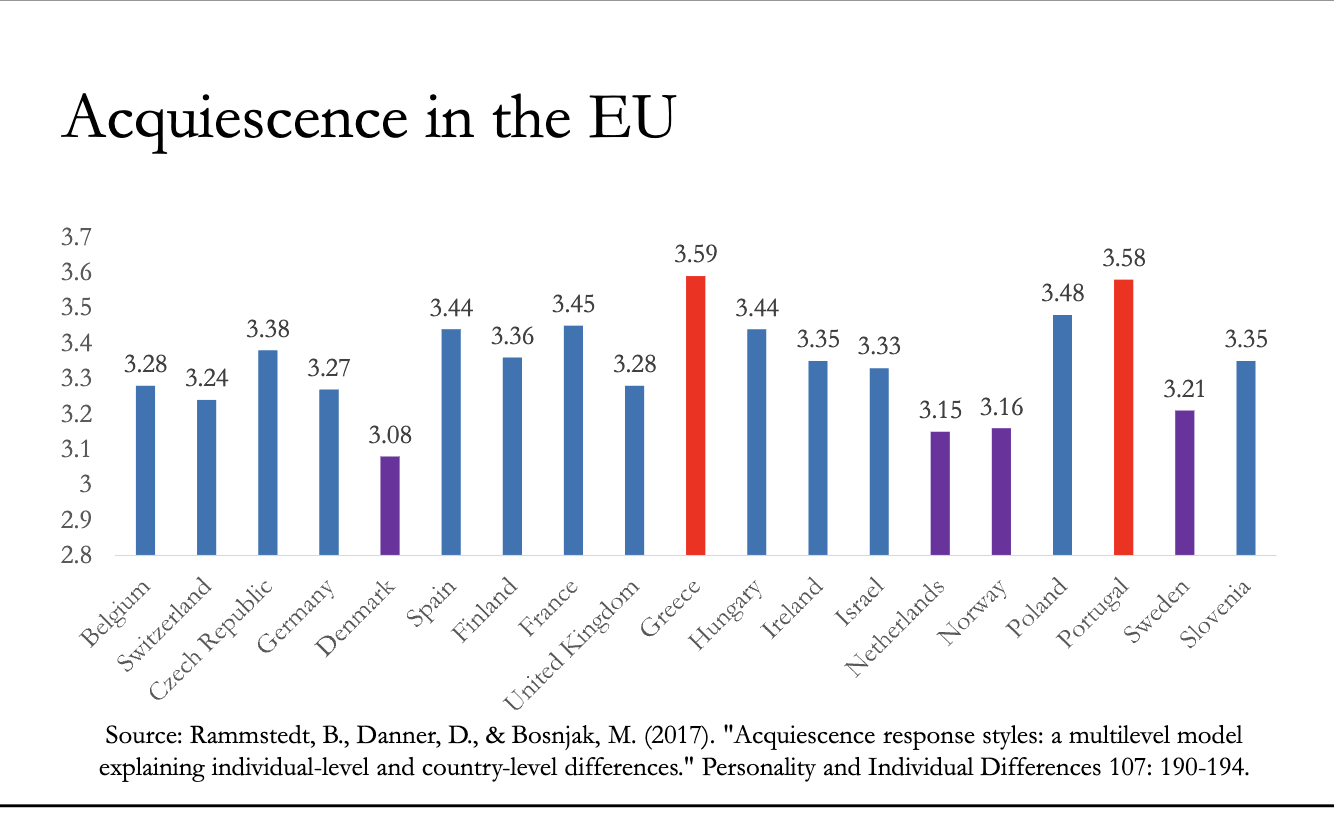
Chart (Slide 22): Countries like Greece and Portugal (higher collectivism/corruption scores in this dataset) have much higher Acquiescence bars than Denmark or Switzerland .
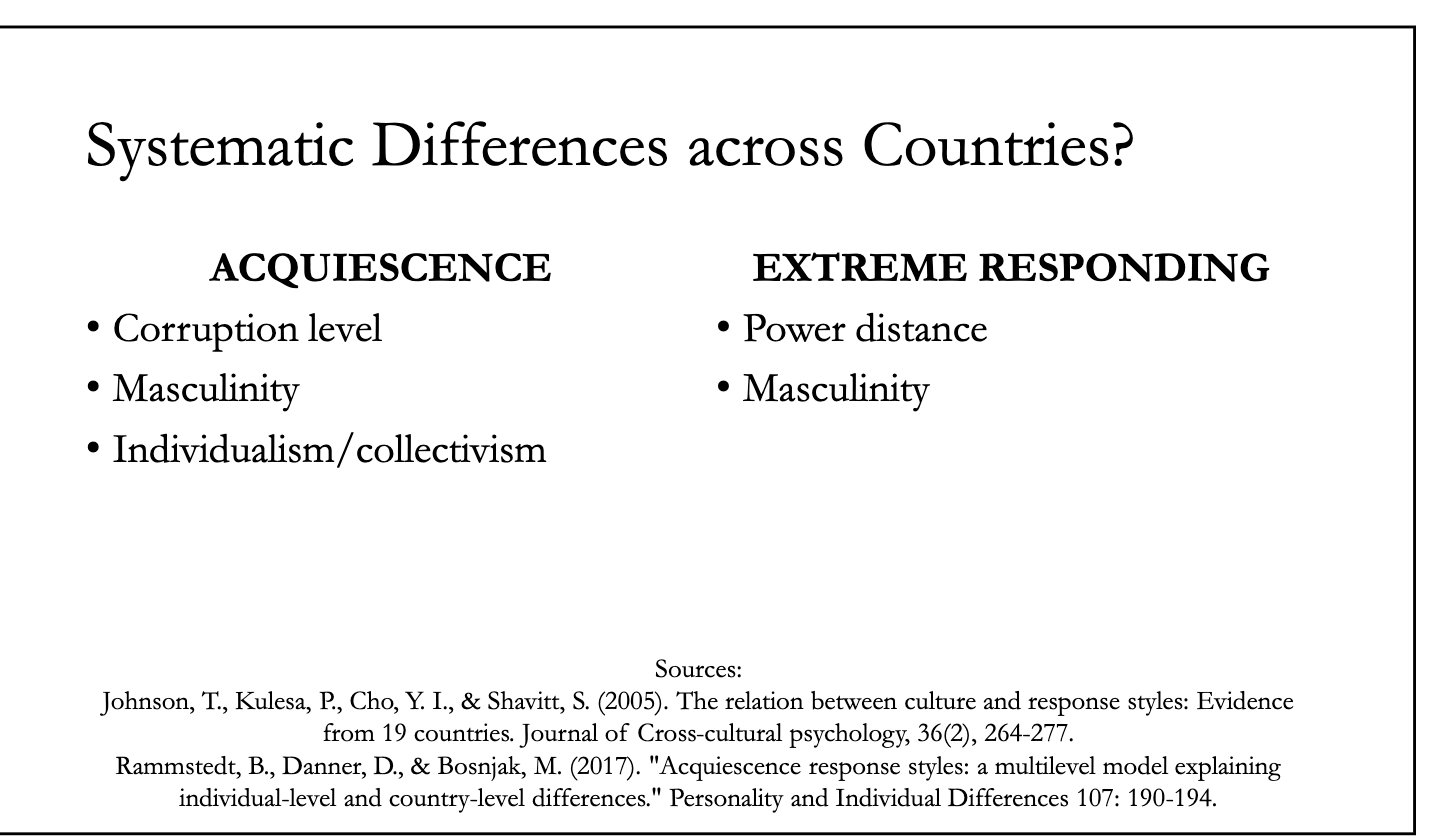
Extreme Responding (The "Dramatic" People):
Drivers: High Power Distance, Masculinity, and Individualism.
Why? In masculine or individualistic cultures, you are encouraged to have strong opinions and stand out. In high Power Distance cultures, you might need to speak loudly to be heard.
Metric Equivalence: Takeaways
Module 6: Metric Equivalence Takeaways
(Page 12 / Slide 24)
The Final Lesson When you see a difference in survey results between two countries (e.g., "Brazilians rate our brand higher than the British"):
Is it real? Maybe Brazilians actually love the brand more.
Is it a Response Style?
Brazilians might just be more extreme responders (culturally prone to giving 5/5 scores).
The British might be Midpoint responders (culturally prone to giving 3/5 scores).
Conclusion: Do not blindly trust the average score. You must adjust for these cultural response habits to get the truth
Sample Equivalence
The Big Question After checking if the questions are fair (Translation/Metric Equivalence), we must check if the people are comparable. This is Sample Equivalence.
The Goal: To ensure that the group of people you interview in Country A is essentially the "same" type of group as in Country B. If you interview rich doctors in the US and poor students in India, any difference in your results is probably due to their job/income, not their culture.
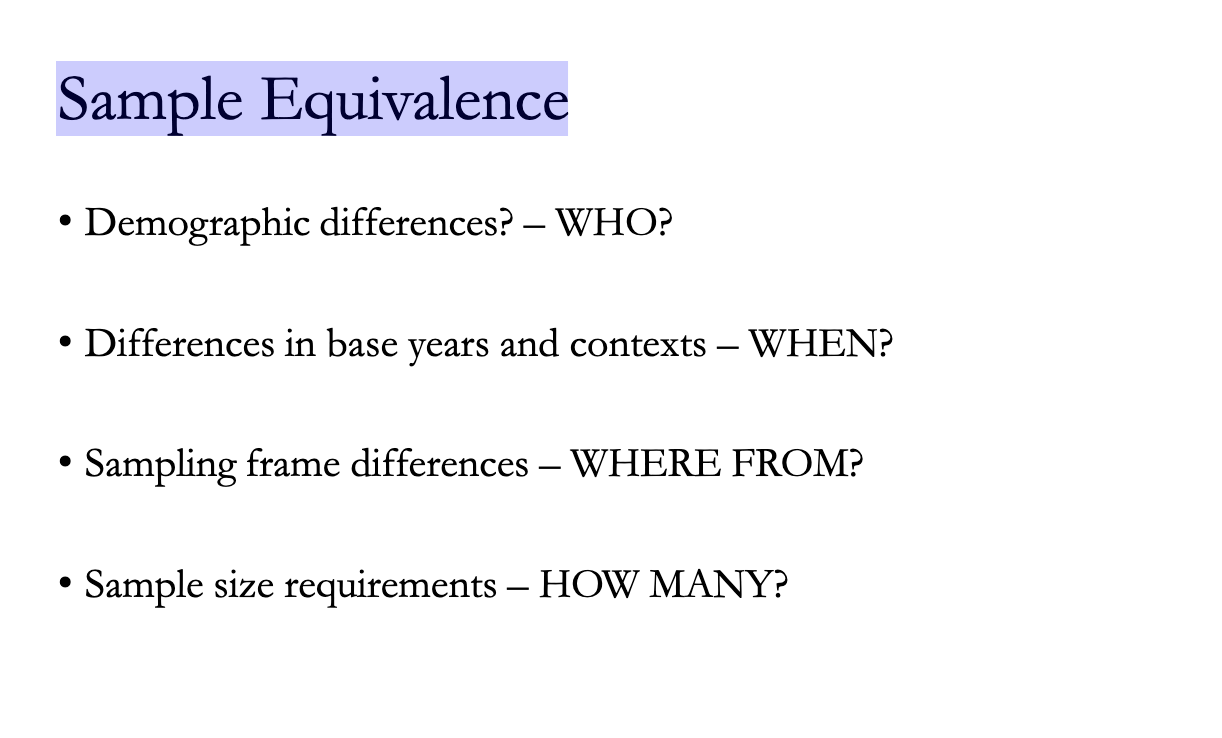
The 4 Criteria To get a fair comparison, you must check four boxes :
Who? (Demographics): Are they the same age, gender, education level?
When? (Context): Are we asking them at a similar time? (e.g., Asking about "Optimism" during a war in one country vs.h peace in another will skew results).
Where from? (Sampling Frame): Did we find them in a phone book, a mall, or online?
How many? (Sample Size): Do we have enough people in each country to be statistically sure?
The Sampling Dilemma (Representative vs. Matched)
Scenario 1: The Urban/Rural Problem (Kenya vs. Libya)
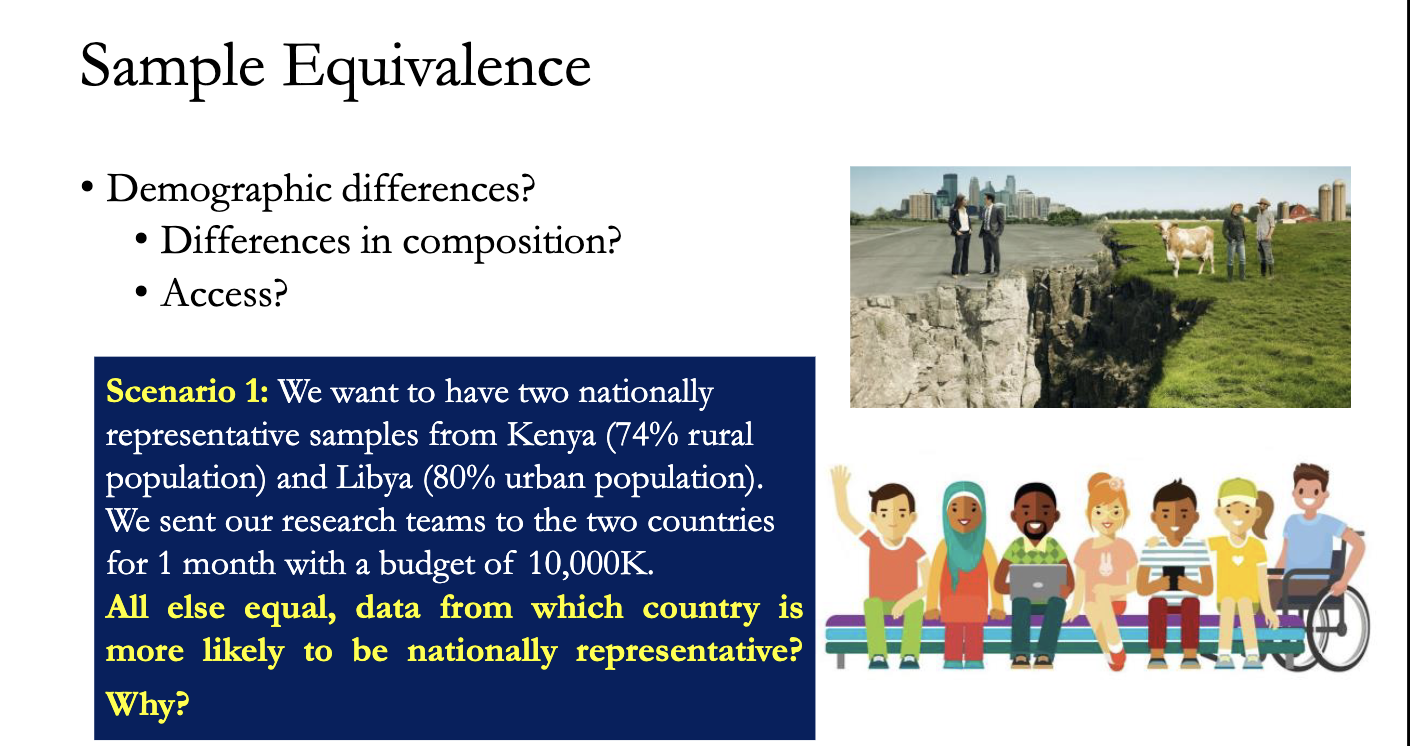
The Context: Kenya is 74% rural. Libya is 80% urban.
The Problem: A research team has a limited budget. It is very expensive to reach rural villages.
The Result: The team will likely stay in the cities in both countries to save money.
The Bias: The data from Libya will be fine (because most people live in cities anyway). The data from Kenya will be wrong (because you missed the 74% of people who live in villages). You failed to get a "Nationally Representative" sample .
Scenario 2: The Shopping Mall Problem (Netherlands vs. Iran)
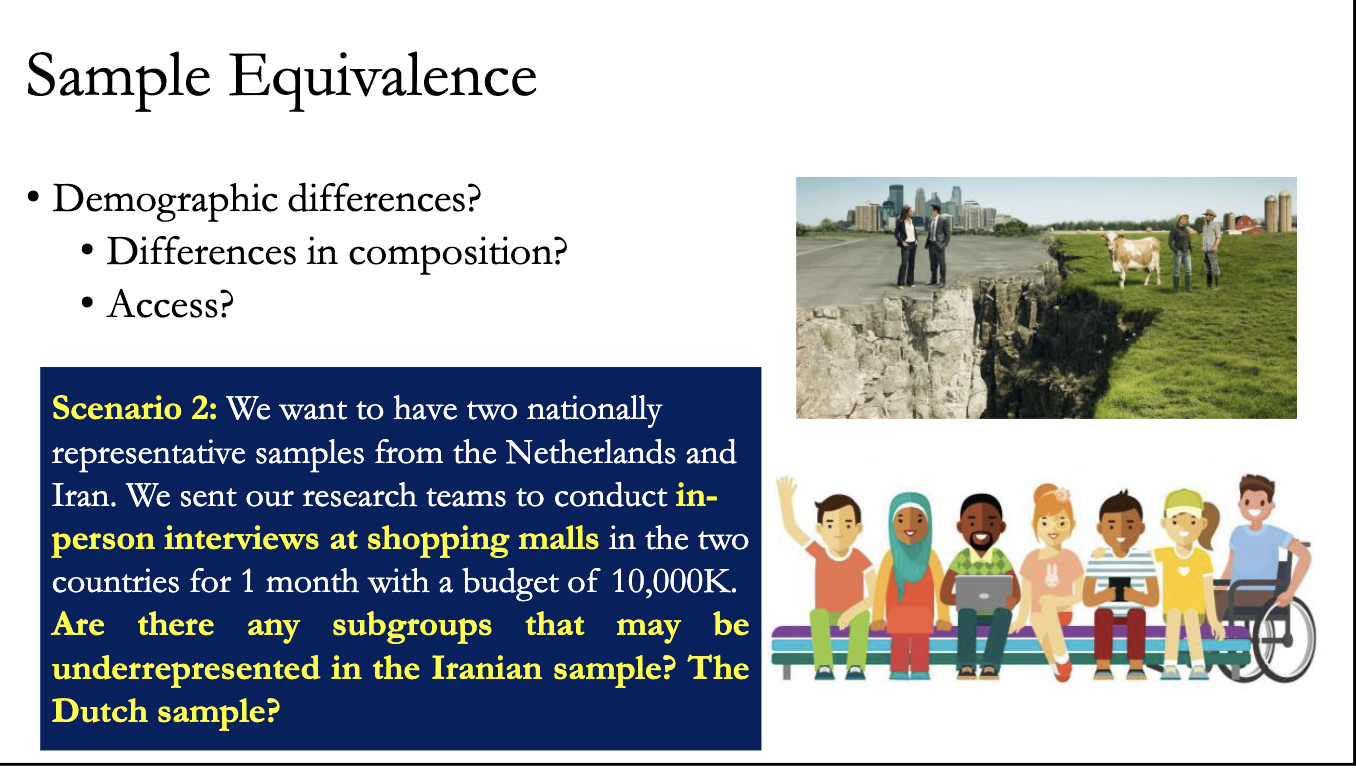
The Context: Research teams interview people in shopping malls in both countries.
The Problem:
In the Netherlands, everyone goes to malls. It is a decent slice of society.
In Iran, malls might be for wealthier, more modern consumers.
The Bias: The Iranian sample will likely over-represent the rich and under-represent the poor or traditional. You are comparing "Average Dutch people" to "Rich Iranian people" .
The "Matched Sample" Strategy
1. The Big Question The slide asks: "Is ensuring similar demographic composition a MUST?"
Translation: To compare the USA and India, do we need a sample that looks exactly like the whole US population and another that looks exactly like the whole Indian population?
2. The Answer: No. If you try to be "perfectly representative," you often fail to get a fair comparison.
Why? The "Average American" is older and wealthier. The "Average Indian" is younger and poorer. If you compare them, you aren't just comparing Culture; you are comparing Age and Money, too.
***The Solution (Matched Samples):***
Instead of comparing "Everyone," you compare a specific, matching group.
Example: Compare "University Students in New York" vs. "University Students in Mumbai."
Benefit: Now they have the same age and education. Any difference you find is more likely due to Culture, not money or age
WHEN? (Context)
Are we asking at a comparable time?
This criterion checks for timing events that distort data.
Example: If you survey consumer confidence in the US during a stock market boom and in France during a transit strike, the "When" is not equivalent. The French sample will look artificially pessimistic because of the timing, not because of their culture.
WHERE FROM? (Sampling Frame)
The Slide Content (Page 16 / Slide 31):
This slide lists different "places" or lists to find people: Mobile phone databases, Landline databases, Email databases, Mall intercepts, Door-to-door.
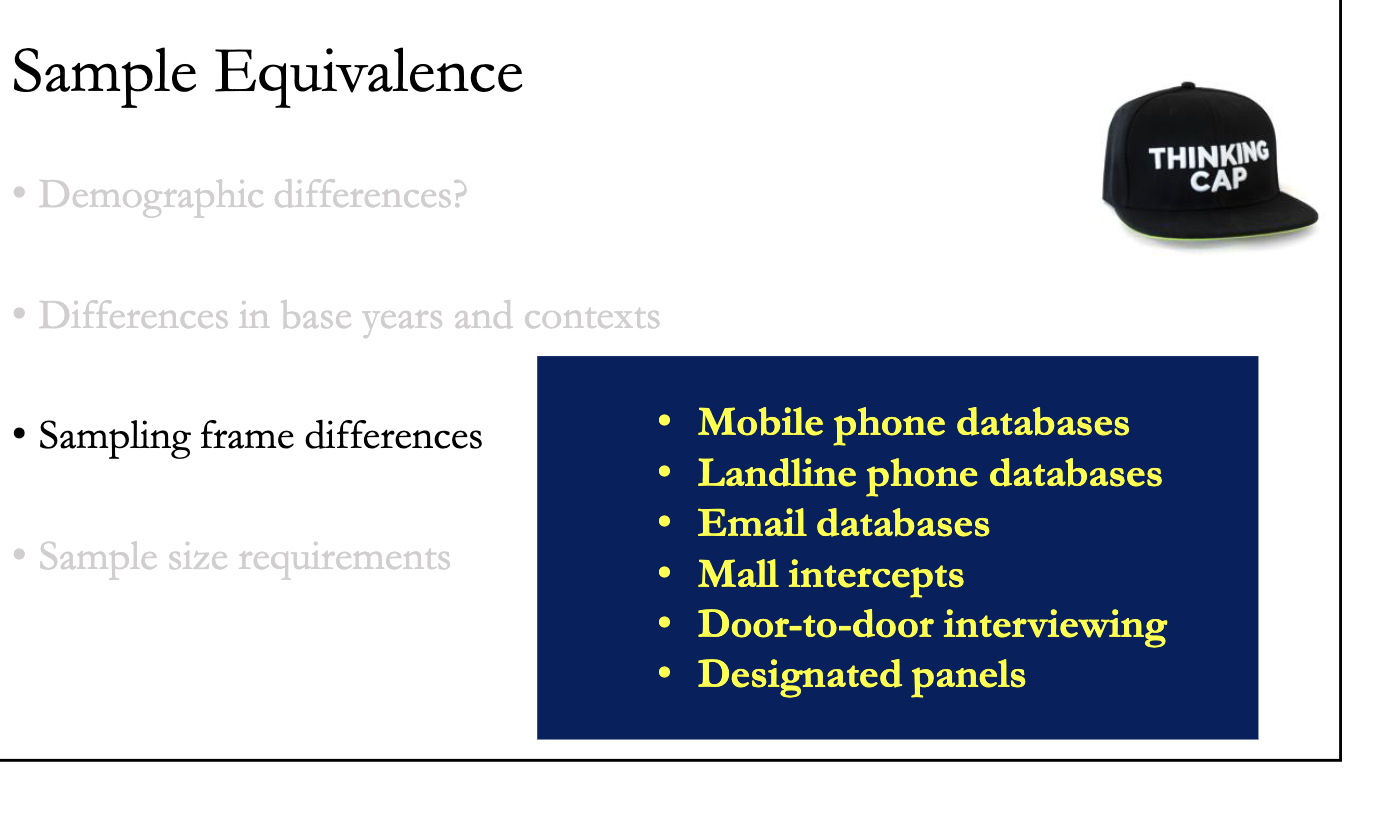
The Explanation:
The "Where from" determines who you actually get.
The Trap: Using the same method in two countries often results in different types of people.
Example: If you use a Landline Phone Database in the US, you get older people (young people use mobiles). If you use it in a developing nation, you get rich people (poor people don't have landlines).
Result: Even though you used the "same" source (Landlines), you failed Sample Equivalence because the social class of the people you reached is totally different
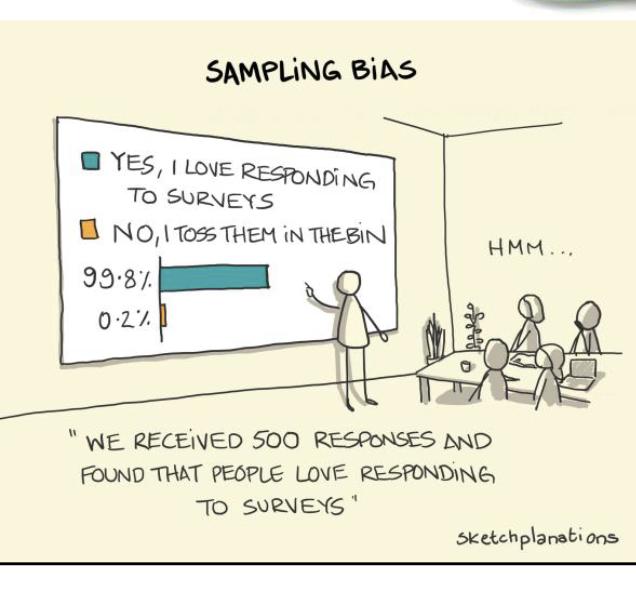
Session 7" lecture slides, the comic panel illustrates a critical failure in the sampling process known as Sampling Bias (specifically Non-Response Bias or Self-Selection Bias).
Here is what it tells us about the Sampling Frame and the research process:
1. The Scenario
The Sampling Frame (Who was contacted): The researchers sent surveys to a broad group of people (likely including both survey-lovers and survey-haters).
The Result: The researcher excitedly reports that 99.8% of respondents said "Yes, I love responding to surveys."
The Reality: The cartoon reveals the hidden truth: The people who hate surveys ("No, I toss them in the bin") simply didn't answer. They are missing from the data .
2. The Lesson for Sampling Frames The comic demonstrates that having a good Sampling Frame (a list of people to contact) is not enough.
The Disconnect: There is a gap between the Sampling Frame (everyone you tried to reach) and the Actual Sample (the people who agreed to talk to you).
The Error: If the decision to respond is correlated with the topic (e.g., only people who like surveys answer a survey about surveys), your data becomes useless. The sample no longer represents the frame .
3. International Marketing Implication This is crucial for Sample Equivalence across countries.
If you survey Japan (where people might feel culturally obligated to respond politely) vs. the USA (where people might ignore surveys), you might get a 90% response rate in Japan and a 5% rate in the US.
Result: You are comparing "Average Japanese People" to "Weirdly Enthusiastic Americans." Your samples are not equivalent, and your cross-cultural comparison will be wrong.
HOW MANY? (Sample Size & Bias)
The Core Question: "Do we have enough people?"
Usually, in statistics, you need a certain number of people (e.g., 200 per country) to make sure your math works. If you have too few, your results are just luck.
The Assumption: If I get 500 people in Japan and 500 people in the USA, I have "Sample Equivalence" because the numbers are the same ($500=500$).
The Hidden Trap: The Illusion of Quantity
The comic on Slide 32 proves that having a "big number" (Sample Size) doesn't matter if the Response Rate is low.
1. The "Self-Selection" Bias
The Situation: You send out 100,000 surveys.
The Result: You get 500 responses.
The Problem: You might think, "Great! 500 is a big number! I can analyze this."
The Reality: As the comic shows, the 99,500 people who acted normal threw the survey in the trash. The 500 people who answered are the "weird" ones who "Love responding to surveys" 1.
Conclusion: You are not studying the "General Public." You are studying "People who love surveys."
2. The International Disaster
This destroys your data when you compare countries because cultures respond differently.
Country A (e.g., Collectivist/Polite): People feel a social duty to help. You send 1,000 surveys, and 800 people answer. This sample represents normal people.
Country B (e.g., Individualist/Busy): People value privacy or time. You send 1,000 surveys, and only 50 answer. These 50 are likely extreme outliers (bored, lonely, or angry).
The Comparison: Even if you wait until you get 800 responses from Country B, you are comparing 800 Average Citizens (Country A) against 800 Extreme Outliers (Country B).
The Lesson for "How Many?"
The question "How many?" is actually two questions:
Raw Size: Do we have enough data points (e.g., 200) to run the software?2.
Response Rate: Did we get these people easily (indicating they are normal), or did we have to scrape the bottom of the barrel (indicating they are special/biased)?
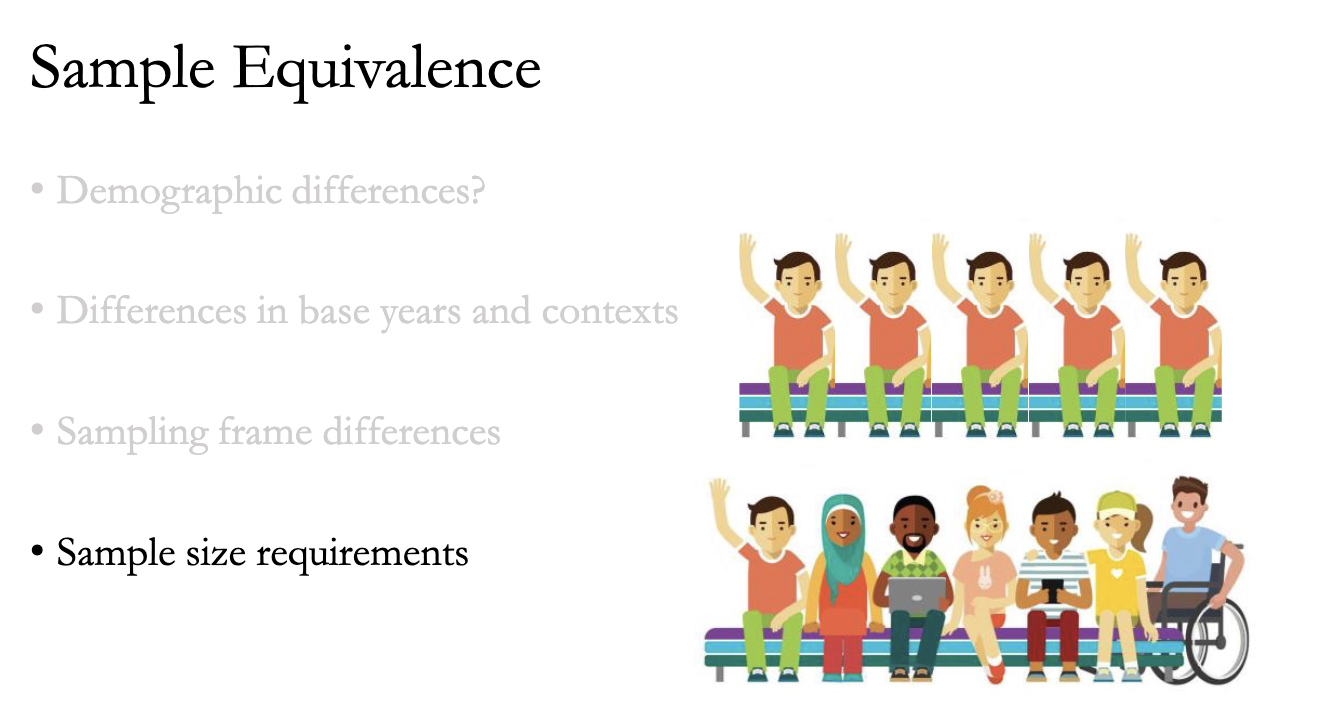
The image you are referring to, which appears on Page 17 (Slide 33) of the lecture slides, is used to illustrate the concept of Sample Equivalence by showing the difference between a homogenous group (top row) and a diverse group (bottom row).
The bottom bench, showing people of various ages, genders, ethnicities, and physical abilities, visually represents diversity.
However, in the context of the lecture on Sample Equivalence, the primary lesson conveyed by contrasting these two groups is:
Top Bench (Homogenous): A sample that is not diverse and likely not representative of the total population.
Bottom Bench (Diverse): A sample that attempts to achieve demographic equivalence and better represent the variety that exists in a population.
The inclusion of many different types of people (diversity) is used by the lecture to remind researchers of the complexity of achieving a truly equivalent sample across different countries.
Lecture 7: Self-check Questions
1. Dimensions of Measurement Equivalence & Violations
Measurement Equivalence ensures that the instrument measures the concept in the same way across cultures. It consists of three dimensions:
Translation Equivalence: The survey items have the same meaning in each language.
Violation: A slogan like "Where a kid can be a kid" loses its emotional intensity and meaning when translated into a second language .
Calibration Equivalence: The units of measurement (monetary, weight, distance) are comparable.
Violation: Comparing price sensitivity between the UK (prices ~10-30 GBP) and Russia (prices ~1000-3000 RUB). The larger numbers in Russia trigger a "Numerosity Heuristic," making the price feel higher and causing Russians to appear falsely more price-sensitive .
Metric Equivalence: The scoring procedure or scale (e.g., 1-5 or 1-7) functions the same way.
Violation: Comparing quality ratings between the US and Germany. In the US, 5/5 is the best score. In Germany, 1 is often the best grade (like in school). If not corrected, a German rating of "1" (Excellent) might be coded as "Low Quality," leading to incorrect conclusions .
2. The Four Response Styles (Baumgartner & Steenkamp, 2001)
Acquiescence Response Style (ARS): The tendency to agree with items regardless of content (being a "Yea-sayer").
Extreme Response Style (ERS): The tendency to select the endpoints of the scale (e.g., 1s and 7s) to express strong opinions.
Midpoint Response Style (MRS): The tendency to use the middle category of the scale (e.g., 3 on a 5-point scale), often to appear neutral or safe .
Noncontingent Responding, which is answering randomly.
3. Importance of Accounting for Response Styles
It is critical because observed differences in scores (e.g., Country A has a higher mean score than Country B) may not reflect actual differences in attitude (e.g., brand liking). Instead, they may reflect cultural response habits (e.g., Country A has a habit of Extreme Responding, while Country B has a habit of Midpoint Responding). Ignoring this leads to biased conclusions and incorrect managerial decisions regarding which markets to enter or how to position products .
4. Measuring Response Style Differences
For Acquiescence (ARS): You calculate the sum of responses to heterogeneous items. If a respondent agrees with two contradictory statements (e.g., "I love crowds" and "I hate crowds"), they have high ARS .
For Extreme Responding (ERS): You calculate the percentage (or count) of items where the respondent chose the absolute endpoints (e.g., 1 or 7), regardless of whether the question was positive or negative.
For Midpoint Responding (MRS): You calculate the percentage of items where the respondent chose the exact middle option .
Based on the lecture slides from Session 7, here are the answers to the self-check questions.
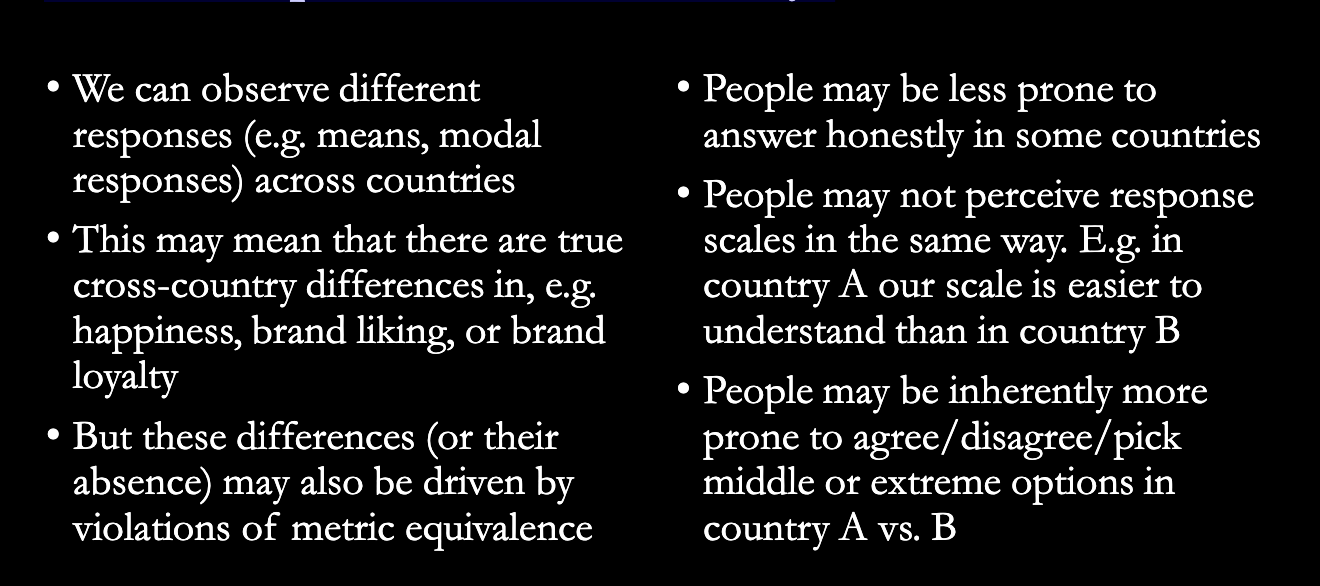
1. Why is it important to account for cross-national differences in response styles?
It is crucial to account for response styles because observed differences in data may not reflect reality. If you do not correct for these styles, you risk making incorrect business decisions based on biased data.
True vs. Artificial Differences: A higher score in one country might not mean they like your product more (a true difference). It might just mean they have a cultural habit of using extreme ratings (e.g., giving 5/5 for everything), while another country has a habit of giving modest ratings (e.g., giving 3/5 for everything).
Data Reliability: Without accounting for these styles, data becomes unreliable. For example, asking "Are Tajikistan citizens happier than Croatian citizens?" might actually just measure "Are Tajikistan citizens more likely to say they are happy?" rather than their actual happiness levels .
Managerial Risk: Ignoring this can lead to false conclusions, such as believing a product is failing in a country where people are simply tougher graders (e.g., Germany) compared to a country where people are enthusiastic graders (e.g., USA) .
more polished :
How do you measure these differences?
Researchers measure response styles by calculating specific patterns in how respondents answer a set of heterogeneous (unrelated) items.
Extreme Response Style (ERS):
Measurement: Calculate the number or percentage of items where the respondent selects the most extreme endpoints of the scale (e.g., 1 or 7 on a 7-point scale), regardless of whether the question is positive or negative.
Midpoint Response Style (MRS):
Measurement: Calculate the number or percentage of items where the respondent selects the exact middle category (e.g., 3 on a 5-point scale) .
Acquiescence Response Style (ARS):
Measurement: This measures the "Yes-saying" bias. It is often measured by analyzing responses to pairs of contradictory items (e.g., "Government should intervene less" vs. "Government should intervene more"). If a respondent agrees with both statements, they are displaying acquiescence .
Noncontingent Responding:
Measurement: This measures random/careless responding. It is calculated by summing the differences between responses to pairs of items that should be highly correlated. If the difference is large (i.e., they answered differently for two very similar questions), it indicates random responding .
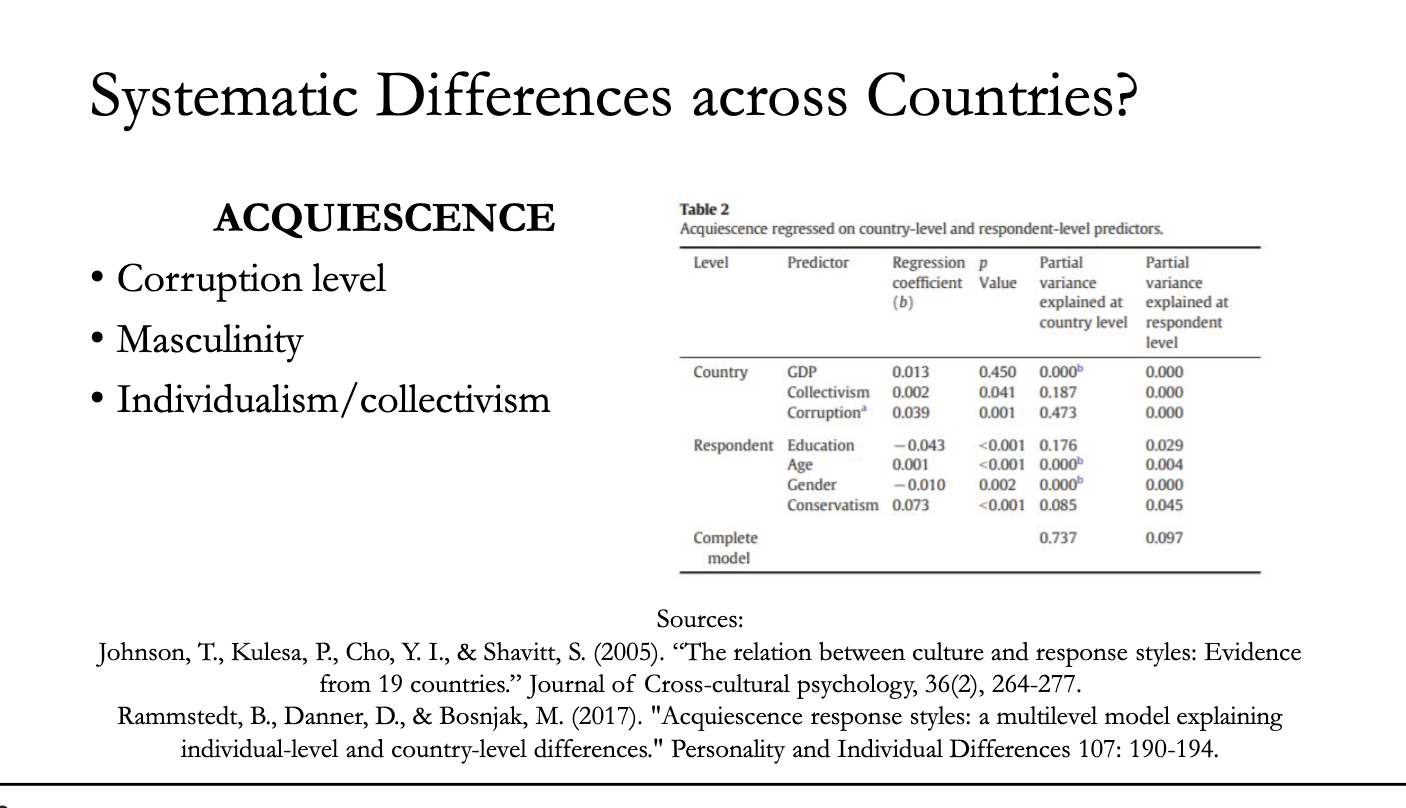
5. Predictors of Response Styles
Individual-Level Predictors:
Education: Lower education correlates with higher Acquiescence.
Age: Older respondents tend to have higher Acquiescence.
Conservatism: Higher conservatism predicts higher Acquiescence.
Country-Level Predictors:
Acquiescence (ARS): Associated with high Corruption levels and high Collectivism.
Extreme Responding (ERS): Associated with high Power Distance, Masculinity, and Individualism.
6. Types of Sample Equivalence & Violations
There are four key types of sample equivalence that must be met for cross-cultural comparison:
Demographic Equivalence (Who?): Ensuring samples are similar in key characteristics like age, gender, education, and income.
Violation: Comparing a sample of university students in Country A with a sample of the general working population in Country B .
Context/Base Year Equivalence (When?): Ensuring data is collected during comparable time periods to avoid temporary biases.
Violation: Surveying consumer optimism in Country A during a booming economy and Country B during a recession or war. The difference in results would be due to the specific event, not cultural values.
Sampling Frame Equivalence (Where from?): Ensuring the source list used to reach respondents represents the same type of people.
Violation: Using landline phone directories in the US (reaches older people) vs. developing countries (reaches wealthy elites). The method is the same, but the resulting social class is different .
Sample Size Equivalence (How many?): Ensuring there are enough respondents for statistical power and that response rates are comparable.
Violation: Comparing Country A (where 80% of people answered) with Country B (where only 5% answered). Even if you have 500 people in both, Country B's sample suffers from Non-Response Bias (only opinionated people answered), making it non-equivalent to Country A's representative sample
7. How can you ensure that sample equivalence is met when conducting international marketing research?
Question 7 using your 1-2-3-4 Framework
To answer this, you just need to provide a solution for each of your four points.
1. Solving "WHO?" (Demographics)
The Problem: Comparing the "Average American" to the "Average Indian" is unfair because their incomes and education are too different.
The Solution: Use Matched Samples. Instead of interviewing random people, interview a specific, identical group in both countries (e.g., "University Students" or "Urban Housewives"). This ensures the "Who" is the same .
2. Solving "WHEN?" (Context)
The Problem: If you survey Country A during a war and Country B during peace, the results aren't comparable.
The Solution: Synchronize the Timing. Ensure you collect data during a similar, stable time period in both countries. Avoid major holidays (like Ramadan) or elections if they don't happen in both places at the same time.
3. Solving "WHERE FROM?" (Sampling Frame)
The Problem: Using a "Phone Book" reaches everyone in the US but only rich people in Kenya.
The Solution: Adapt the Frame. Use different methods to reach the same person.
In US: Use an Online Survey.
In Kenya: Use Door-to-Door interviews.
Why? This ensures you reach the "Average Consumer" in both places, even if you used different tools to find them .
4. Solving "HOW MANY?" (Sample Size)
The Problem: You have 500 people in both countries, but in Country B, only the weird survey-lovers answered (Low Response Rate).
The Solution: Maximize Response Rates. You must work harder in countries where people ignore surveys (e.g., offer better money/gifts) to ensure normal people answer. You need a similar Response Rate, not just a similar total number .