Biology practicals
1/96
Earn XP
Description and Tags
Name | Mastery | Learn | Test | Matching | Spaced |
|---|
No study sessions yet.
97 Terms
Investigation into the effect of a named variable on the rate of an enzyme-controlled reaction.
Give examples of variables that could affect the rate of an enzyme-controlled reaction
● Enzyme concentration / volume
● Substrate concentration / volume
● Temperature of solution
● pH of solution
● Inhibitor concentration
Any one of these can be the independent variable and need to be varied (eg. by preparing a dilution series of varying concentrations). All others (except inhibitors) would be control variables so would need to be kept constant.
Describe how temperature can be controlled.
● Use a thermostatically controlled water bath
● Monitor using a thermometer at regular intervals and
Describe how pH can be controlled.
● Use a buffer solution
● Monitor using a pH meter at regular intervals
Why were the enzyme & substrate solutions left in the water bath for 10 mins before mixing?
● So solutions equilibrate / reach the temperature of the water bath
Describe a control experiment.
● Use denatured enzymes (eg. by boiling)
● Everything else same as experiment, eg. same conc. / volume of substrate (at start) and enzyme, same type / volume of buffer solution, same temperature
Describe how the rate of an enzyme-controlled reaction can be measured
● Measure time taken for reaction to reach a set point, eg. concentration / volume / mass / colour of substrate or product
○ Rate of reaction = 1 / time; example units = s-1
● Measure concentration / volume / mass / colour of substrate or product at regular intervals throughout reaction
○ Plot on a graph with time on the x axis and whatever is being measured on the y axis
○ Draw a tangent at t = 0 (or any other time for rate at a particular point)
○ Initial rate of reaction = change in y / change in x; example units = cm3 s-1
Suggest a safety risk and explain how to reduce this risk.
● Handling enzymes may cause an allergic reaction
● Avoid contact with skin by wearing gloves and eye protection
Explain a procedure that could be used to stop each reaction.
● Boil / add strong acid / alkali → denature enzyme
● Put in ice → lower kinetic energy so no E-S complexes form
● Add high concentration of inhibitor → no E-S complexes form
Describe how processed data can be presented as a graph
● Independent variable on x axis, rate of reaction on y axis, including units
● Linear number sequence on axis, appropriate scale (graph should cover at least half of grid)
● Plot coordinates accurately as crosses
● Join point to point with straight lines if cannot be certain of intermediate values OR draw a smooth curve but do not extrapolate
Explain why the rate of reaction decreases over time throughout each experiment
● Initial rate is highest as substrate concentration not limiting / many E-S complexes form
● Reaction slows as substrate used up and often stops as there is no substrate left
Preparation of stained squashes of cells from plant root tips; set-up and use of an optical microscope to identify the stages of mitosis in these stained squashes and calculation of a mitotic index.
Describe how to prepare squashes of cells from plant root tips
1. Cut a thin slice of root tip (5mm from end) using scalpel and mount onto a slide
2. Soak root tip in hydrochloric acid then rinse
3. Stain for DNA eg. with toluidine blue
4. Lower coverslip using a mounted needle at 45o without trapping air bubbles
5. Squash by firmly pressing down on glass slip but do not push sideways
Why are root tips used?
● Where dividing cells are found / mitosis occurs
Why is a stain used?
● To distinguish chromosomes
● Chromosomes not visible without stain
Why squash / press down on cover slip?
● (Spreads out cells) to create a single layer of cells
● So light passes through to make chromosomes visible
Why not push cover slip sideways?
● Avoid rolling cells together / breaking chromosomes
Why soak roots in acid?
● Separate cells / cell walls
● To allow stain to diffuse into cells
● To allow cells to be more easily squashed
● To stop mitosis
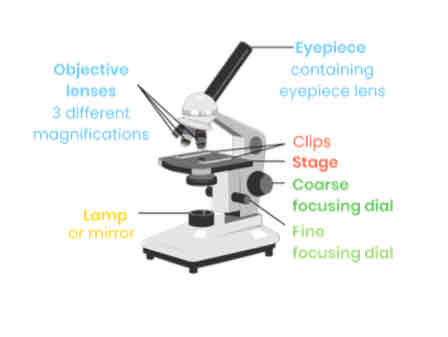
Describe how to set-up and use an optical microscope
Clip slide onto stage and turn on light
Select lowest power objective lens (usually x 4)
Use coarse focusing dial to move stage close to lens
Turn coarse focusing dial to move stage away from lens until image comes into focus
Adjust fine focusing dial to get clear image
Swap to higher power objective lens, then refocus
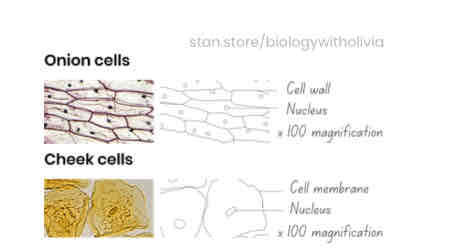
What are the rules of scientific drawing?
✓ Look similar to specimen / image
✓ No sketching / shading - only clear, continuous lines
✓ Include a magnification scale (eg. x 400)
✓ Label with straight, uncrossed lines
Production of a dilution series of a solute to produce a calibration curve with which to identify the water potential of plant tissue.
Describe how to calculate dilutions
Use the formula: C1 x V1 = C2 x V2
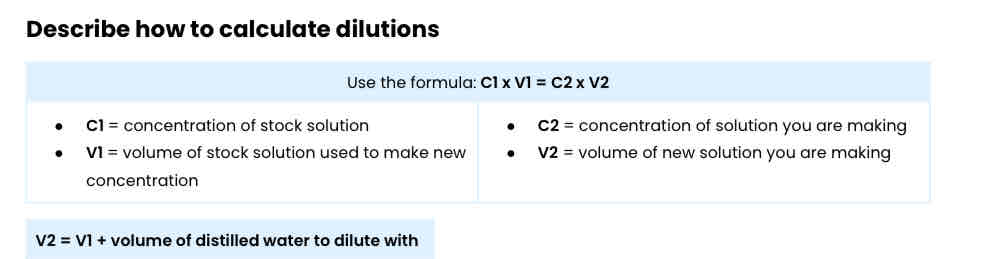
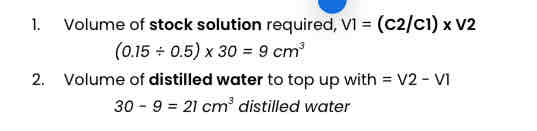
Worked example: describe how you would use a 0.5 mol dm-3 solution of sucrose (stock solution) to produce 30 cm3 of a 0.15 mol dm-3 sucrose solution.
Describe a method to produce of a calibration curve with which to identify the water potential of plant tissue (eg. potato)
1. Create a series of dilutions using a 1 mol dm-3 sucrose solution (0.0, 0.2, 0.4, 0.6, 0.8, 1.0 mol dm-3 )
2. Use scalpel / cork borer to cut potato into identical cylinders
3. Blot dry with a paper towel and measure / record initial mass of each piece
4. Immerse one chip in each solution and leave for a set time (20-30 mins) in a water bath at 30oC
5. Blot dry with a paper towel and measure / record final mass of each piece
Describe a method to produce of a calibration curve with which to identify the water potential of plant tissue (eg. potato)
Part 2: processing data
Calculate % change in mass = (final - initial mass)/ initial mass
Plot a graph with concentration on x axis and percentage change in mass on y axis (calibration curve)
Must show positive and negative regions
Identify concentration where line of best fit intercepts x axis (0% change)
Water potential of sucrose solution = water potential of potato cells 9. Use a table in a textbook to find the water potential of that solution
Why calculate % change in mass?
● Enables comparison / shows proportional change
● As plant tissue samples had different initial masses
Why blot dry before weighing?
● Solution on surface will add to mass (only want to measure water taken up or lost)
● Amount of solution on cube varies (so ensure same amount of solution on outside)
Explain the changes in plant tissue mass when placed in different concentrations of solute
Increase in mass
● Water moved into cells by osmosis
● As water potential of solution higher than inside cells
Decrease in mass
● Water moved out of cells by osmosis
● As water potential of solution lower than inside cells
No change
● No net gain/loss of water by osmosis
● As water potential of solution = water potential of cells
Investigation into the effect of a named variable on the permeability of cell-surface membranes.
Describe a method to investigate the effect of a named variable (eg. temperature) on the permeability of cell-surface membranes
1. Cut equal sized / identical cubes of plant tissue (eg. beetroot) of same age / type using a scalpel
2. Rinse to remove pigment released during cutting or blot on paper towel
3. Add same number of cubes to 5 different test tubes containing same volume of water (eg. 5cm3)
4. Place each test tube in a water bath at a different temperature (eg. 10, 20, 30, 40, 50 oC)
5. Leave for same amount of time (eg. 20 mins)
6. Remove beetroot and measure intensity of colour of surrounding solution:
● Semi-quantitatively
○ Use a known conc. of extract & distilled water to prepare a dilution series (colour standards)
○ Compare results with colour standards to estimate conc.
● Quantitatively
○ Measure absorbance (of light) of known concentrations using a colorimeter
○ Draw a calibration curve → plot a graph of absorbance (y) against conc. of extract (x) and draw a line / curve of best fit
○ Absorbance value for sample read off calibration curve to find associated extract conc.
What are the issues with comparing to a colour standard?
● Matching to colour standards is subjective
● Colour obtained may not match any of colour standards
Why wash the beetroot before placing it in water?
● Wash off any pigment on surface
● To show that release is only due to [named variable]
Why control the volume of water?
● Too much water would dilute the pigment so solution will appear lighter / more light passes through in colorimeter than expected
● So results are comparable
How could you ensure beetroot cylinders were kept at the same temperature throughout the experiment?
● Take readings in intervals throughout experiment of temperature in tube using a digital thermometer / temperature sensor
● Use corrective measure if temperature has fluctuated
What does a high absorbance suggest about the cell-membrane?
● More permeable / damaged
● As more pigment leaks out making surrounding solution more concentrated (darker)
Explain how temperature affects permeability of cell-surface membranes
● As temperature increases, permeability increases
○ Phospholipids gain kinetic energy and fluidity increases
○ Transport proteins denature at high temperatures as H bonds break, changing tertiary structure
● At very low temperatures, permeability increases
○ Ice crystals can form which pierce the cell membrane and increase permeability
Explain how pH affects permeability of cell-surface membranes
● High or low pH increases permeability
○ Transport proteins denature as H / ionic bonds break, changing tertiary structure
Explain how lipid-soluble solvents eg. alcohol affect permeability of cell-surface membranes
● As concentration increases, permeability increases
● Ethanol (a lipid-soluble solvent) may dissolve phospholipid bilayer (gaps form)
Dissection of animal or plant gas exchange system or mass transport system or of organ within such a system
Describe precautions that should be followed when performing a dissection
● Cover any cuts with a waterproof dressing
● When using a scalpel, cut away from body onto a hard surface
● When using a scalpel, use a sharp blade
● When using a scalpel, carry with blade protected / pointing down
● Wear disposable gloves and disinfect hands / wash with soap
● Disinfect surfaces / equipment
● Safe disposal - put gloves / paper towels / organ in a separate bag / bin to dispose
● If poisonous chemicals / toxins involved, work in a well ventilated environment
Suggest an ethical consideration when dissecting animals
● Morally wrong to kill animals just for dissection
● So use animals for dissection that have already been killed (humanely) for meat
Describe how you could prepare a temporary mount of a piece of plant tissue for observation with an optical microscope
1. Add a drop of water to glass slide
2. Obtain a thin section of specimen and place on slide
3. Stain (eg. with iodine / potassium iodide to view starch)
4. Lower coverslip at angle using mounted needle without trapping air bubbles
What are the rules of scientific drawing?
✓ Look similar to specimen / image, draw all parts to same scale / relative size
✓ No sketching / shading - only clear, continuous lines
✓ Include a magnification scale (eg. x 400)
✓ Label with straight, uncrossed lines
Use of aseptic techniques to investigate the effect of antimicrobial substances on microbial growth.
Explain examples of aseptic techniques that could be used
● Wash hands with soap / disinfect surfaces → kill microbes / prevent contamination
● Sterilise pipette / spreader / boil agar growth medium → kill microbes / prevent contamination
● Flame neck of bottle of bacteria → kill microbes / prevent contamination
● Bunsen burner close → upward current of air draws air-borne microbes away to prevent contamination
● Lift lid of petri dish slightly / minimise opening → prevent entry of microbes / contamination
Describe a method to investigate the effect of antimicrobial substances (eg. antibiotics, disinfectants, antiseptics) on microbial growth
1. Prepare area using aseptic techniques (as above)
2. Use a sterile pipette to transfer bacteria from broth to agar plate using aseptic techniques (as above)
3. Use a sterile spreader to evenly spread bacteria over agar plate
4. Use sterile forceps to place same size discs that have been soaked in different types / concentrations of
antimicrobials for same length of time, onto agar plate (at equal distances)
5. Lightly tape lid onto plate (not fully sealed), invert and incubate at 25oC for 48 hours
6. Measure diameter of inhibition zone around each disc and calculate area using πr2
Why is it important to maintain a pure culture of bacteria?
● Bacteria may outcompete bacteria being investigated
● Or could be harmful to humans / pathogenic
Why incubate upside down?
Condensation drips onto lid rather than surface of agar
What if inhibition zones are irregular?
Repeat readings in different positions, calculate a mean
Why not use higher antimicrobial conc.?
More bacteria killed so clear zones may overlap
Describe how data about the effect of antimicrobial substances can be presented as a graph
● Categorical data → bar chart (X axis type of antimicrobial, Y axis area of zone of inhibition / mm3)
● Continuous data → line graph joined by a line of best fit (X axis concentration of antibiotic / μgmL-1, Y axis area of zone of inhibition / mm3)
Explain the presence and absence of clear zones
1. Clear zones → antimicrobial diffuses out of disc into agar, killing / inhibiting growth of bacteria ● Larger clear zones → more bacteria killed → more effective antimicrobial
2. No clear zones → if antibiotic used, bacteria may be resistant or antibiotic may not be effective against that specific bacteria
Use of chromatography to investigate the pigments isolated from leaves of different plants, eg, leaves from shade-tolerant and shade-intolerant plants or leaves of different colours.
Describe how pigments from a leaf of a plant can be isolated with paper chromatography
1. Crush leaves with solvent to extract pigments
2. Draw a pencil line on filter / chromatography paper, 1 cm above bottom
3. Add a drop of extract to line (point of origin)
4. Stand paper in boiling tube of (organic) solvent below point of origin
5. Add lid and leave to run (solvent moves up, carrying dissolved pigments)
6. Remove before solvent reaches top and mark solvent front with pencil
Explain why the origin should be drawn in pencil rather than ink.
● Ink is soluble in solvent
● So ink would mix with pigments / line would move
Explain why the point of origin should be above the level of the solvent.
● Pigments are soluble in solvent
● So would run off paper / spots dissolve into solvent
Explain why a pigment may not move up the chromatography paper in one solvent.
● May be soluble in one solvent but insoluble in another
Describe how pigments can be identified
● Rf value = distance moved by spot / distance moved by solvent front
● Compare Rf value to published value
Explain why the solvent front should be marked quickly once chromatography paper is removed.
Once solvent evaporates, solvent front not visible
Explain why the centre of each pigment spot should be measured.
● Standardises readings as pigment is spread out
● So allows comparisons to be made
Explain why the obtained Rf values were similar, but not identical, to the published values.
● Different solvent / paper / running conditions may affect Rf value
Investigation into the effect of a named factor on the rate of dehydrogenase activity in extracts of chloroplasts. Describe the role of the enzyme dehydrogenase in photosynthesis
● Catalyses the reduction of NADP in the light-dependent reaction
○ NADP accepts (gains) electrons from photoionisation of chlorophyll / photolysis of water
Describe how rate of dehydrogenase activity in extracts of chloroplasts can be measured
1. Extract chloroplasts from a leaf sample using the method in ‘2.1.3 Methods of studying cells’
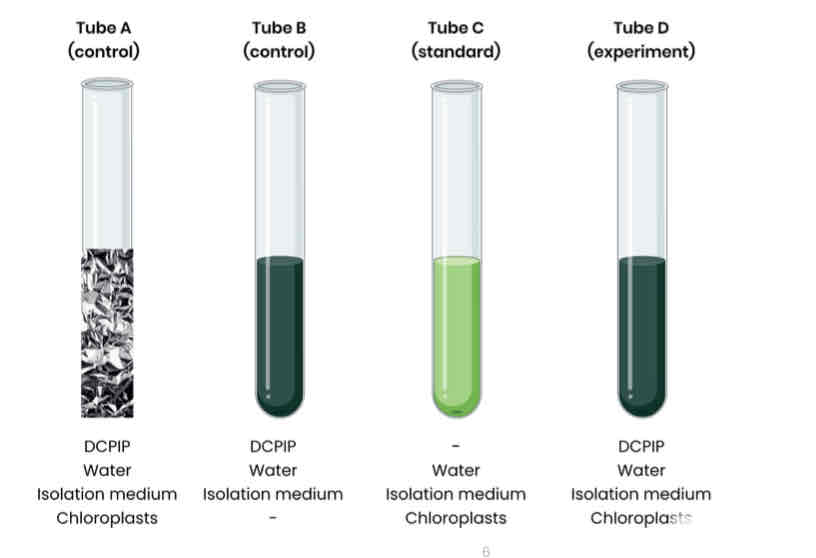
2. Set up test tubes as follows:
A. Control 1 - set volume of DCPIP (redox indicator dye, electron acceptor), water and chloroplasts in isolation medium, covered in foil to block light
B. Control 2 - set volume of DCPIP, water and isolation medium without chloroplasts
C. Standard - set volume of water and chloroplasts in isolation medium, without DCPIP
D. Experiment - set volume of DCPIP, water and chloroplasts in isolation medium
3. Shine light on test tubes and time how long to it takes for DCPIP to turn from blue (oxidised) to colourless (reduced) in tube D (tube A and B should show no change)
○ Compare to a colour standard (tube C) to identify end point
4. Rate of dehydrogenase activity (s-1) = 1 / time taken
Give examples of variables that could be controlled.
● Source of chloroplasts
● Volume of chloroplast suspension
● Volume / concentration of DCPIP
Explain the purpose of control 1 (tube A).
● Shows light is required for DCPIP to decolourise
● Shows that chloroplasts alone do not cause DCPIP to decolourise
Explain why DCPIP in control 1 stays blue.
● No light so no photoionisation of chlorophyll
● So no electrons released to reduce DCPIP
Explain the purpose of control 2 (tube B).
● Shows chloroplasts are required for DCPIP to decolourise
● Shows that light alone does not cause DCPIP to decolourise
Explain why DCPIP changes from blue to colourless.
● DCPIP is a redox indicator / DCPIP gets reduced by electrons
● From photoionisation of chlorophyll
Suggest a limitation with the method and how the experiment could be modified to overcome this.
● End point (colour change) is subjective
● Use a colorimeter
● Measure light absorbance of sample at set time intervals
● Zero colorimeter using the colour standard
Investigation into the effect of a named variable on the rate of respiration of cultures of single-celled organisms
Describe how a respirometer can be used to measure the rate of aerobic respiration
Measures O2 uptake:
1. Add a set mass of single-celled organism eg. yeast to a set volume / concentration of substrate eg. glucose
2. Add a buffer to keep pH constant
3. Add a chemical that absorbs CO2 eg. sodium hydroxide
4. Place in water bath at a set temperature and allow to equilibrate
5. Measure distance moved by coloured liquid in a set time
Explain why the liquid moves.
● Organisms aerobically respire → take in O2
● CO2 given out but absorbed by sodium hydroxide solution
● So volume of gas and pressure in container decrease
● So fluid in capillary tube moves down a pressure gradient towards organism
Explain why the respirometer apparatus is left open for 10 minutes.
● Allow apparatus to equilibrate
● Allow for overall pressure expansion/change throughout
● Allow respiration rate of organisms to stabilise
Explain why the apparatus must be airtight.
● Prevent air entering or leaving
● Would change volume and pressure, affecting movement of liquid
Describe a more accurate way to measure volume of gas.
● Use a gas syringe
Describe how the rate of respiration can be calculated
1. Calculate volume of O2 / CO2 consumed / released (calculate area of a cylinder)
a. Calculate cross-sectional area of capillary tube using π r2
b. Multiply by distance liquid has moved
2. Divide by mass of organism and time taken
3. Units - unit for volume per unit time per unit mass eg. cm3 min-1 g-1
Describe how a respirometer can be used to measure the rate of anaerobic respiration
Measures CO2 release:
● Repeat experiment as above but remove chemical that absorbs CO2
● Make conditions anaerobic, for example:
○ Layer of oil / liquid paraffin above yeast → stop O2 diffusing in
○ Add a chemical that absorbs O2
○ Leave for an hour to allow O2 to be respired and used up
Explain why the liquid moves.
● Yeast anaerobically respire → release CO2
● So volume of gas and pressure in container increase
● So fluid in capillary tube moves down a pressure gradient away from organism
Explain why the apparatus is left for an hour after the culture has reached a constant temperature.
● Allow time for oxygen to be used / respired
Describe how redox indicator dyes such as Methylene blue can be used to measure rate of respiration
1. Add a set volume of organism eg. yeast and a set volume of respiratory substrate eg. glucose to tubes
2. Add a buffer to keep pH constant
3. Place in water bath at a set temperature and allow to equilibrate for 5 mins
4. Add a set volume of methylene blue, shake for a set time (do not shake again)
5. Record time taken for colour to disappear in tube
Rate of respiration (s-1) = 1 / time (sec)
Redox indicators (eg. methylene blue) change colour when…
Redox indicators take up hydrogens and get reduced instead of…
they accept electrons becoming reduced
NAD / FAD → modelling their reactions
Give examples of variables that could be controlled.
● Volume of single-celled organism
● Volume / conc. / type of respiratory substrate
● Temperature (with a water bath)
● pH (with a buffer)
● Volume of redox indicator (only control)
Why leave tubes in the water bath for 5 minutes?
● Allow for solutions to equilibrate and reach the same temperature as the water bath
Describe a control experiment and why it would be done.
● Add methylene blue to boiled / inactive / dead yeast (boiling denatures enzymes)
● All other conditions the same
● To show change is due to respiration in organisms
Suggest and explain why you must not shake tubes containing methylene blue.
● Shaking would mix solution with oxygen
● Which would oxidise methylene blue / cause it to lose its electrons
● So methylene blue would turn back to its original blue colour
Suggest one source of error in using methylene blue. Explain how this can be reduced.
● Subjective as to determination of colour change / end point
● Compare results to a colour standard (one that has already
changed)
● Or use a colorimeter for quantitative results
Investigation into the effect of an environmental variable on the movement of an animal using either a choice chamber or a maze.
Describe how the effect of an environmental variable on the movement of an animal (eg. woodlice) can be investigated using a choice chamber
1. Set up choice chamber (different compartments) to create different environmental conditions
○ Eg. humidity → add a drying agent to one side and damp filter paper to other
○ Eg. light → shine a light but cover one half with black card
2. Control other environmental conditions
○ Eg. if investigating humidity control light intensity with a dim even light above
3. Use a teaspoon to place 12 animals eg. woodlice on centre of mesh platform and cover with lid
4. After a set amount of time eg. 10 minutes record the number of animals in each section
5. Repeat after gently moving woodlice back to centre
The woodlice were left for 15 minutes before their movement was recorded when investigating the effect of humidity. Explain why.
● Time to establish humidity / for substance to absorb water / water from paper to evaporate
● Woodlice no longer affected by handling
● So that behaviour is typical of that humidity
Explain how you would ensure the safe and ethical handling of animals.
● Safely - cover open wounds / wash hands with soap after
○ To minimise risk of infection
● Ethical - handle carefully / return to habitat ASAP
Explain why a mesh platform is used when investigating the effect of humidity.
● To keep woodlice a safe distance from drying agent
Describe how the effect of an environmental variable on the movement of an animal (eg. maggots) can be investigated using a maze
Mazes are used to investigate turning behaviour in response to different environmental conditions.
1. Change environment at one end of T shape eg. add food source
2. Place animal eg. maggot in stem of T
3. Record whether animal turns towards or away from food source
4. Repeat with a large number of maggots
○ Wipe / clean maze between trials 5. Repeat with food on other side of T
Explain why the same organism is not used more than once.
● Reduces stress on maggots
● Prevents chance of learned behaviours
Explain why a clean petri dish / maze is used each time.
● Animals may leave chemicals / scents
● Which influence behaviour of other animals
Explain which statistical test should be used to analyse results
● Chi-squared
● As data are categorical and comparing frequencies
● To see if there is a significant difference between observed and expected frequencies
○ Expected = equal numbers each side
Production of a dilution series of a glucose solution and use of colorimetric techniques to produce a calibration curve with which to identify the concentration of glucose in an unknown ‘urine’ sample.
Describe how a calibration curve could be produced for glucose
Note - the calibration curve will vary eg. if precipitate was removed before using the colorimeter.
1. Use distilled water and a glucose solution of known concentration to produce a dilution series (of glucose solutions of known concentrations)
2. Heat a set volume of each solution with a set volume of Benedict’s solution
3. Measure absorbance (of light) of each solution using a colorimeter
4. Plot a graph of absorbance (y axis) against concentration of glucose solution (x axis) and draw a line / curve of best fit
Describe how the concentration of glucose in an unknown ‘urine’ sample can be identified using a calibration curve
1. Perform Benedict’s test on sample using same volumes of solutions used in producing calibration curve
2. Measure absorbance using a colorimeter
3. Absorbance value for ‘urine’ sample read off calibration curve to find associated glucose concentration
Give examples of variables that should be controlled.
● Volume of sample used
● Volume of Benedict’s solution
● Temperature of water bath
● Time samples were heated for in water bath
Explain why a high blood glucose concentration can cause glucose to be present in the urine of a diabetic person.
● Not all glucose reabsorbed at proximal convoluted tubule
● As glucose carrier / co transporter proteins are saturated / working at maximum rate
Investigation into the effect of a named environmental factor on the distribution of a given species.
Describe how you could investigate the effect of an environmental factor on the distribution of a species in a habitat (random sampling in two areas)
1. Divide two areas into grids / squares eg. place 2 tape measures at right angles
2. Generate a pair of coordinates using a random number generator (eg. on a calculator)
3. Place a quadrat here and count number / frequency of [named species]
○ Standardise this eg. only count it if it is more than half in the quadrat
4. Repeat a large number of times (20 or more) and calculate a mean per quadrat for both areas
5. Measure environmental factor in each area eg. take soil moisture readings with a soil moisture meter
Suggest why percentage cover may be used rather than frequency.
● Too difficult to count individual organisms / individual organisms are too small to count
Explain why random sampling is used.
Explain the importance of a large sample size
● To avoid sampling bias
● Minimises the effect of anomalies
● Ensures sample is representative of the population
Describe how you could decide the number of quadrats that should be used in order to collect representative data.
● Calculate a running mean
● When enough quadrats, this shows little change
● Enough to carry out a statistical test
Describe how you could investigate the effect of a factor on the distribution of a species in a habitat (systematic sampling)
1. Place a transect line (tape measure) across an area with an environmental gradient eg. tree to full sun
2. Place quadrats at regular intervals eg. 1m (until end of transect) and record the number of organisms of
[named species] and [named environmental factor] eg. light intensity using a light meter
3. Repeat in other parallel areas and calculate mean number of plants at each point along the transect
Explain the limitations of using systematic sampling to estimate the population of a species in a field.
● Not appropriate unless there is an environmental gradient
● Transects run in one direction, but to cover the entire field, they would need placing in multiple directions
Which statistical test should be used to determine the relationship between abundance and an environmental factor?
● Correlation coefficient eg. Spearman’s rank