STATS midterm 2
1/89
There's no tags or description
Looks like no tags are added yet.
Name | Mastery | Learn | Test | Matching | Spaced | Call with Kai |
|---|
No analytics yet
Send a link to your students to track their progress
90 Terms
implied probability
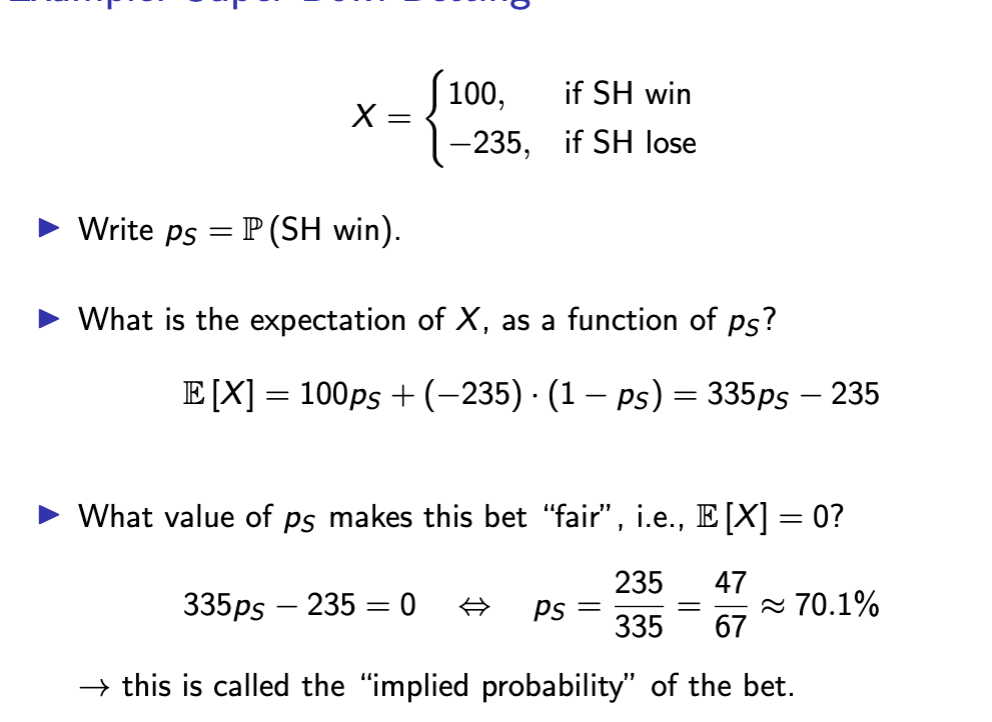
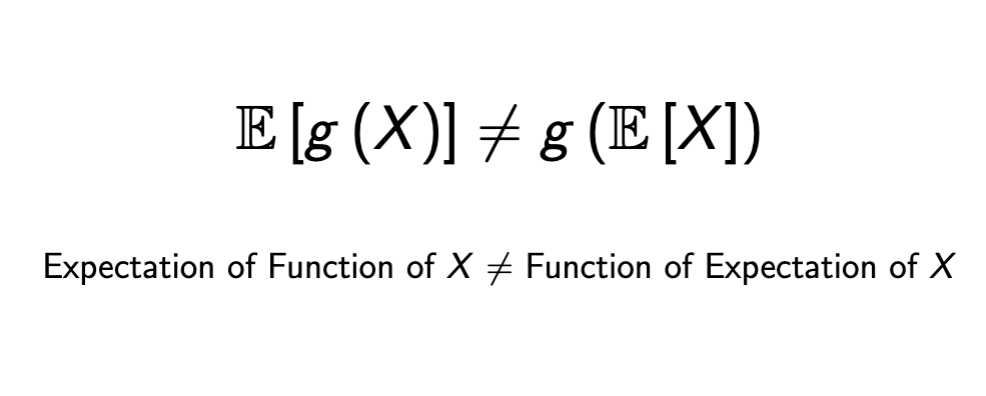
expectation vs function
variance and sd are not
linear
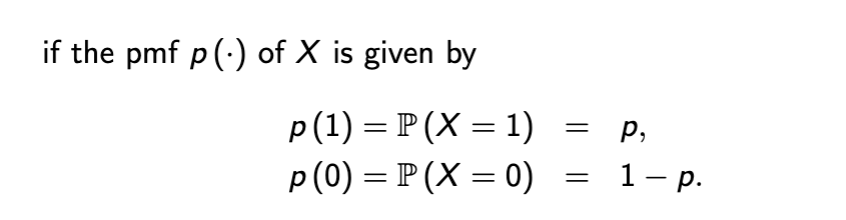
bernoulli pmf
bernoulli expectation + var
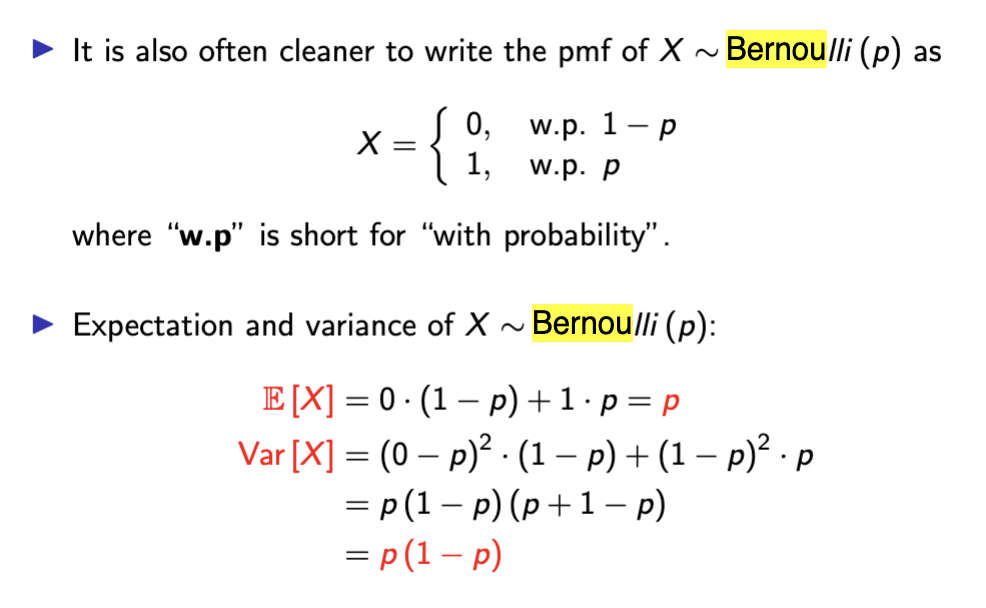
bernoulli explanation
Simplest RV with only 2 outcomes, control parameter p to see probability of success
building block of discrete probability, modeled as X ~ Bernoulli(p)
E[X] = p will tell you probability of success, p also says expected value
variance p(1 - p) captures max uncertainty in middle of distribution
joint pmf properties
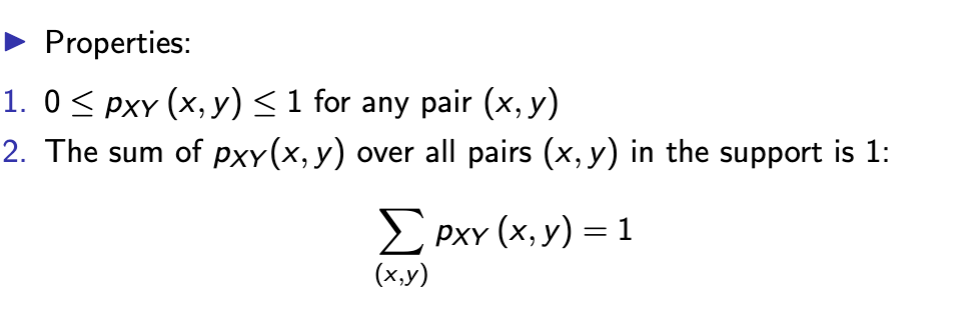
you cannot calculate joint pmf of (X , Y ) from the marginals
but you can calculate the marginals from the joint!
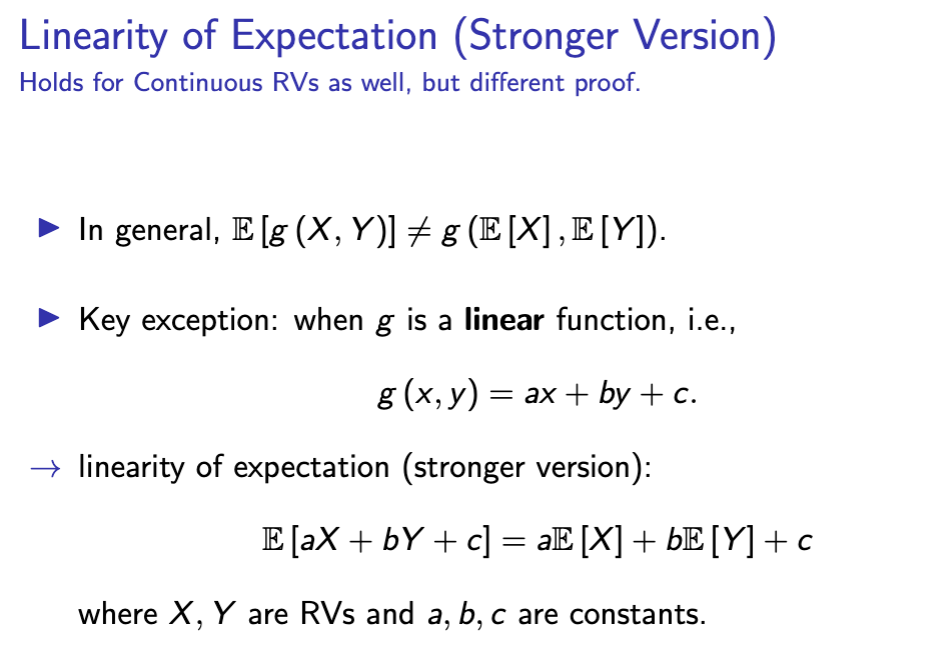
strong linearity
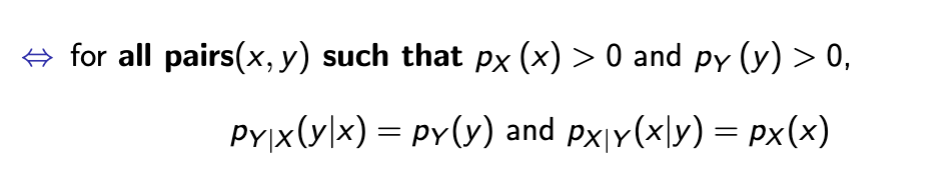
if x and y are independent correlation is
0
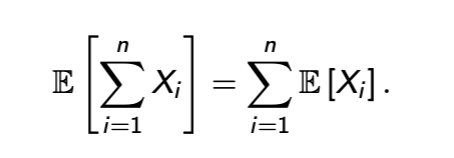
expectation of sum = sum of expected values
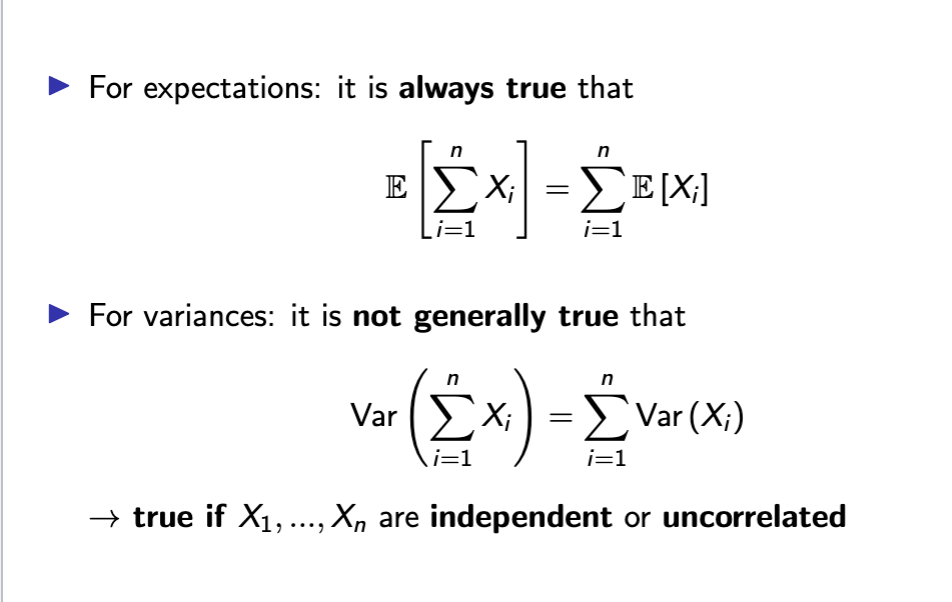
expectation v variance rule
conditional independence
changes for continuous RVs
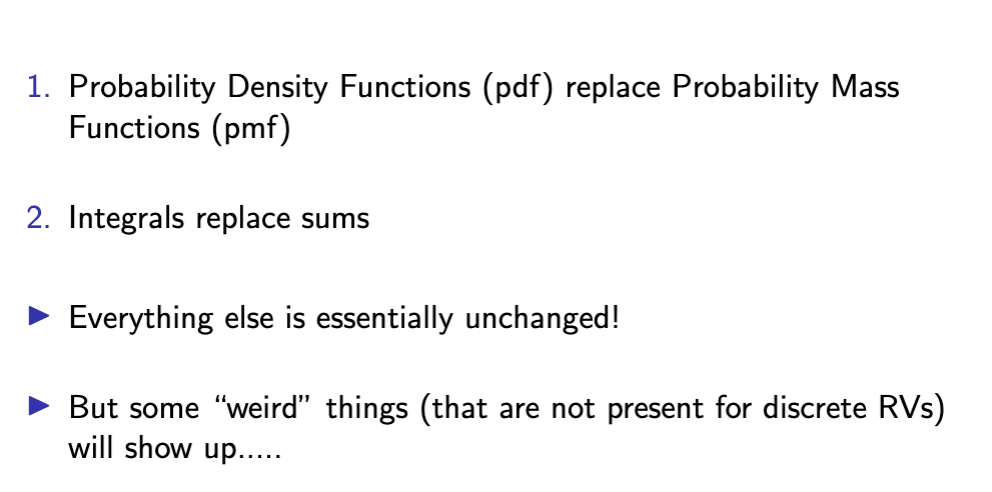
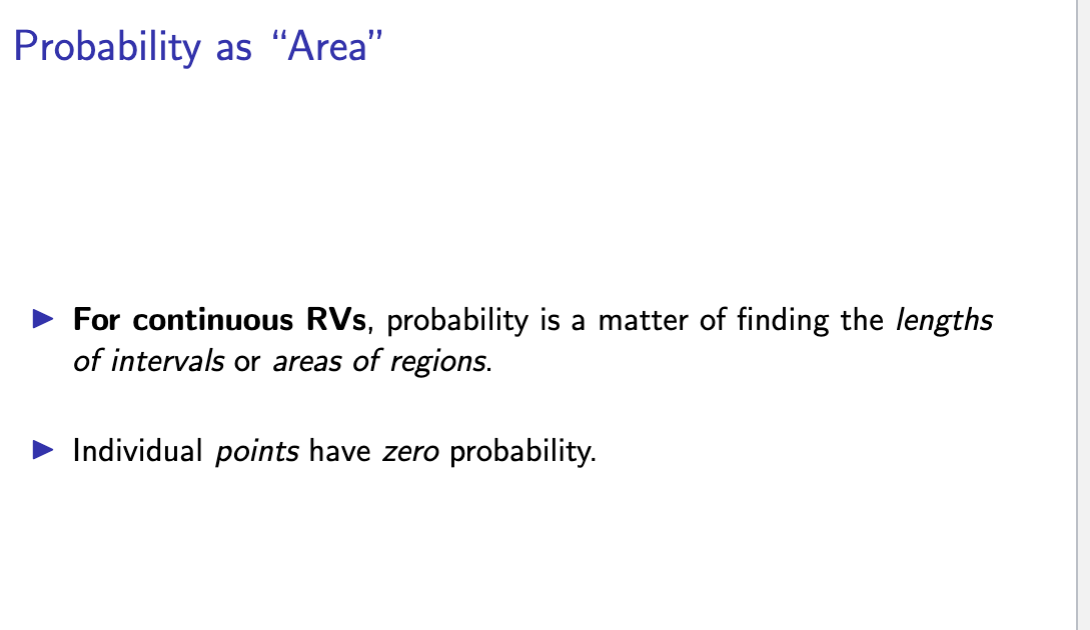
continuous probability
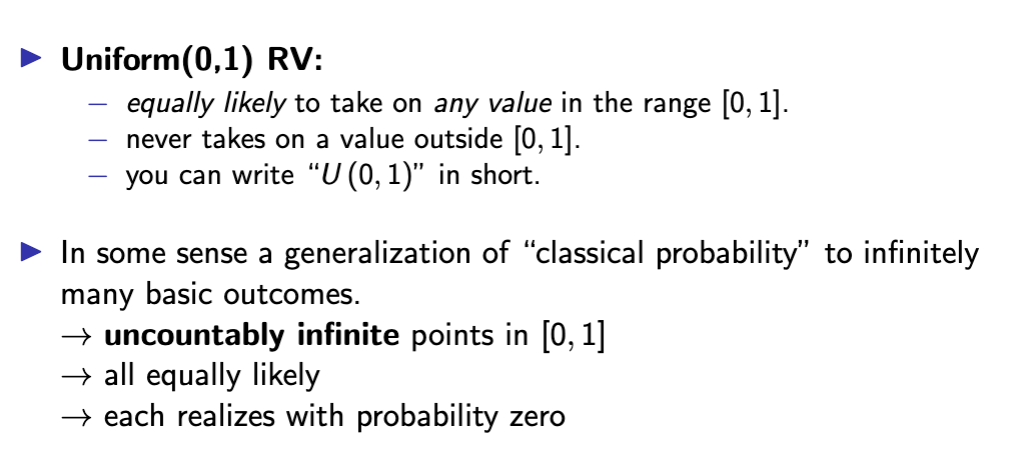
uniform 0,1 RV
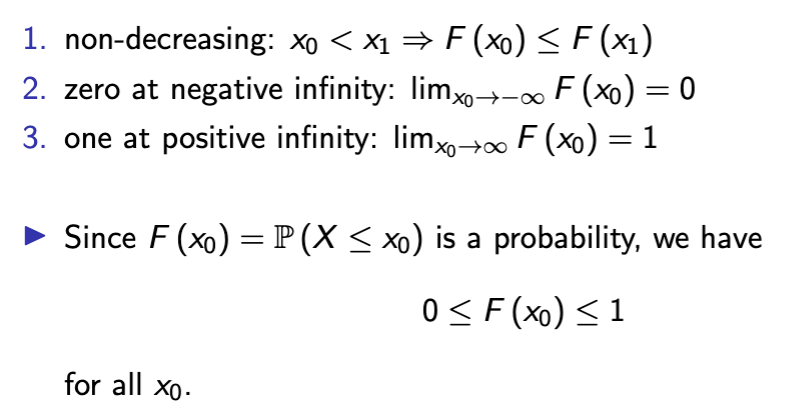
properties of CDF
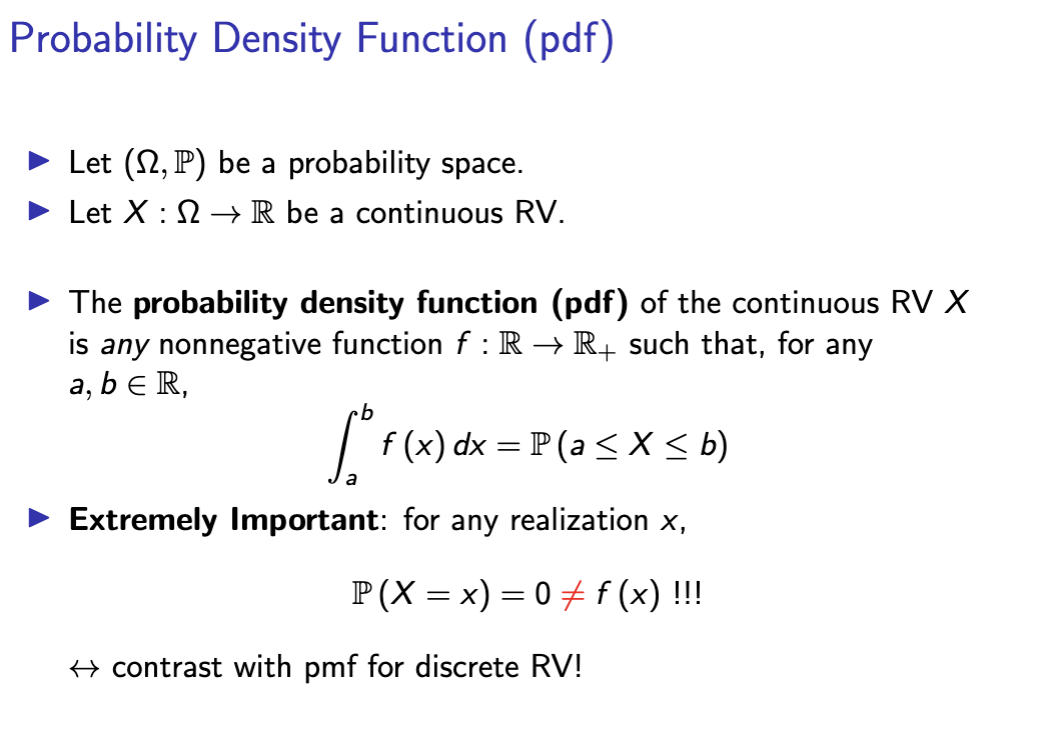
probability density function
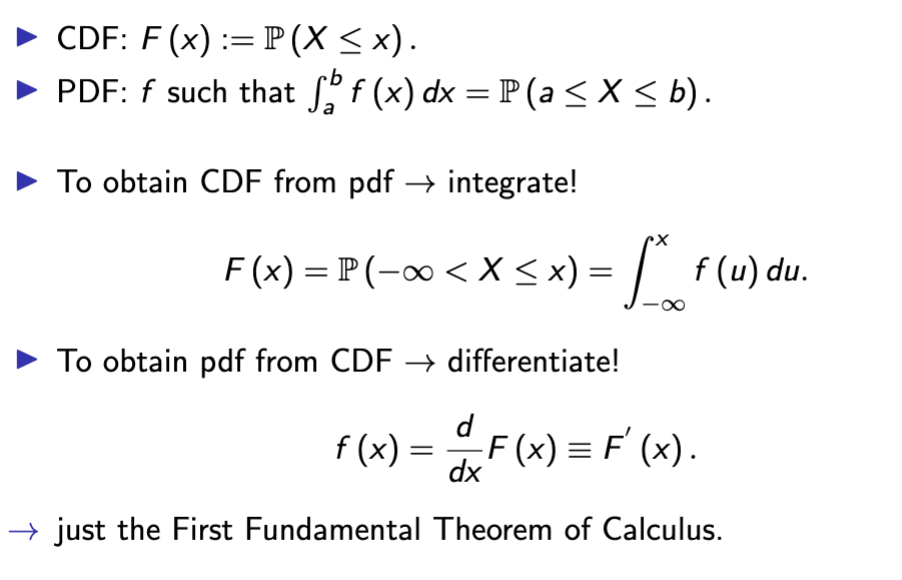
pdf and cdf
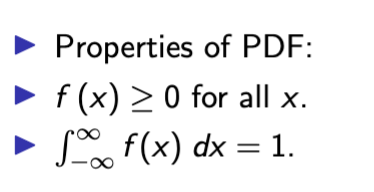
pdf properties
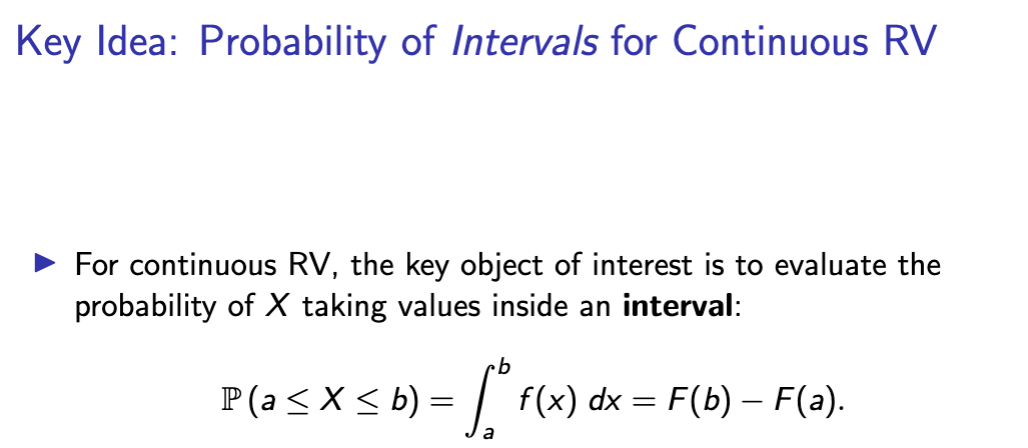
probability of intervals in continuous RV
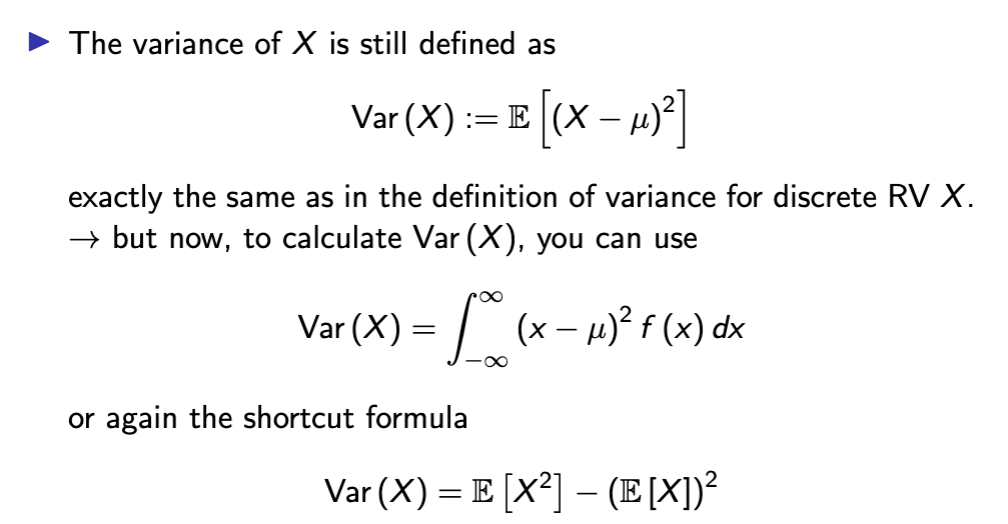
variance continuous RV
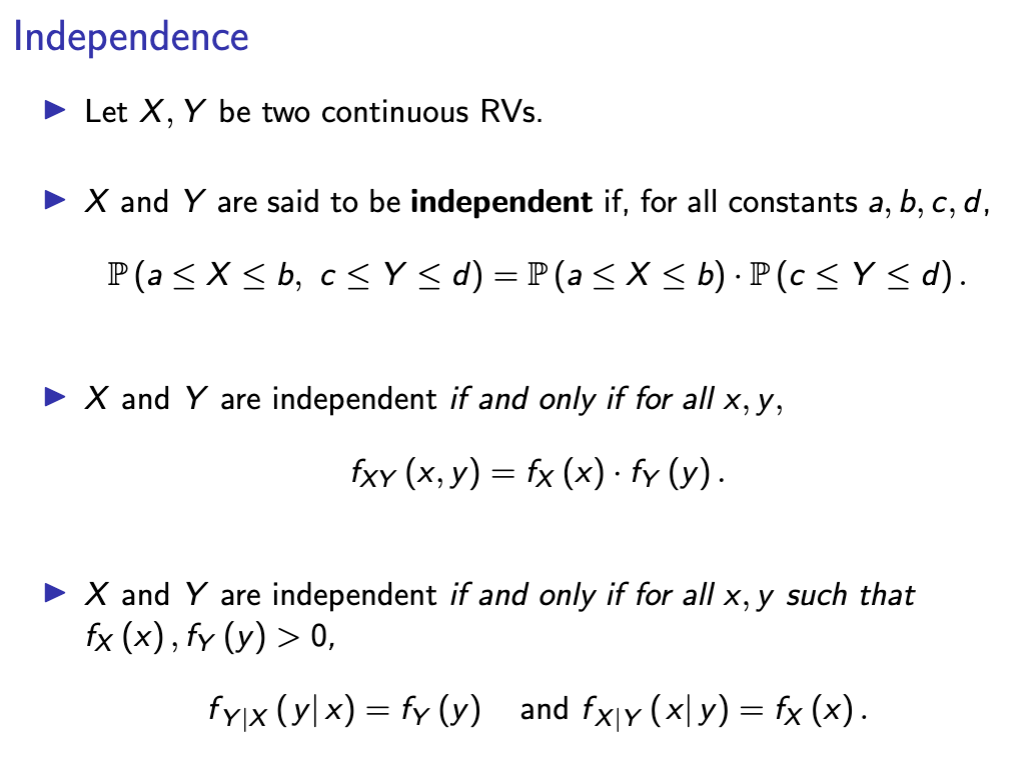
continuous independence
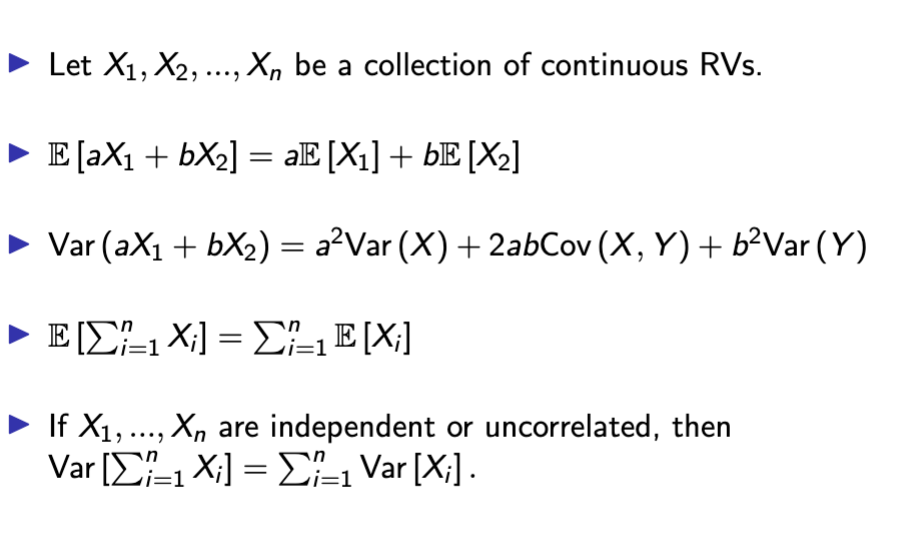
expectation rules for multiple RVs
standard normal distribution X~N(0,1)
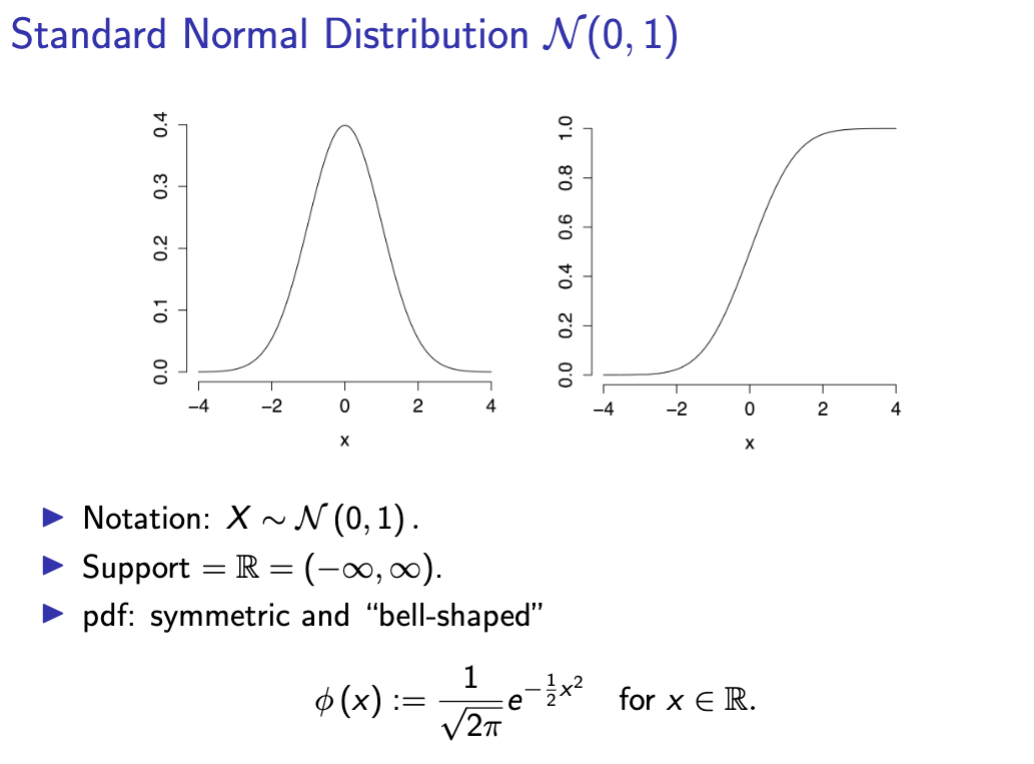
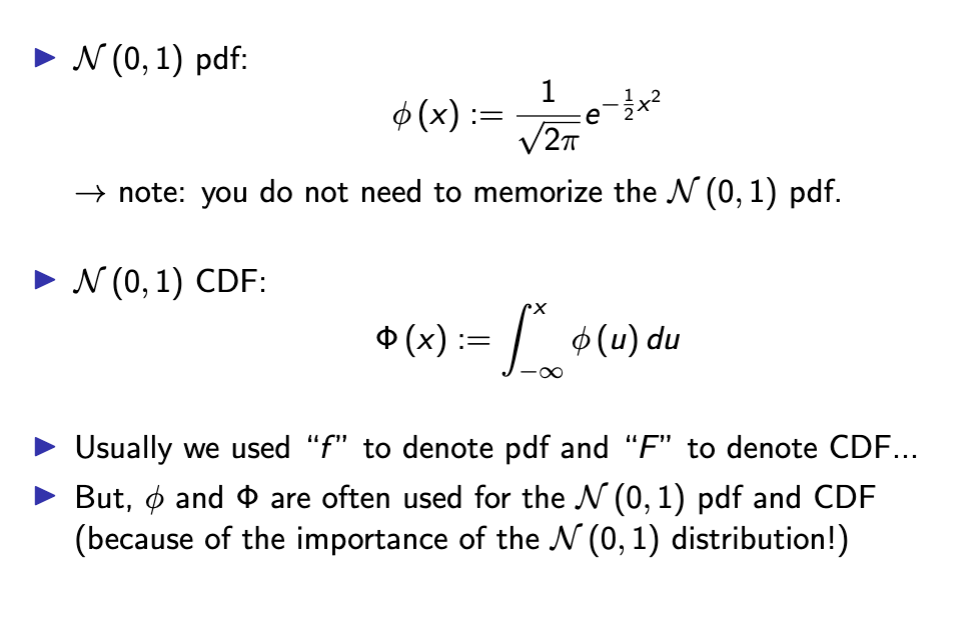
N(0, 1) PDF and CDF notation
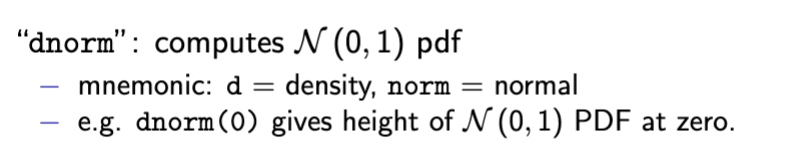
dnorm for N(0,1)
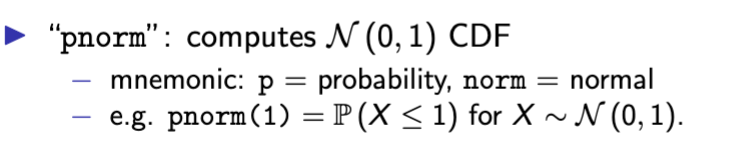
pnorm N(0,1)
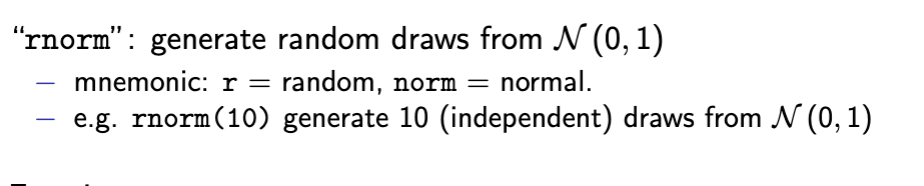
rnorm N(0,1)
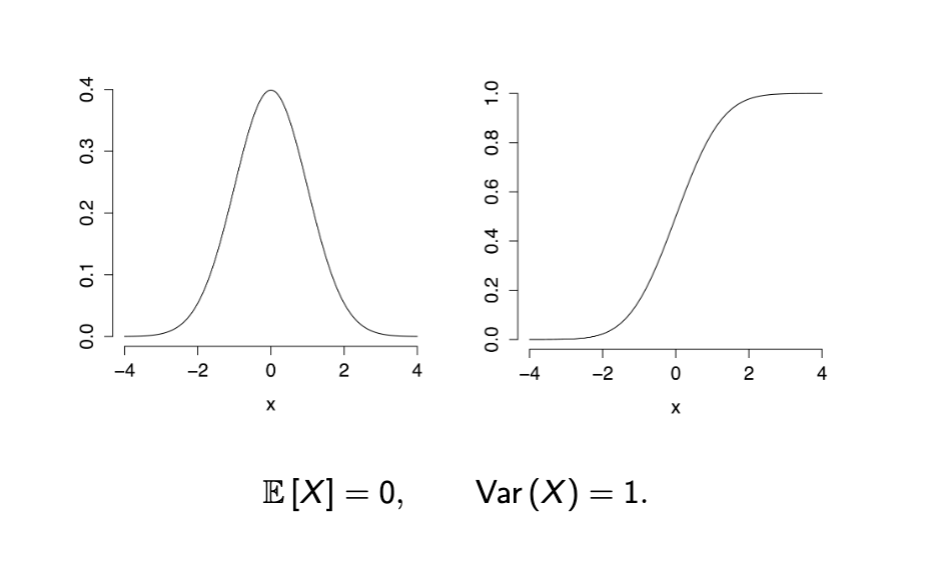
expectation and variance N(0,1)
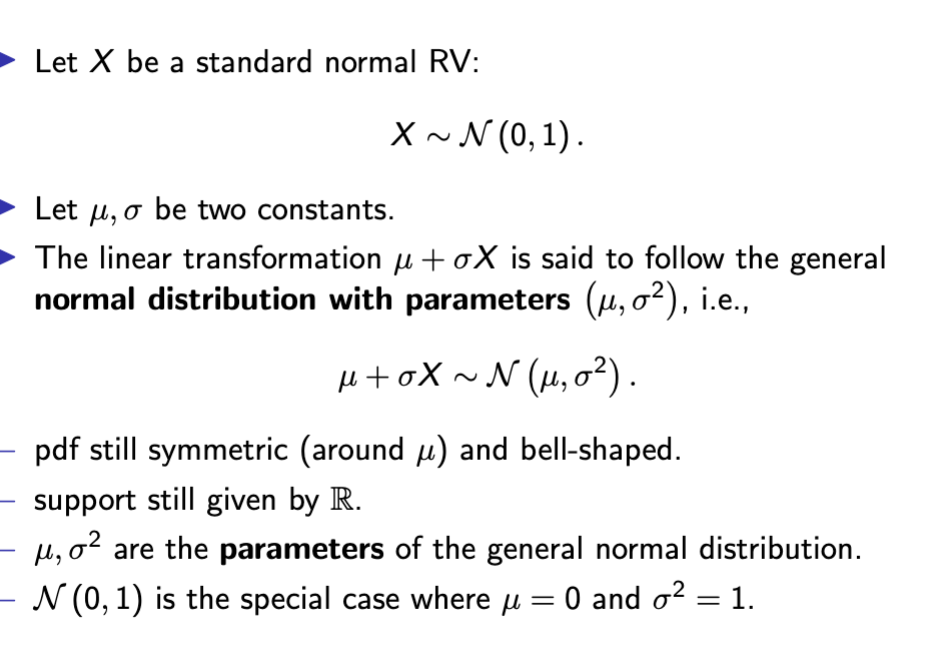
general normal dist N(0, 1)
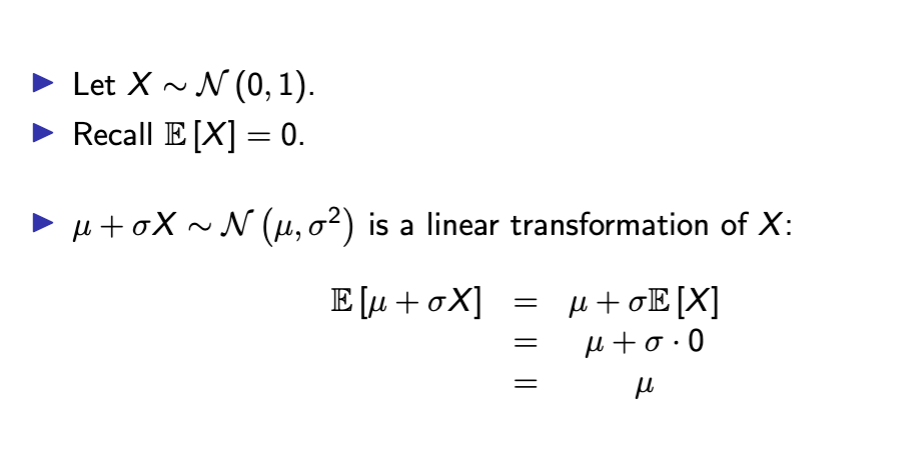
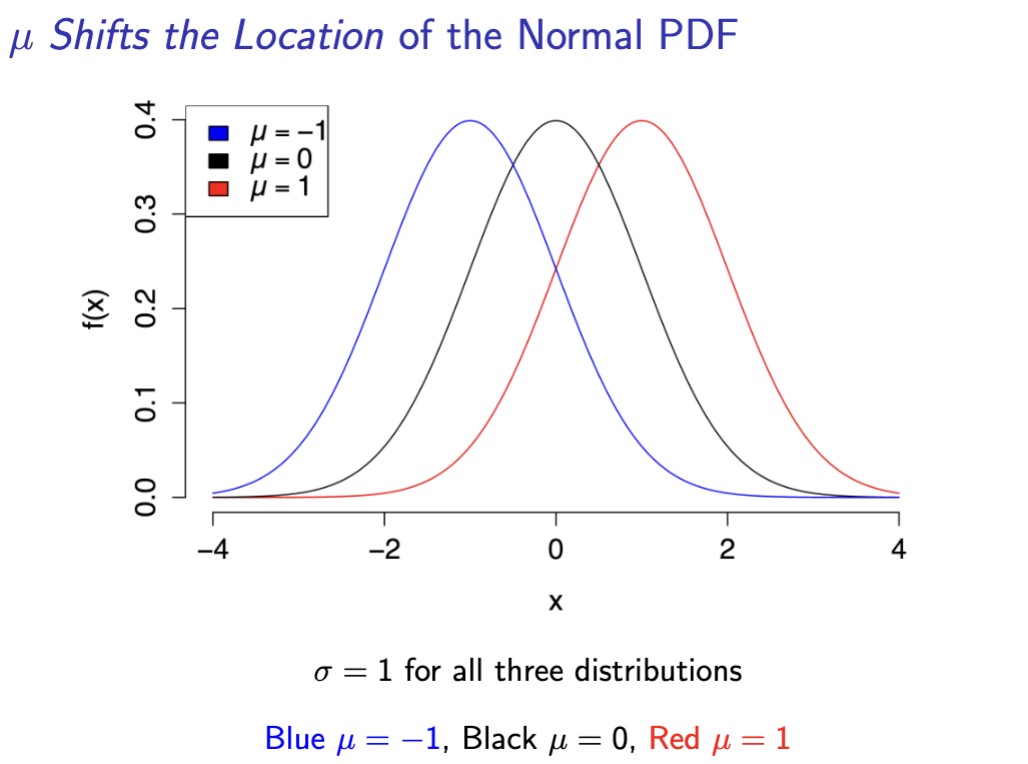
mew as expectation
location shift normal pdf
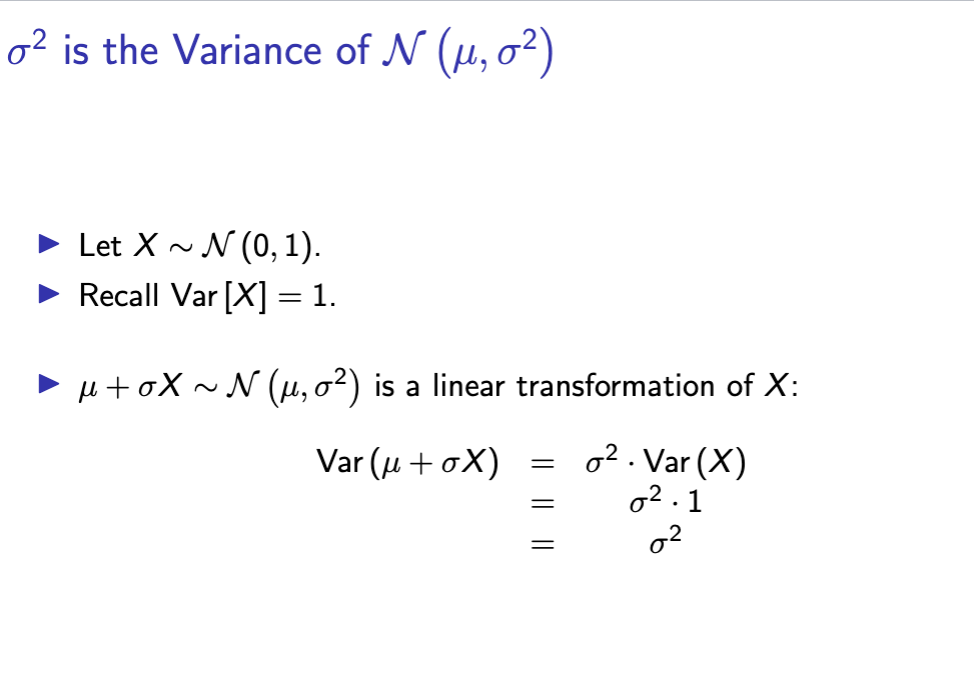
sigma variance
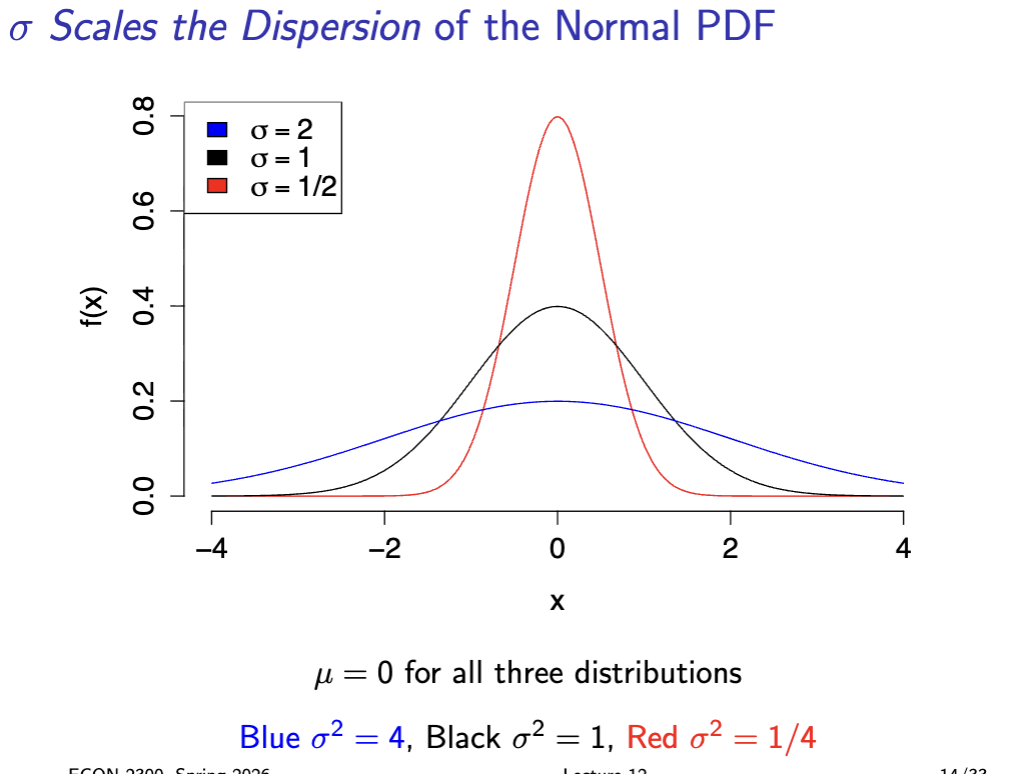
sigma dispersion
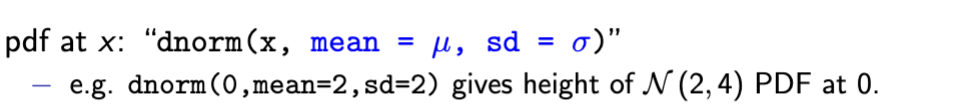
N mew sigma pdf
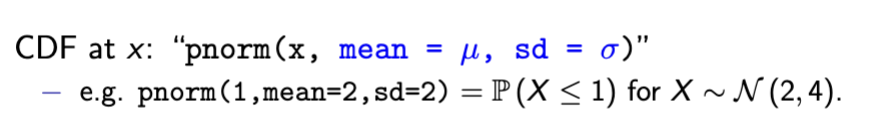
n mew sigma cdf
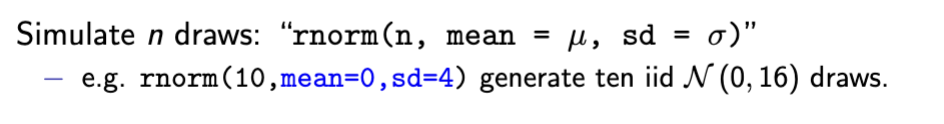
n mew sigma draws
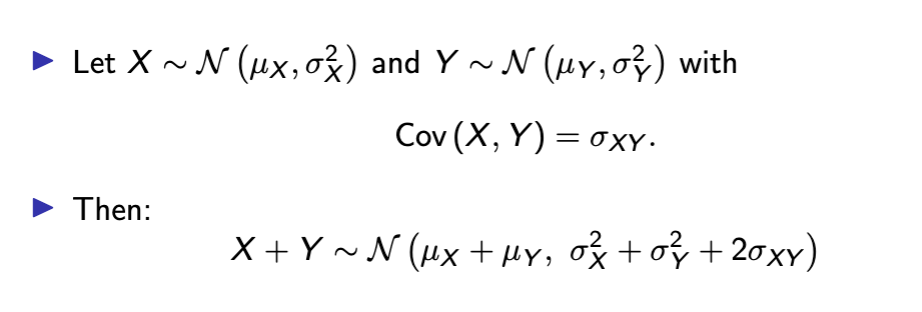
sum of multiple normal RVs is normal
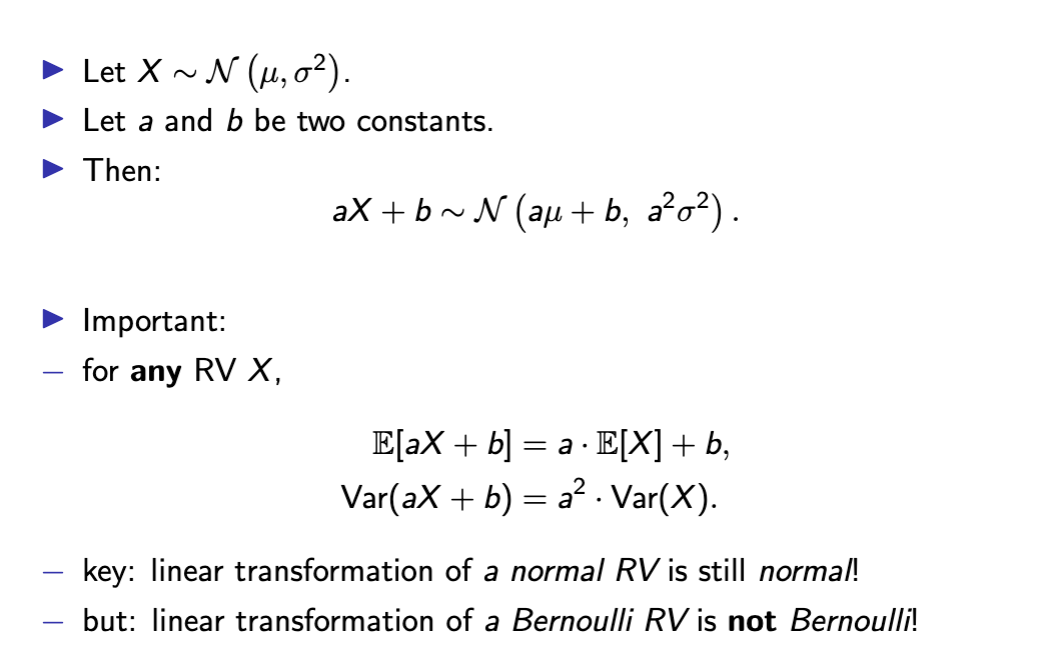
linear function of normal RV
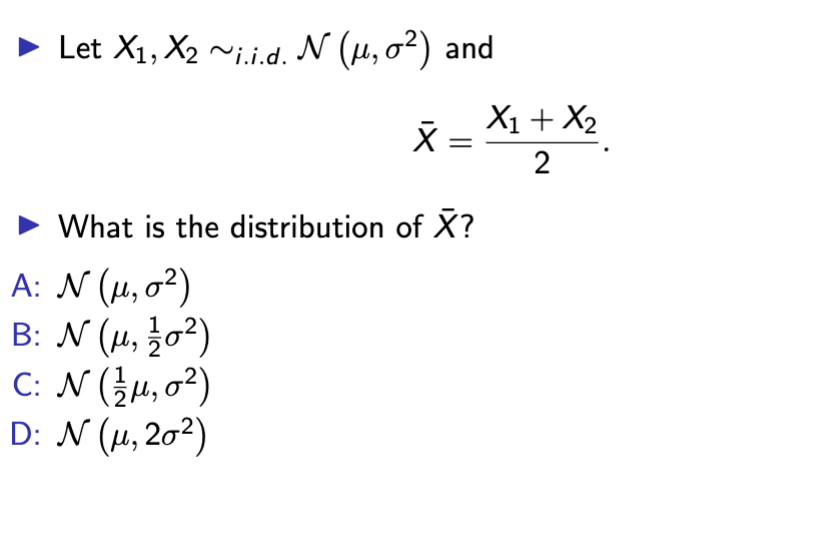
answer is B
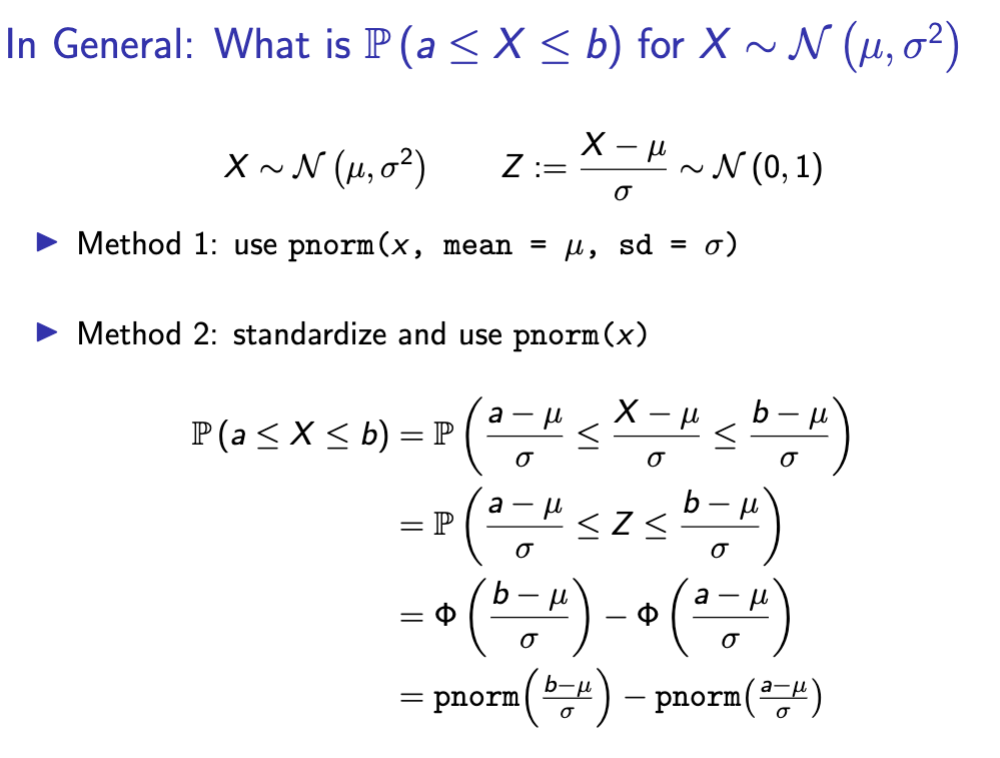
interval probability of N mew sigma
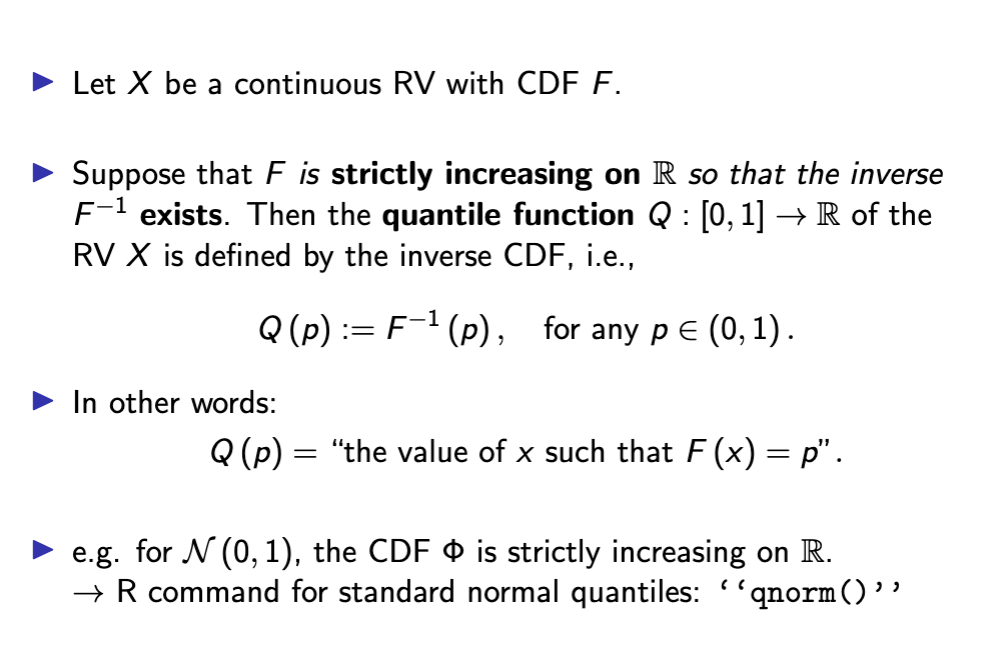
quantiles of continuous RVs
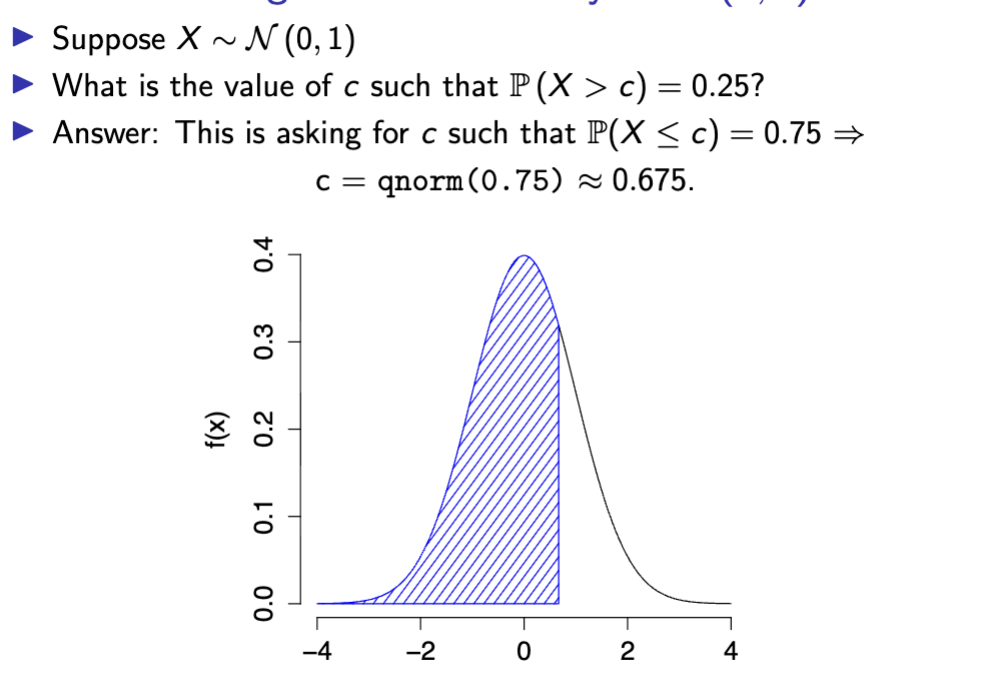
Threshold right tail probability N(0,1)
symmetric intevals N01 RV
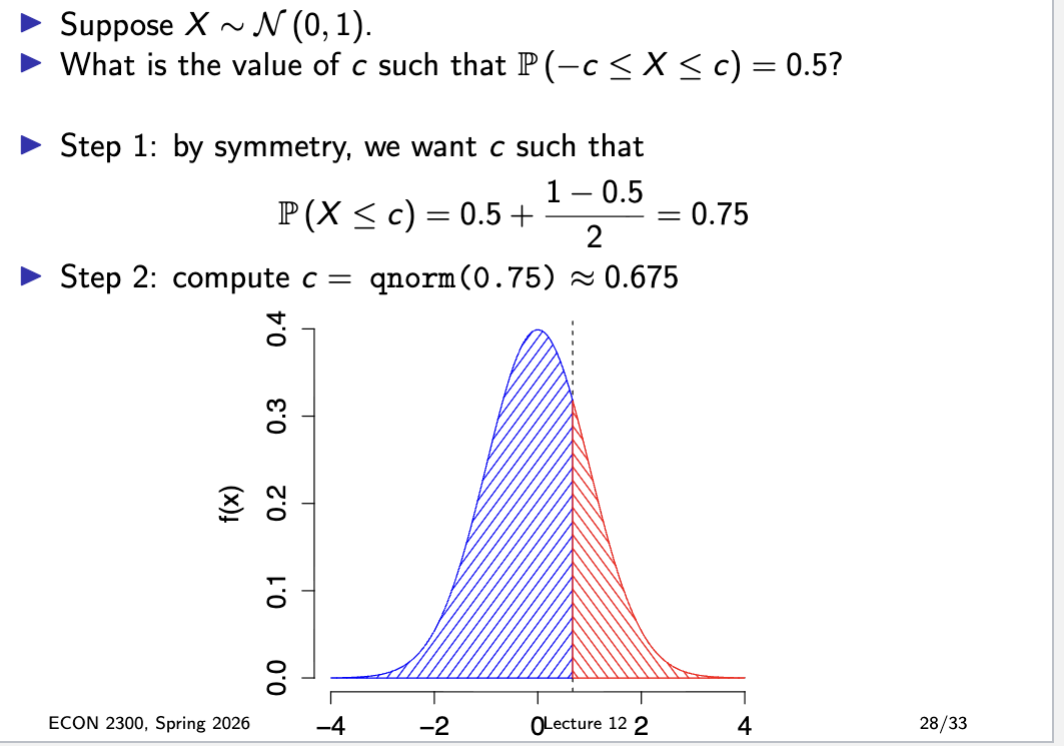
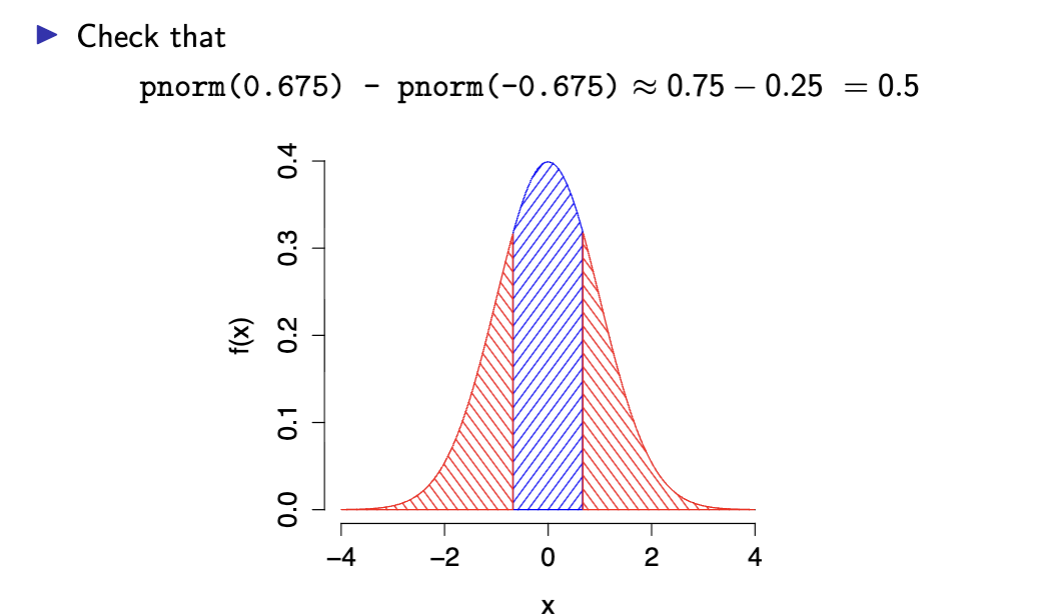
check
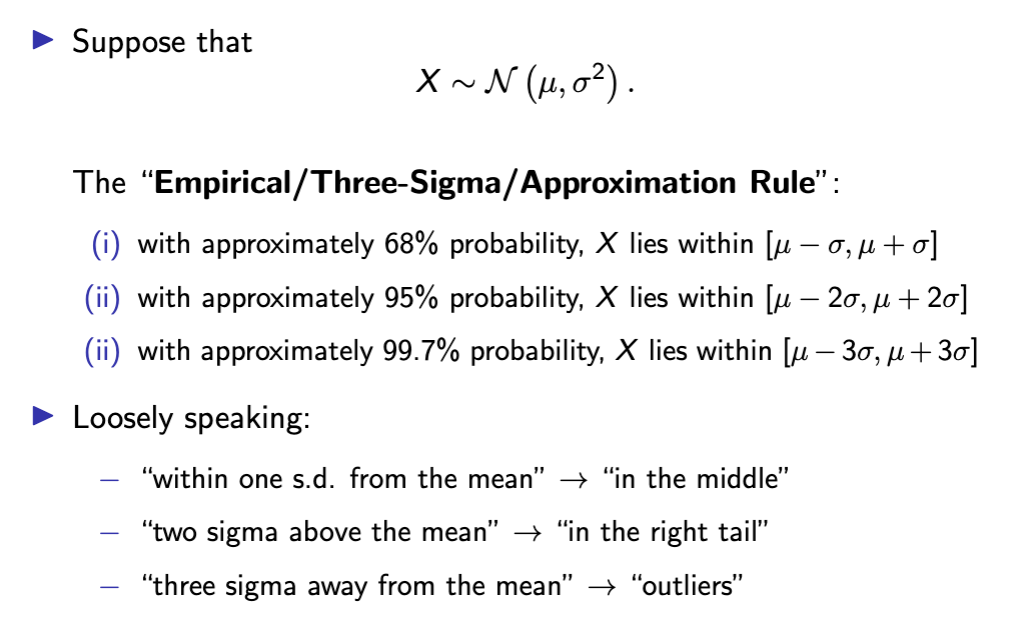
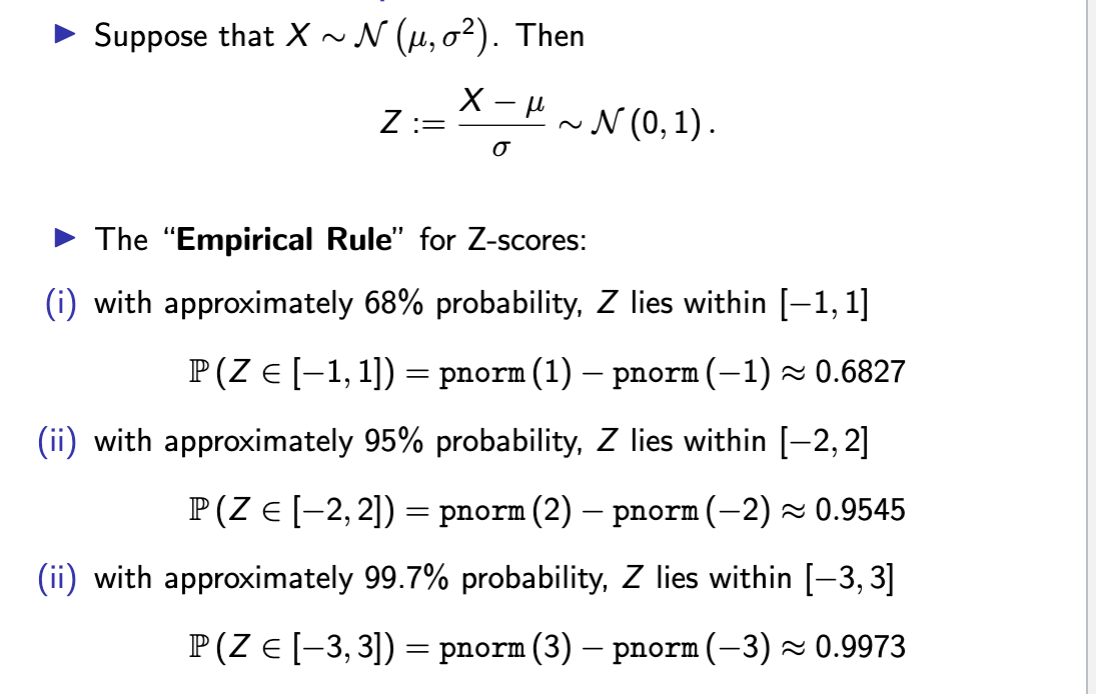
3 sigma rule
z score 3 sigma
iid
independent and individually distributed
mutually independent and same identity distribution
sample stats
combine summary stats and probability theory
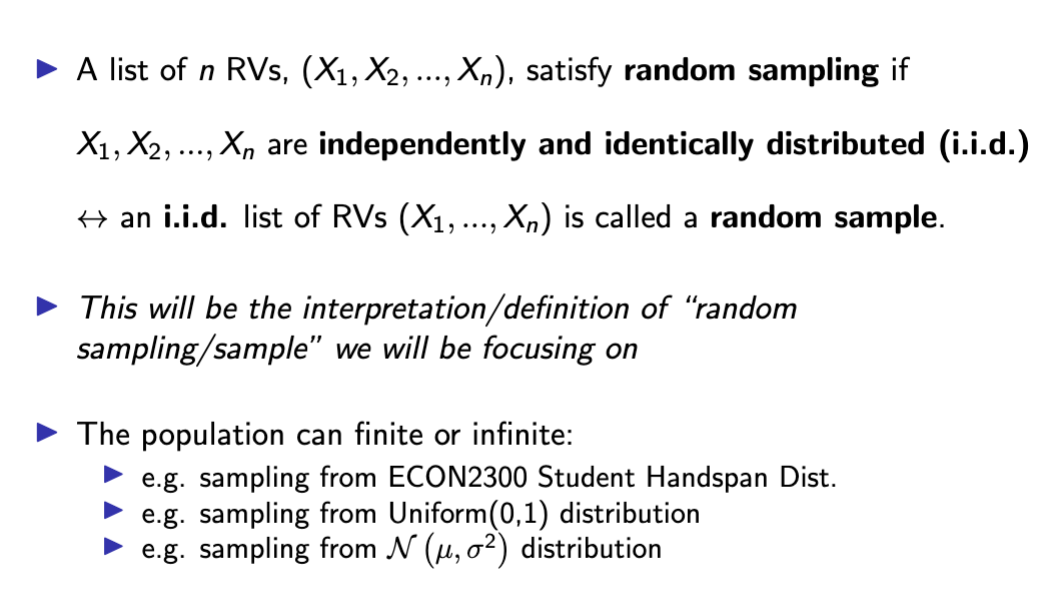
random sampling
“equally-likely sampling with replacement”, i.e.
(i) each unit of the population is equally likely to be selected;
(ii) each selection is independent from other selections.
random sampling as iid rvs
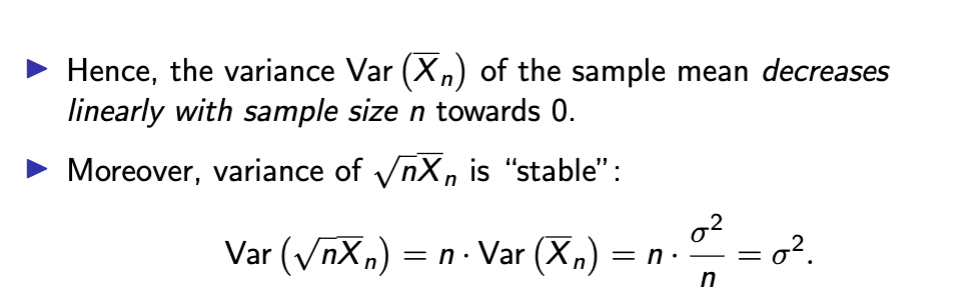
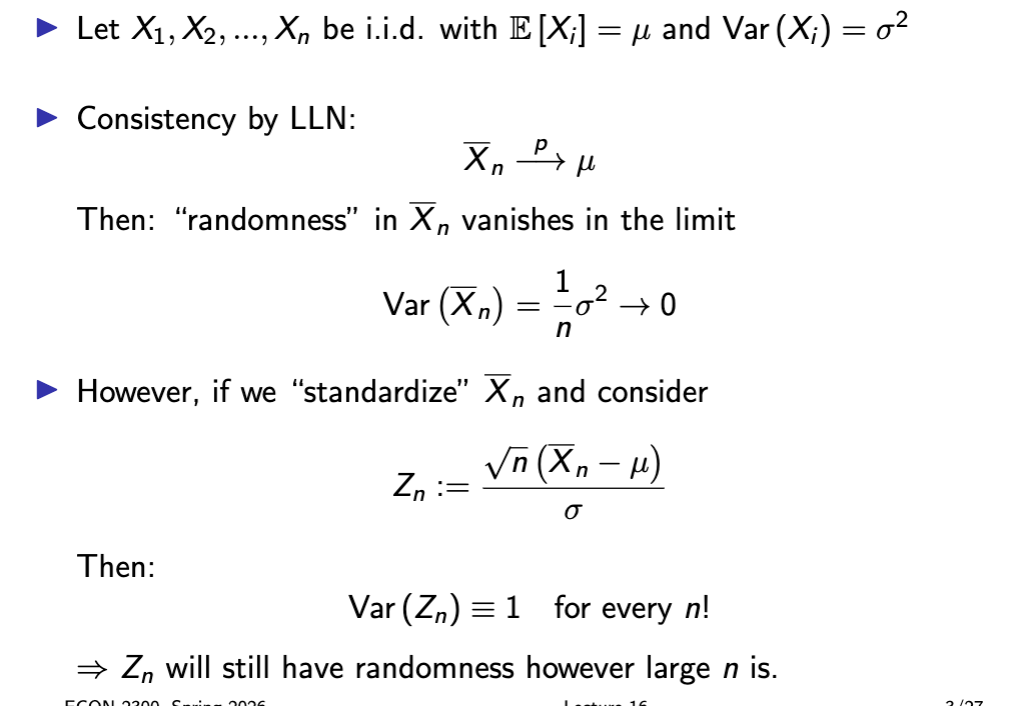
var x bar n
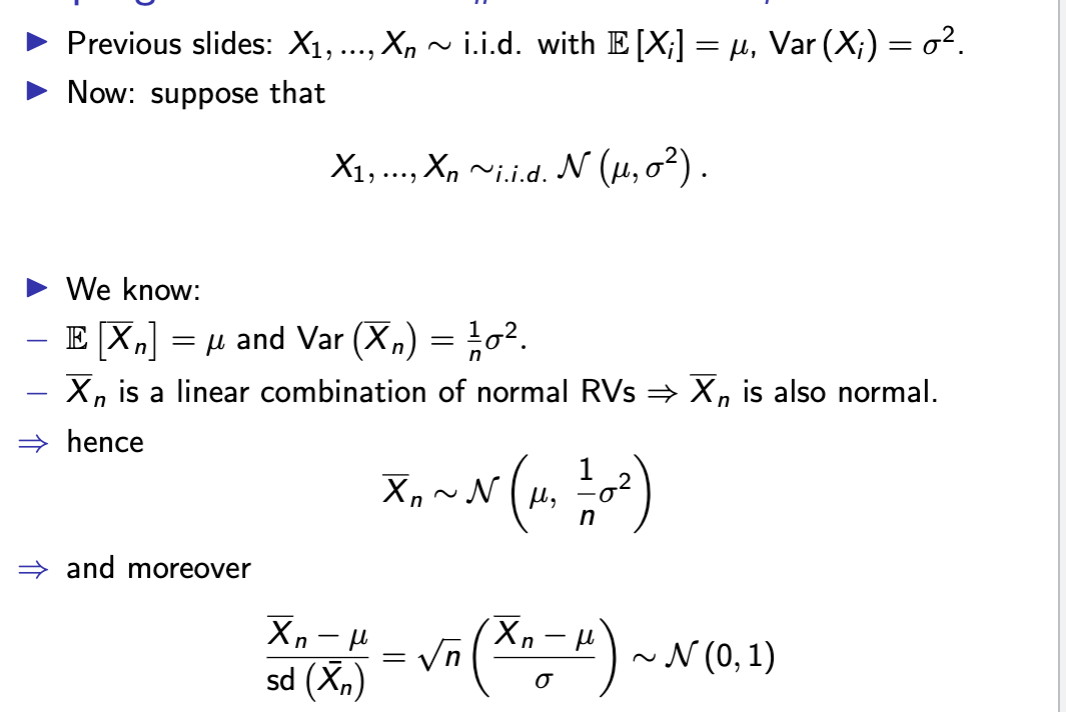
sampling dist x bar n
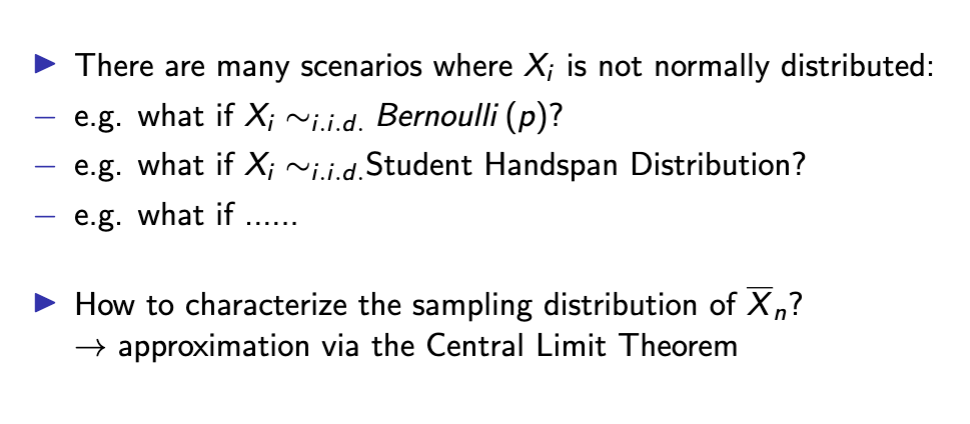
sample dist x bar n w/o normality
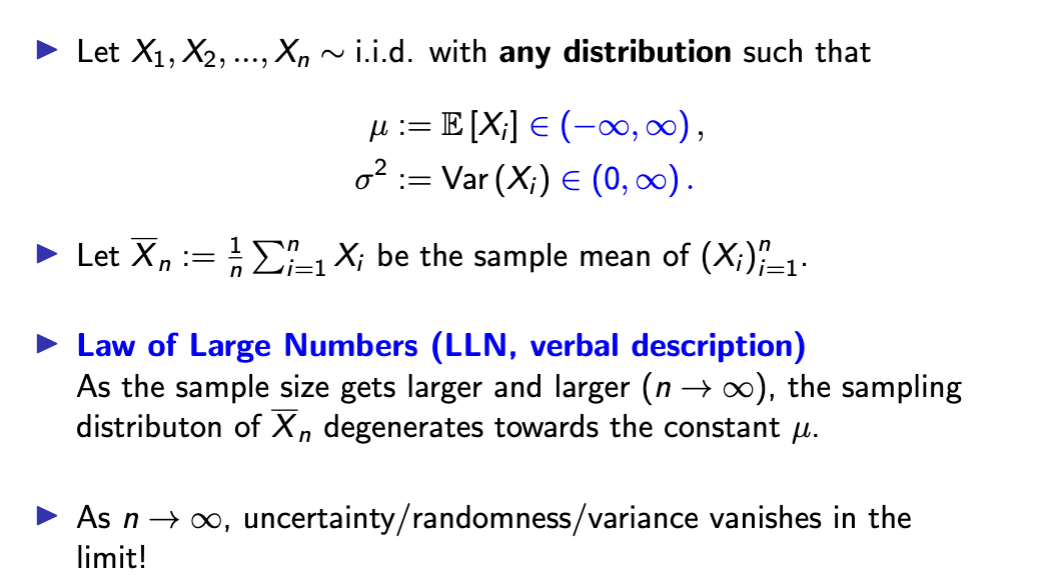
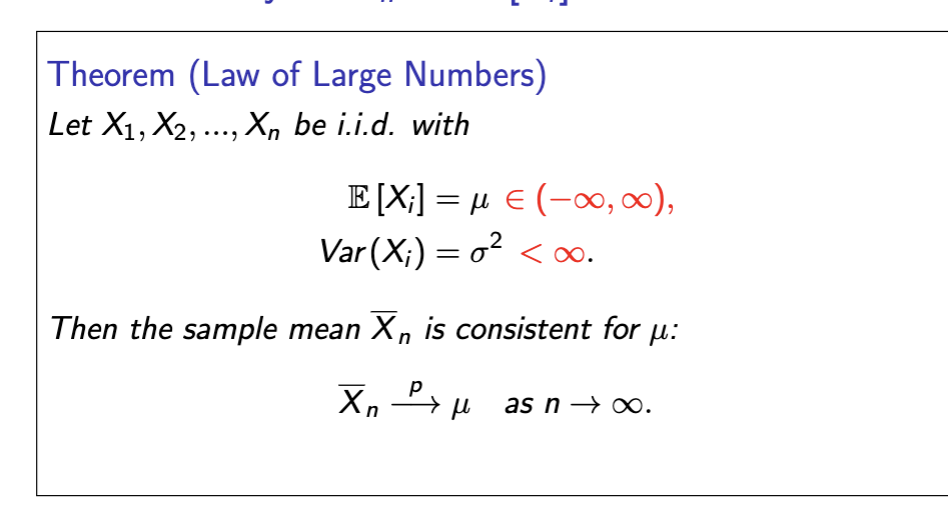
law of large numbers
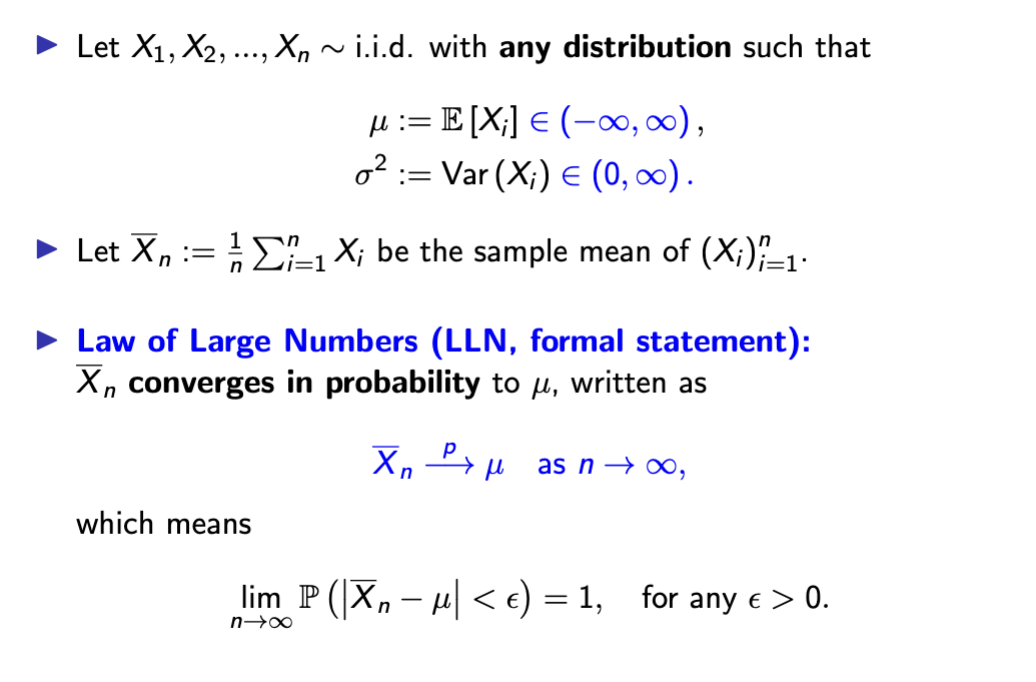
formal LLN
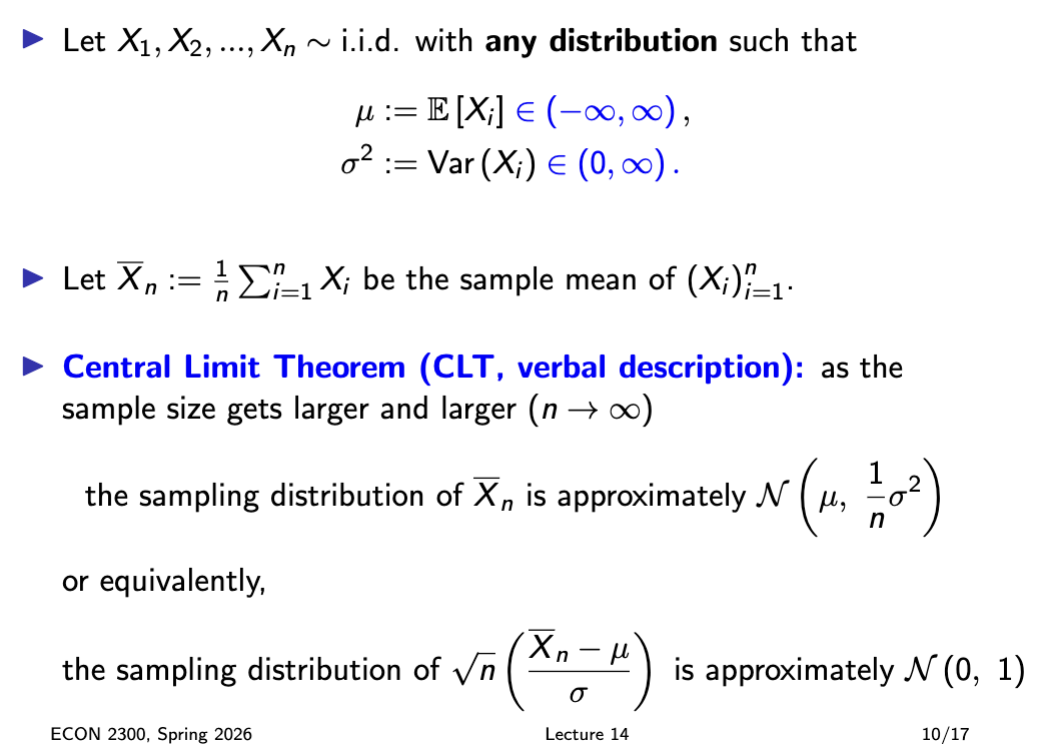
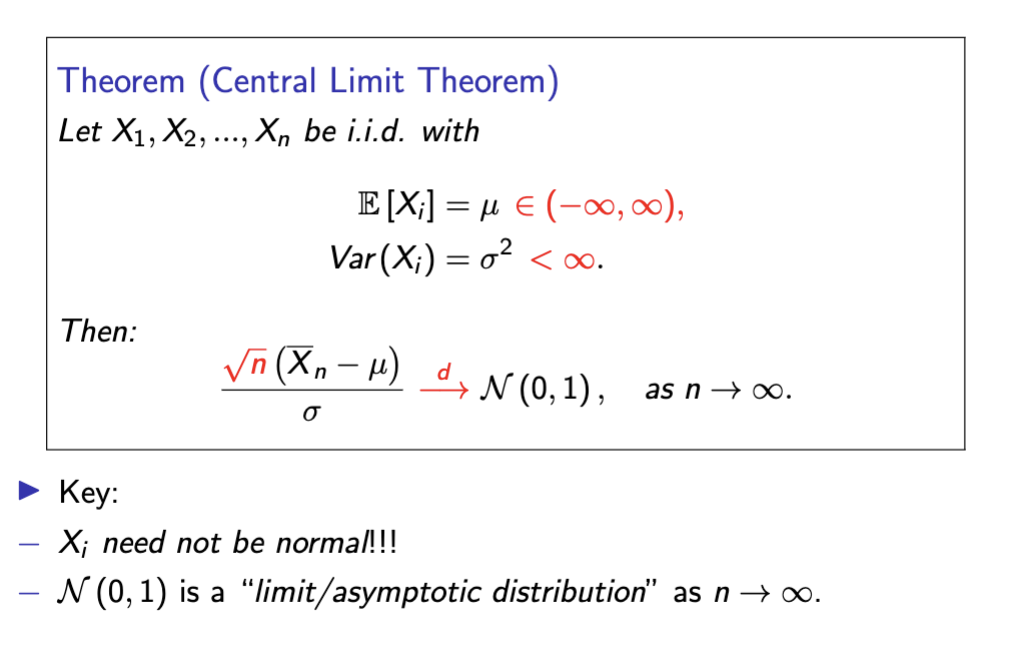
central limit theorem
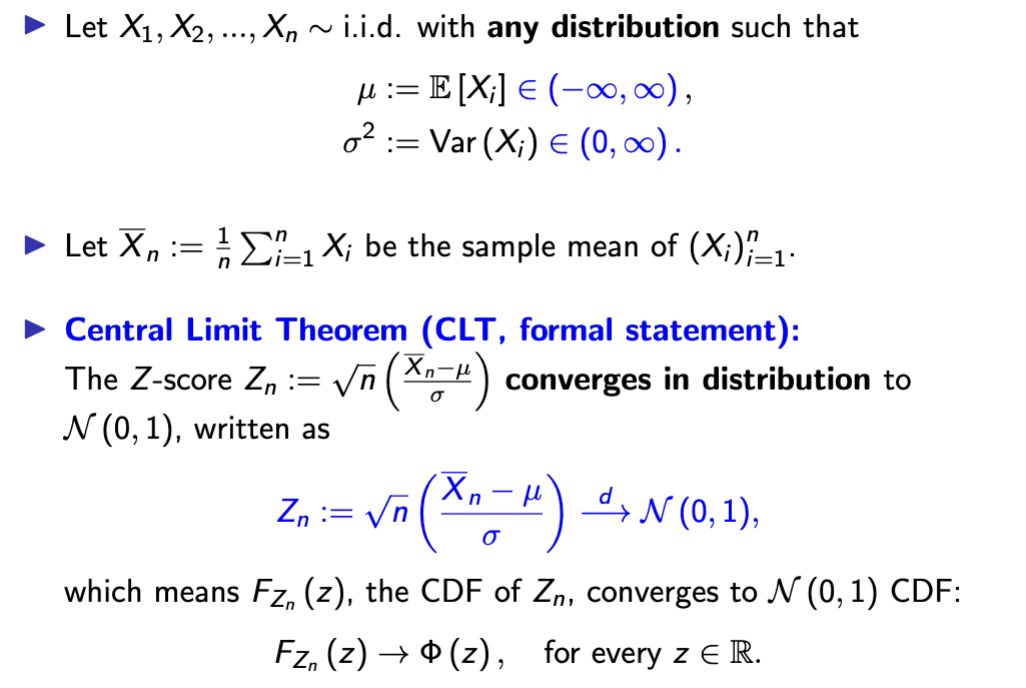
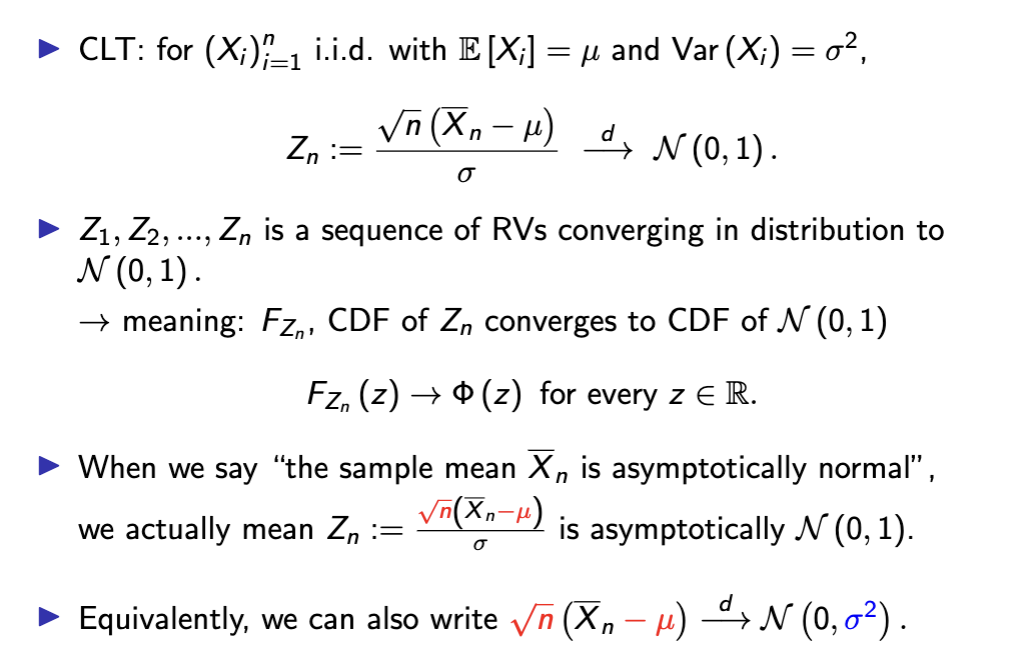
formal CLT
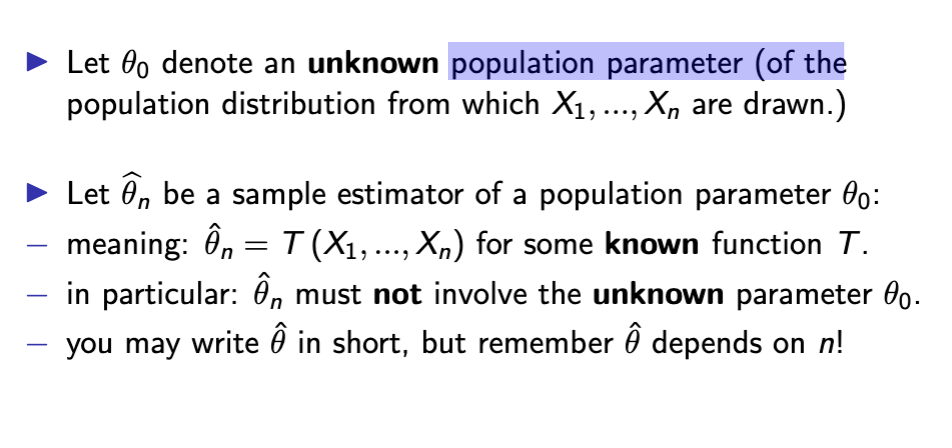
estimator
description of a general procedure
estimate
output of procedure
sample mean x bar n is estimator
of expectation mew
parameter and estimator
sample variance uses
1/(n - 1)
variance estimator
The variance of bθ is just the variance of ˆθ as a RV.
▶ Var bθ is defined without reference to the true parameter θ0.
↔ compare with the definition of bias, which involves θ0.
estimator efficiency
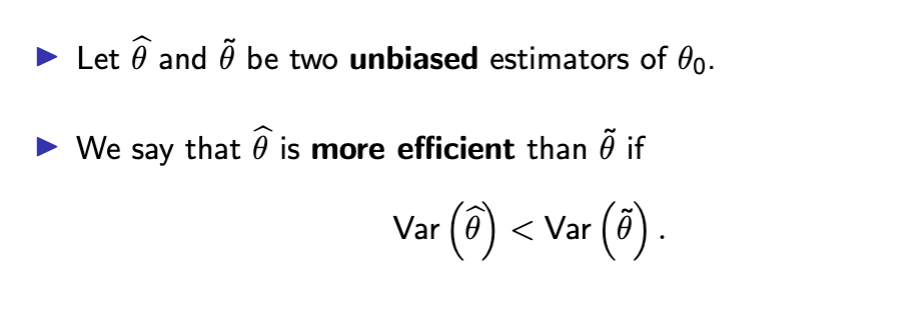
tradeoff between bias and variance:
− low bias estimators often have a high variance
− low variance estimators often have high bias
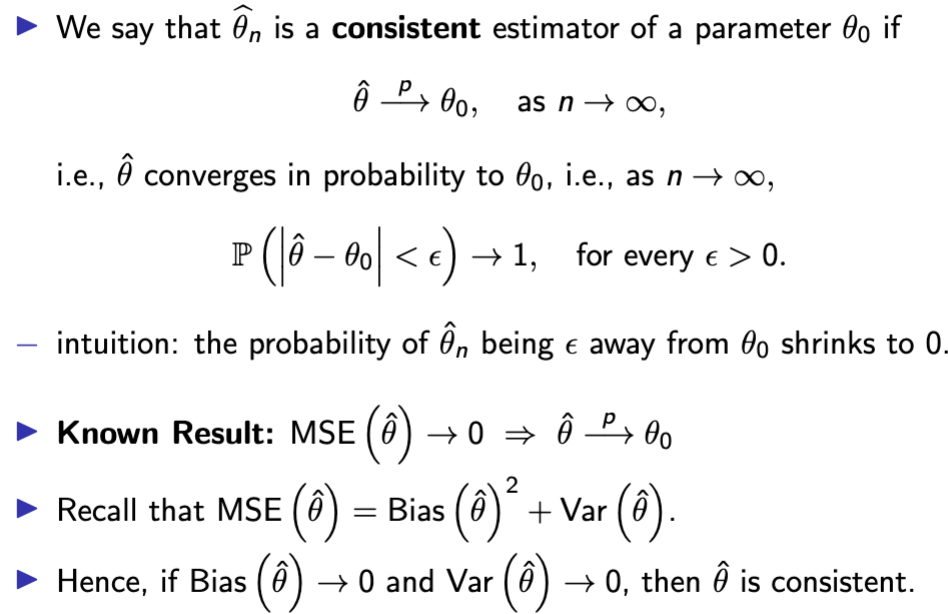
mean squared error of estimator
expected squared distance between the estimator ˆθ and the
true value θ0.
smaller = better
finite sample properties
for each particular sample size n, what are the properties of the
sampling distribution of bθn?
− e.g. bias, variance, MSE, finite-sample sampling distribution...
asymptotic large sample properties
what happens to the sampling distribution of bθn as the sample
size n gets larger and larger?
− what are the limits of (the properties of) the sampling
distribution of bθn as n → ∞?
− e.g. various limits of bias, variance, MSE, distribution...
consistency
LLN Consistency
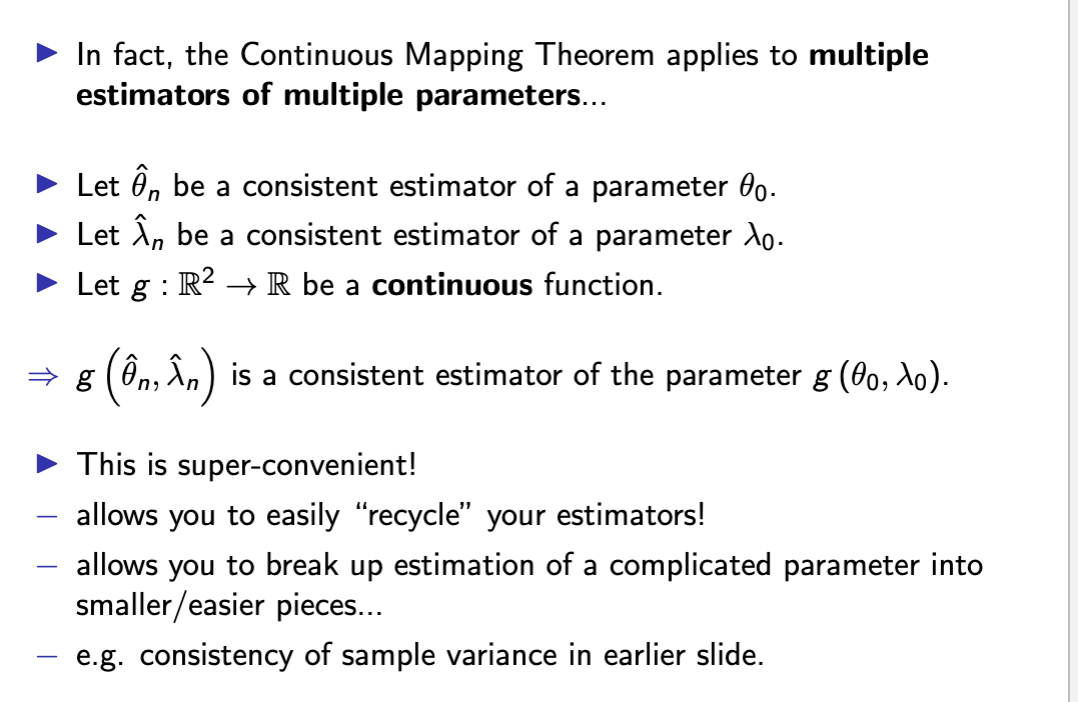
consistency of plug in estimators
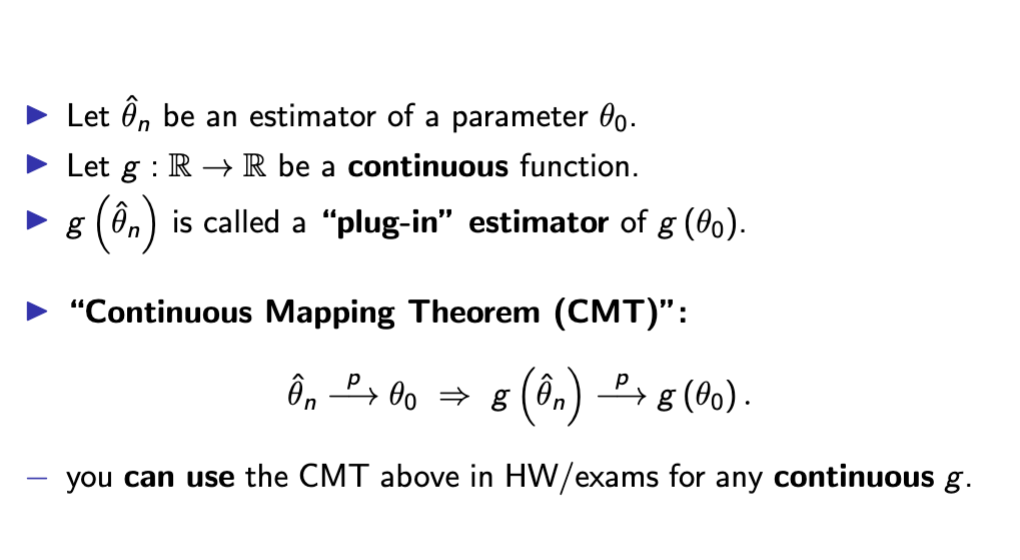
recycle plug in estimators
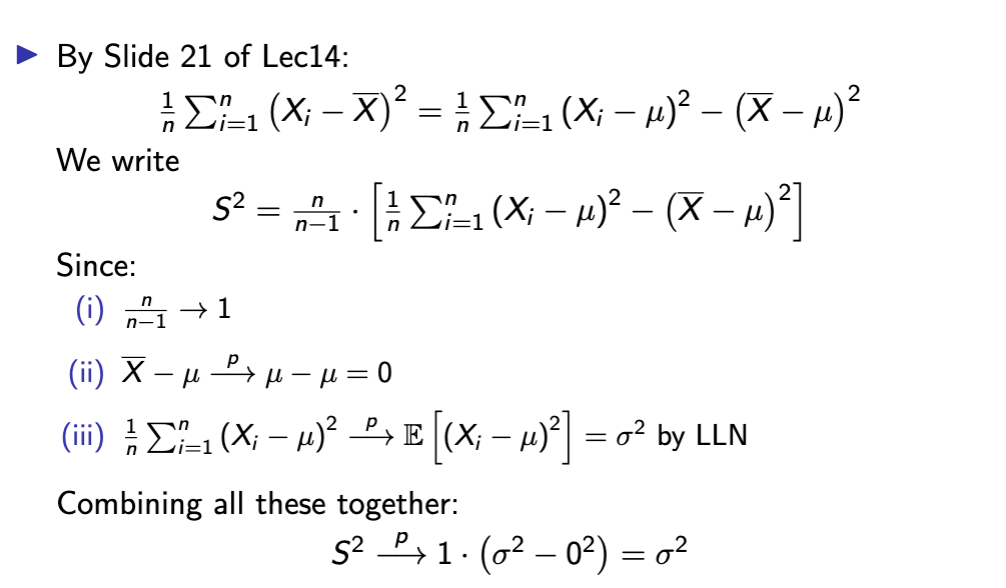
why sample var is consistent
asymptotic dist. of an estimator
central limit theorem
CLT and asymptotic distribution
p and arrow
convergence in probability
is about the convergence of RVs to a constant
→ there is no randomness in the limit
→ e.g. LLN
d and arrow
convergence in distribution
is about convergence of the distributions (of RVs) to another
distribution.
→ there is randomness in the limit:
→ e.g. CLT
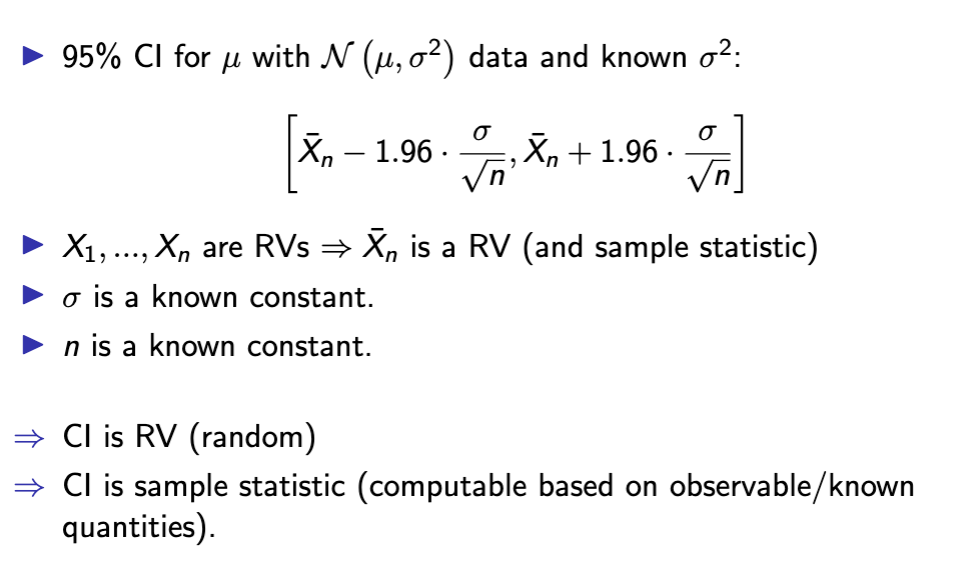
confidence interval
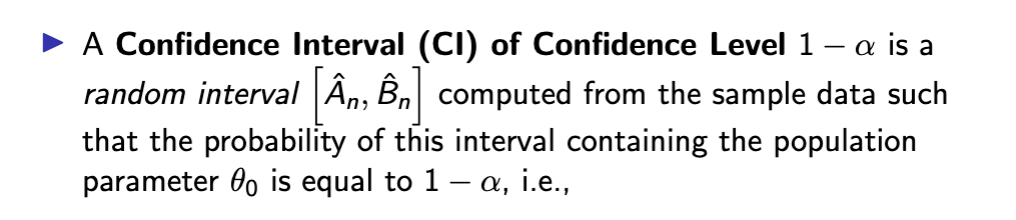
confidence interval is a sample statistic
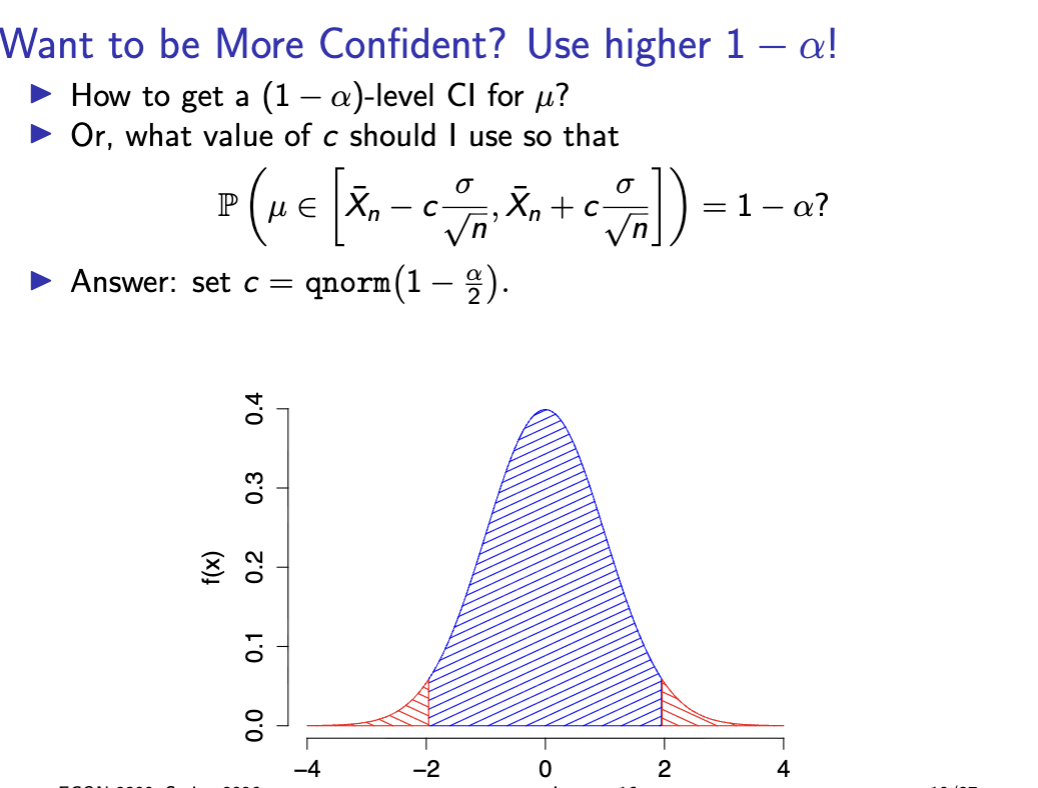
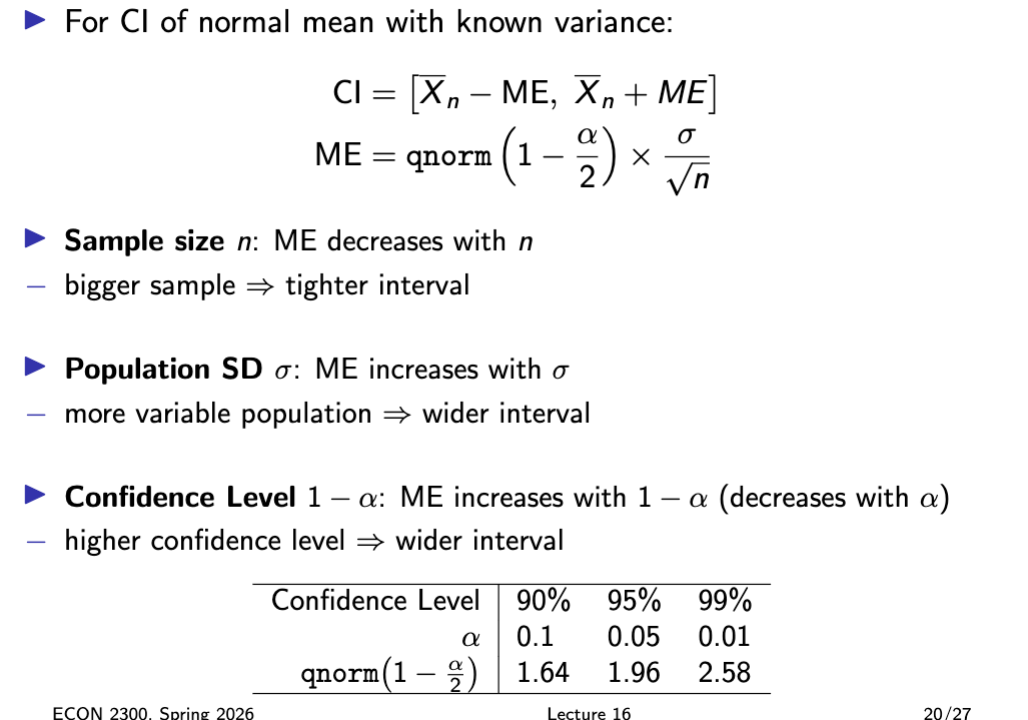
want to be more confident?
what affects ME and CI
CI interpretation
more on CI
probability is about sampling dist. of CI
if we sampled many times we’d get many
different sample means, each leading to a different confidence
interval. Approximately 95% of these intervals will contain μ.
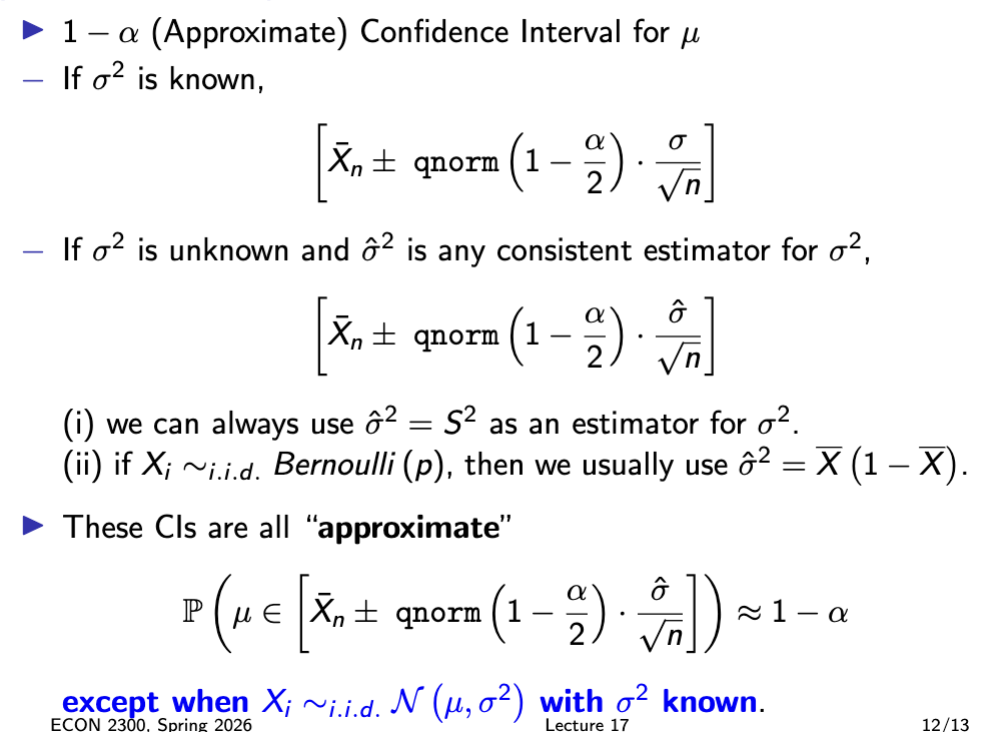
confidence interval summary
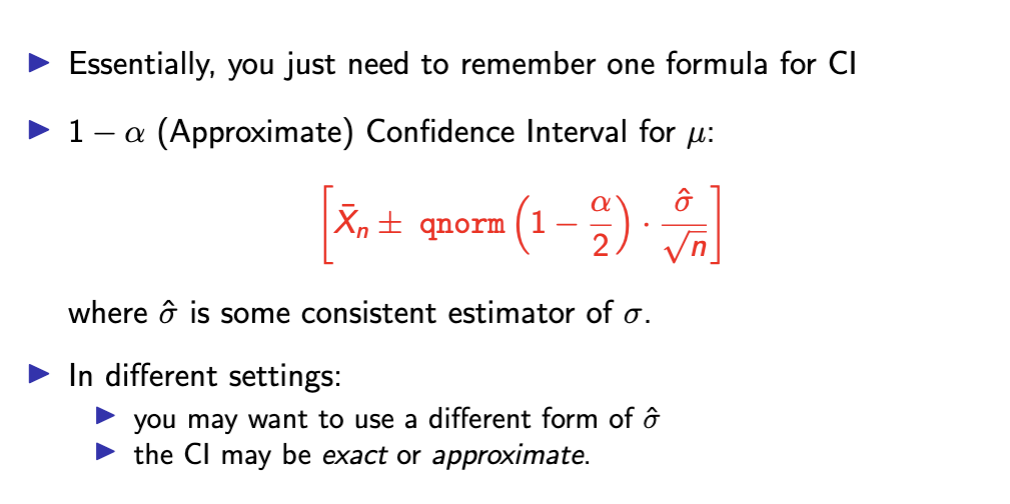
important confidence interval summary
normal meaning
A Normal (or Gaussian) distribution is a specific shape that a random variable's distribution can take. It shows up constantly in statistics because of how naturally it arises in the real world.