Data mining quiz one- two
1/99
There's no tags or description
Looks like no tags are added yet.
Name | Mastery | Learn | Test | Matching | Spaced |
|---|
No study sessions yet.
100 Terms
Which statement about business intelligence workflow is CORRECT?
a. Data in the operational database is transformed to analytical data in the data warehouse
b. External data sources are never used in the BI analytics
c. Transactional data software is directly connected to data warehouse
d. Business users and BI analysts are usually the same group of people
a. Data in the operational database is transformed to analytical data in the data warehouse
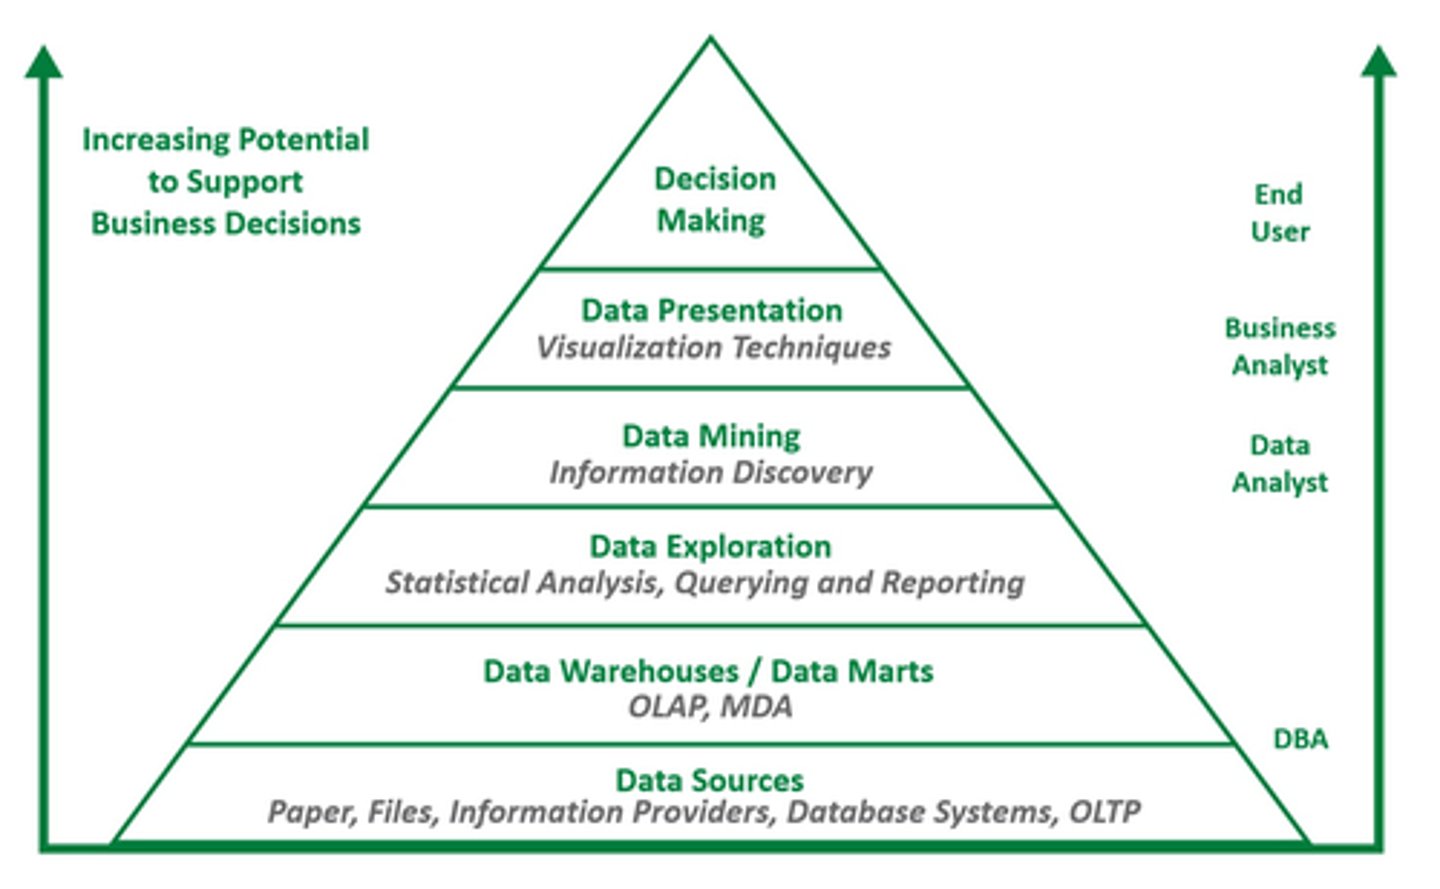
According to the data-driven decision-making technology pyramid shown in the following figure, which statement is FALSE?
a. At the bottom of the pyramid are transactional data management systems moderated and operated by database analyst and admins (DBA).
b. As data moves from the bottom of the pyramid to the top it transforms into information, knowledge, and actionable insights..
c. The process only moves in one direction (upward) and higher layers never give feedback to the lower layers.
d. Raw operational data in OLTP systems are transformed to OLAP in data warehouse systems.
c. The process only moves in one direction (upward) and higher layers never give feedback to the lower layers.
Which statement about the data mining process is INCORRECT?
a. No value presents in raw, unprocessed, and unactionable data
b. The overall objective of any data mining process is to improve the business
c. Data cleaning and pre-processing is usually a trivial step in the process
d. Data mining is a multidisciplinary field that makes a significant use of statistics
c. Data cleaning and pre-processing is usually a trivial step in the process
Which statement is FALSE about the data-driven decision-making approach?
a. It requires computational work
b. It is an iterative and algorithmic process
c. It is based on the collected facts
d. It is loaded with assumptions and theories
d. It is loaded with assumptions and theories
Which source is considered as a data source in the "big data" ecosystem?
a. Social media
b. Business transactions
c. Internal business emails
d. All of the others
d. All of the others
"Learn from the observed records to predict numerical values of unseen records."
In data mining, this is called ...
a. Regression
b. Segmentation
c. Classification
d. Clustering
a. Regression
Which of the followings is a core idea/task in data mining?
a. Data cleaning and pre processing
b. All of the others
c. Regression modeling
d. Data visualization
b. All of the others
ANOVA is an analysis under which of the following data mining task categories?
a. Visualization
b. Data exploration
c. Dimension reduction
d. Data cleaning
b. Data exploration
"Predicting whether a company will go bankrupt based on comparing its financial data to those of similar bankrupt and nonbankrupt firms."
Performing this task in data mining requires an unsupervised learning approach.
T/F
False
"Learn from the observed records to predict the class value of unseen records."
In data mining, this is called ....
a. Clustering
b. Segmentation
c. Classification
d. Regression
c. Classification
"Automated sorting of mail by zip code scanning."
Performing this task in data mining requires an unsupervised learning approach
T/F
True
The "learning" part of machine learning refers to the fact that the computer system improves its performance by discerning patterns from data and adjusting its internal parameters, without the need for explicit programming of rules case-by-case.
T/F
True
"Estimating the repair time required for an aircraft based on a trouble ticket."
Performing this task in data mining requires an unsupervised learning approach.
T/F
False
What is "a step-by-step set of instructions or rules designed to solve a specific problem or perform a task in data mining"?
a. Model
b. Prediction
c. Supervised learning
d. Algorithm
d. Algorithm
What is the first phase in the CRISP-DM approach for data mining tasks?
a. Business understanding
b. Data collection
c. Data understanding
d. Model understanding
a. Business understanding
"Identifying segments of similar customers."
Performing this task in data mining requires a supervised learning approach.
T/F
False
What is the essential element in the machine learning algorithms that distinguish supervised from unsupervised learning?
a. In the supervised learning models target variable is used in the model, but in the unsupervised learning models there is no target to predict
b. Supervised learning models require significantly larger computational resources than unsupervised learning models
c. Unsupervised learning models require significantly larger computational resources than supervised learning models
d. Supervised learning model are better than unsupervised learning models
a. In the supervised learning models target variable is used in the model, but in the unsupervised learning models there is no target to predict
"Identifying a network data packet as dangerous (virus, hacker attack) based on comparison to other packets whose threat status is known."
Performing this task in data mining requires a supervised learning approach.
T/F
True
Which of the following tasks is an unsupervised learning task?
a. Predicting customers retention
b. Forecasting customers spending
c. Predicting customers loyalty
d. Grouping customers based on the similarity in their online behavior
d. Grouping customers based on the similarity in their online behavior
Which of the following tasks is a supervised learning task?
a. Segmenting the market based on the common interests and priorities
b. Predicting air pollution level
c. Finding association rules in a large amount of retail transactions
d. Visualizing relationship between the target variable and predictors
b. Predicting air pollution level
Data exploration includes summary statistics, univariate and bivariate analysis, basic statistical tests (t-test, correlation), ANOVA, and outlier detection.
T/F
True
Which of the following statements is INCORRECT about the missing values in a data set?
a. Both categorical and numerical values can be missing
b. The best strategy is always to drop records with any missing values
c. Missing values are common issue and there are strategies to handle them
c. Missing values can be estimated
b. The best strategy is always to drop records with any missing values
c. Missing
Variable role depends on the function that it serves in our data mining task and a variable can be a predictor or the target.
T/F
True
What changes during normalization of a variable?
a. variable range
b. variable role
c. variable type
d. variable distribution
a. variable range
Variable type depends on the purpose of the data mining task in which we are using the data.
T/F
False
Which of the following tasks is NOT included in the data preprocessing phase?
a. Handling missing data
b. Data aggregation
c. Data standardization
d. Performance evaluation
d. Performance evaluation
When data is not uniformly distributed and includes outliers, linear normalization is better than the Z-score standardization method.
T/F
False
In the data preparation step, normalizing numeric data is a popular method to transform variables into a more suitable scale for modeling.
T/F
True
Which of the following is NOT a step in data pre-processing?
a. Data reduction
b. Data cleaning
c. Data modeling
d. Data integration
c. Data modeling
Which one is NOT one of the primary reasons for discretizing numerical variables?
a. Higher Accuracy
b. Handling Categorical Algorithms
c. Interpretability
d. Simplification
a. Higher Accuracy
Discretization is a data pre-processing technique that involves the process of converting continuous numeric data into discrete categorical values.
T/F
True
The optimized way of handling missing values depends on the variable role and the purpose of the data mining task.
T/F
True
Which of the following statements is INCORRECT about imputing missing numerical values?
a. Random generator function is one of the best methods of imputing
b. The mean value of the variable can be used for imputing
c. The median value of the variable can be used for imputing
d. Linear regression model can be used for imputing
a. Random generator function is one of the best methods of imputing
Which of the following is NOT a variable discritization method?
a. Equal Width Binning
b. Clustering-based Discretization
c. Random Binning
d. Equal Frequency Binning
c. Random Binning
Transforming numerical variables means performing mathematical functions on them and creating new variables that are better suited for our data mining model.
T/F
True
In practice, data preprocessing takes a significant portion of data mining projects.
T/F
True
The data dictionary is meta-data, which is data about data
T/F
True
In what step of the data pre-processing we fix data inconsistencies from different sources?
a. Data reduction
b. Data integration
c. Data aggregation
d. Handling missing values
b. Data integration
To show the relationship between one numeric and one categorical variable, which plot type is NOT useful?
a. Boxplot
b. Pie chart
c. Bar chart
d. Scatter plot
d. Scatter plot
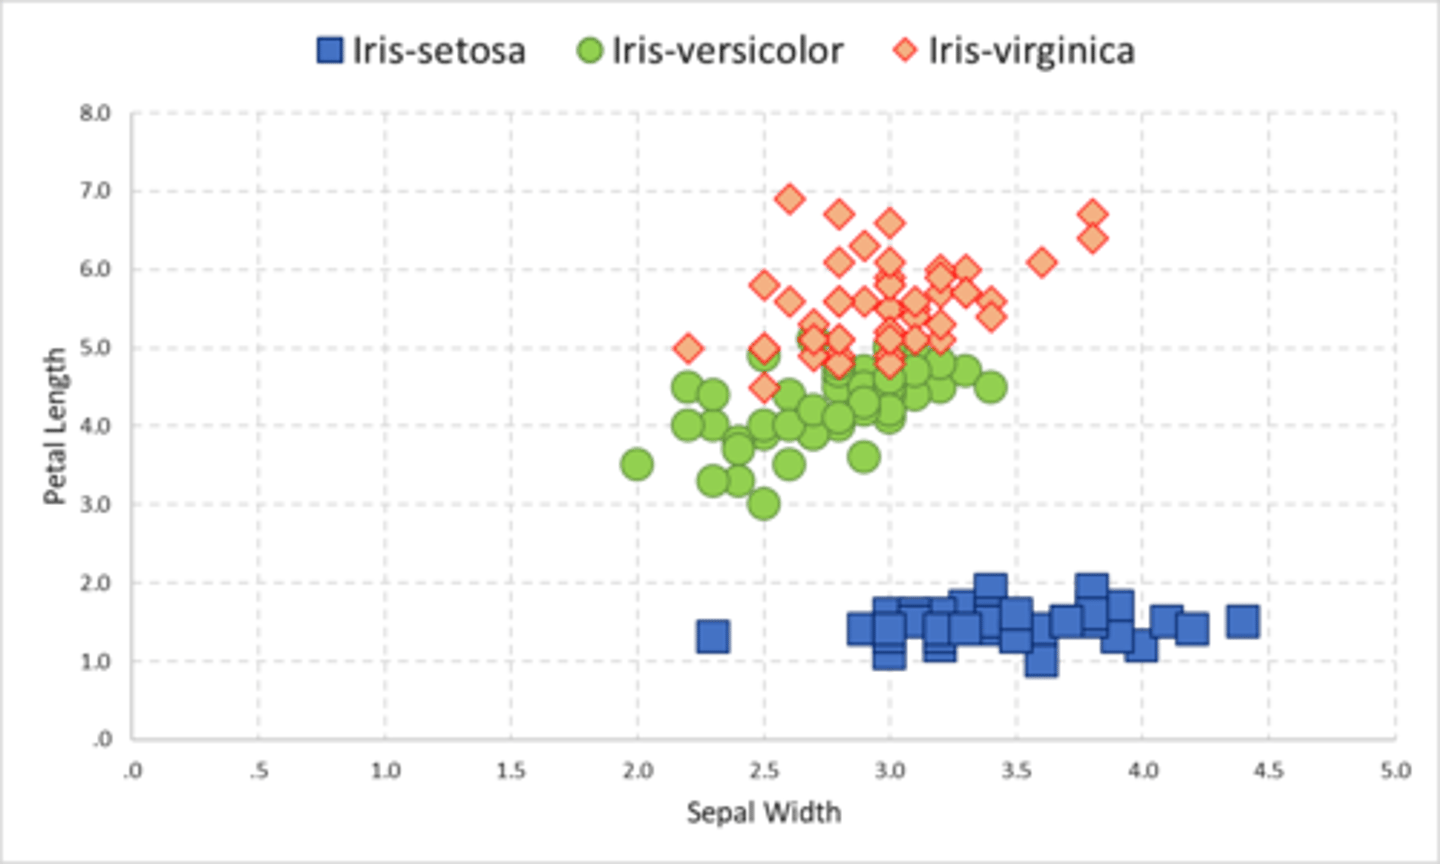
In the following scatter plot, the Sepal Width versus Petal Length of three types of iris flowers are shown. Which iris type is more distinguishable (predictable) from others based on this scatter plot?
a. Versicolor
b. Virginica
c. Setosa
c. Setosa
Which statement is INCORRECT about exploratory data visualization?
a. The purpose of visual exploration of data is to perform target prediction
b. It usually overlaps with exploratory statistical analytics
c. Varity of plot types are used in exploratory visualization
d. It is aimed to discover and display interesting and useful patterns and trends in data
a. The purpose of visual exploration of data is to perform target prediction
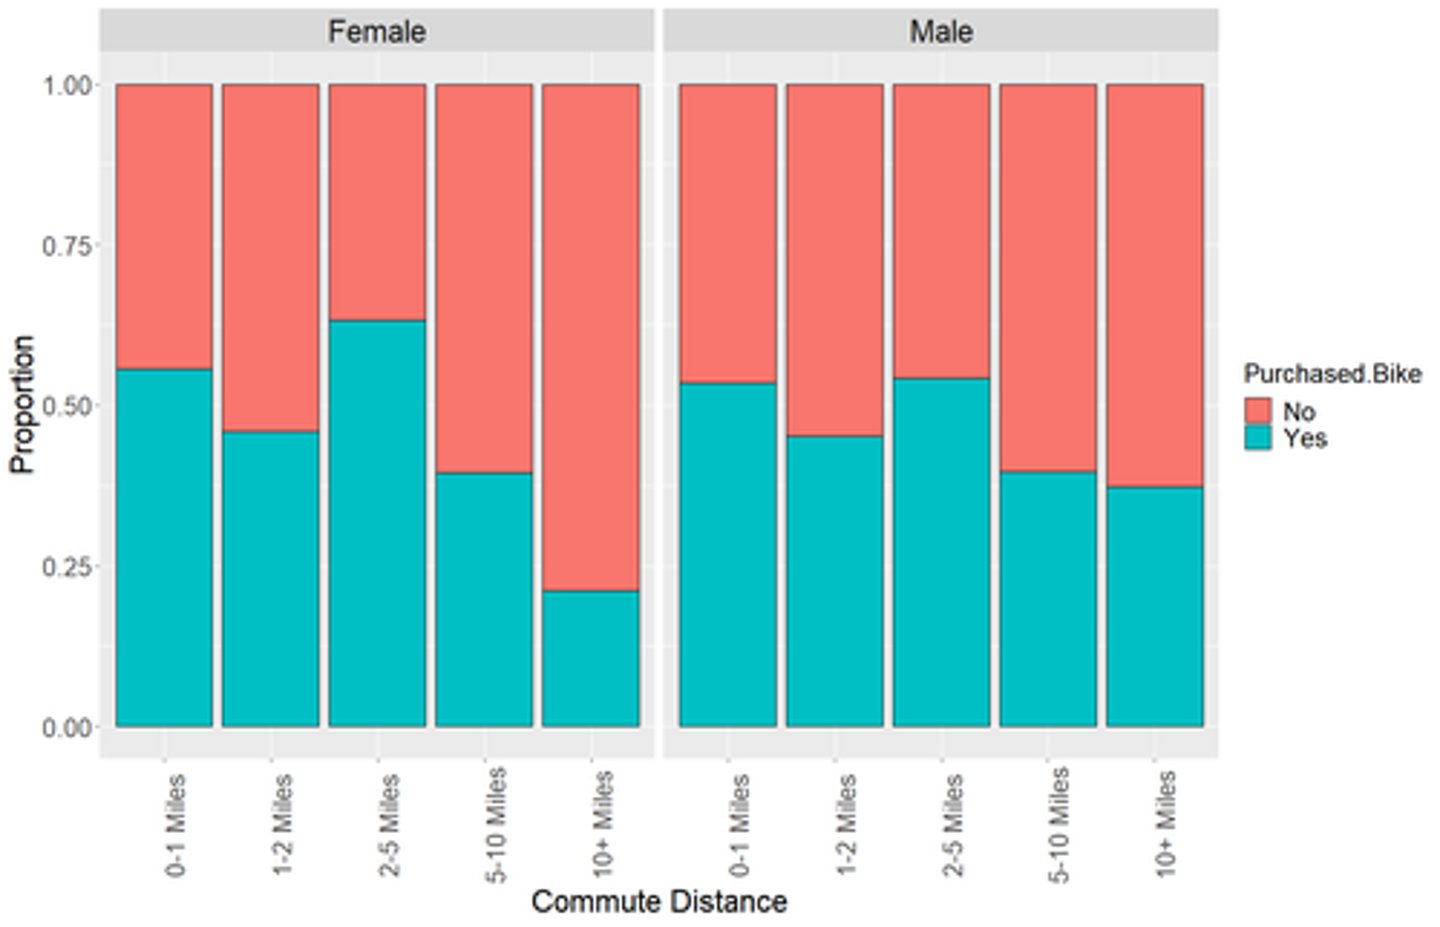
You are working with the Bike Purchase data set which contains records of individuals and their bike ownership status. What does the following chart show?
a. Difference between the number of individuals in each gender and commute category
b. Number of individuals in each gender group across commute distance categories
c. Percentage of individuals in each bike purchase group across gender and commute distance
d. Number of individuals in each bike purchase group across gender and commute distance
c. Percentage of individuals in each bike purchase group across gender and commute distance
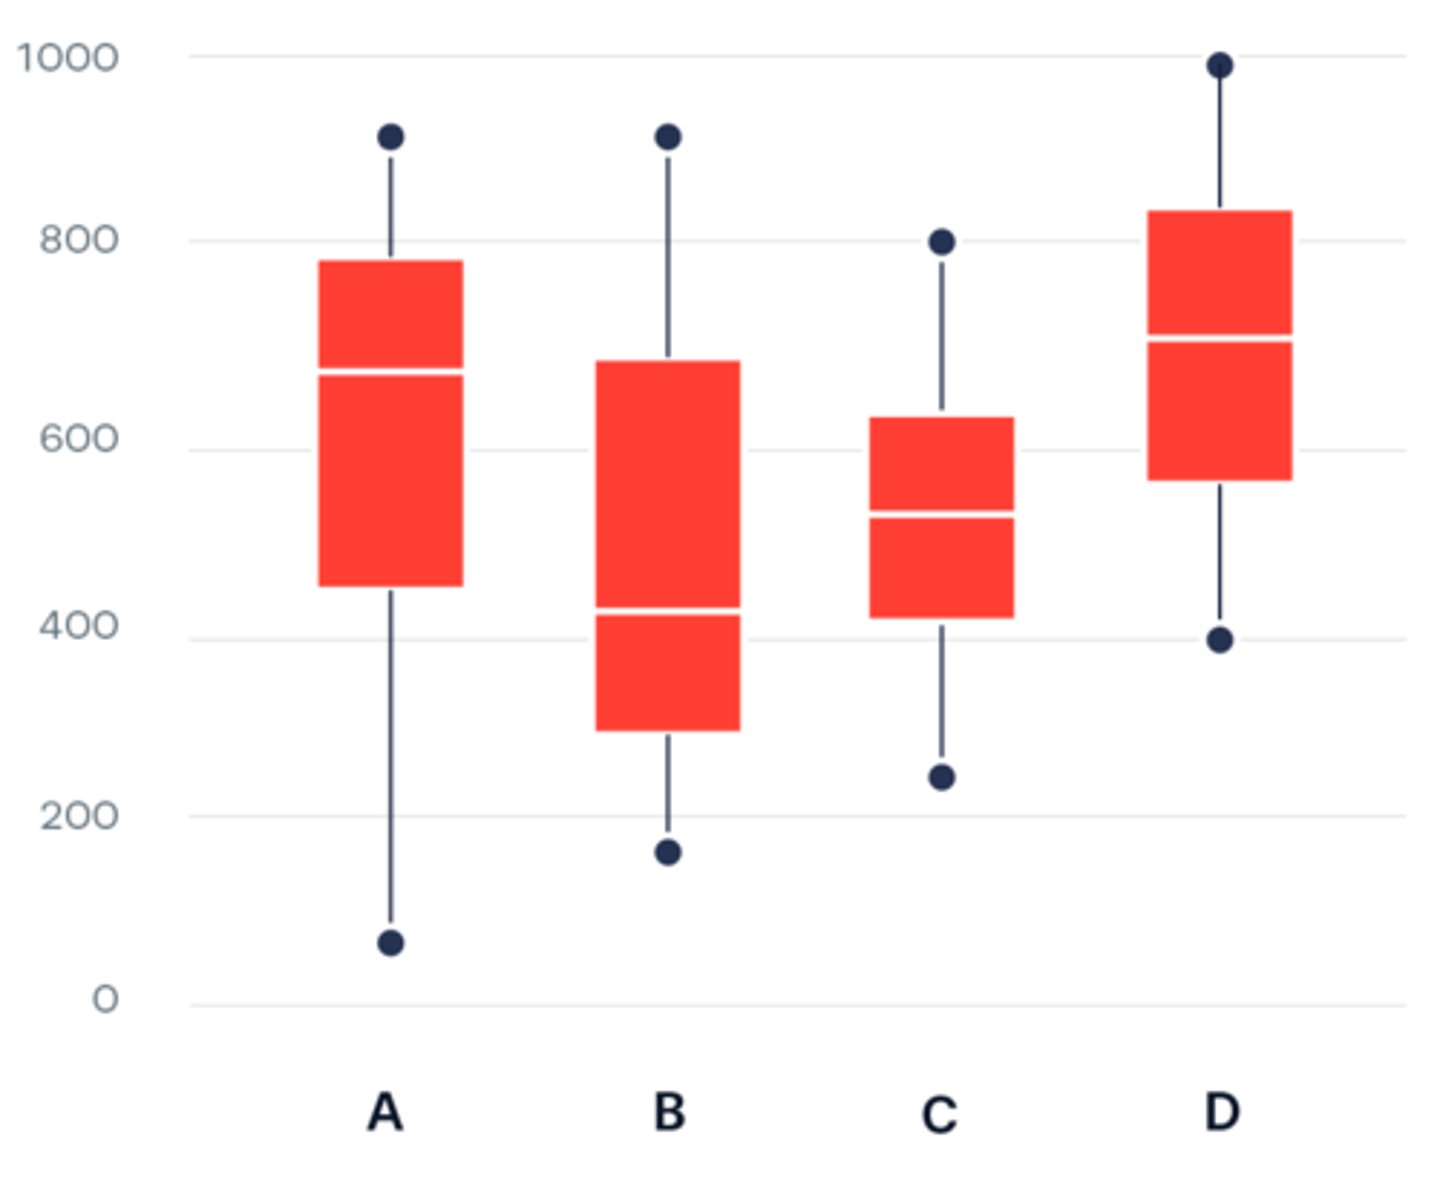
What is the name of the following plot?
a. box-and-whiskers plot
b. histogram
c. column chart
d. bar chart
a. box-and-whiskers plot
The first thing to do before creating a visualization is to select an appropriate app such as Tableau or Power BI.
T/F
False
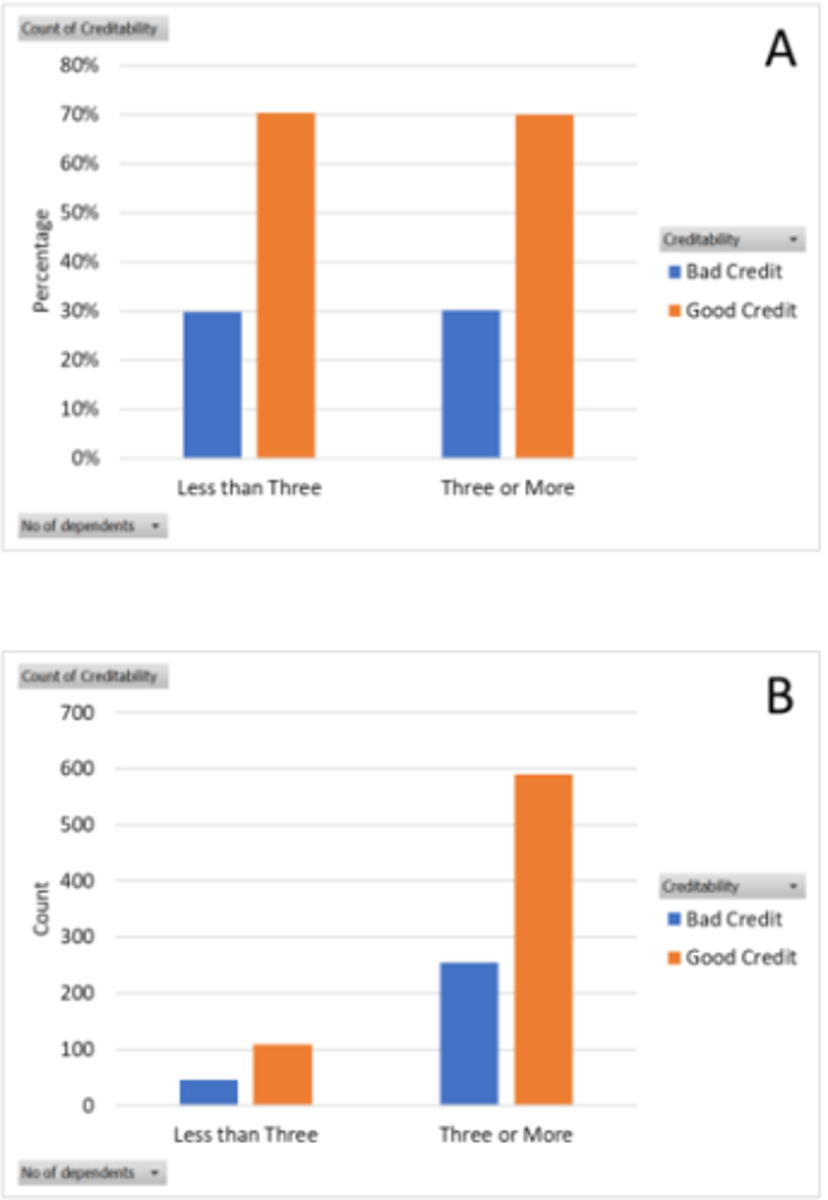
The following bar charts are based on the "Number of Dependent" of credit card applicants and their Credit Status. If you want to explore the association between the number of dependents and the rate of Bad Credit, which plot you should use?
a. Both plots are the same
b. No answer text provided.
c. Plot A
d. Plot B
c. Plot A
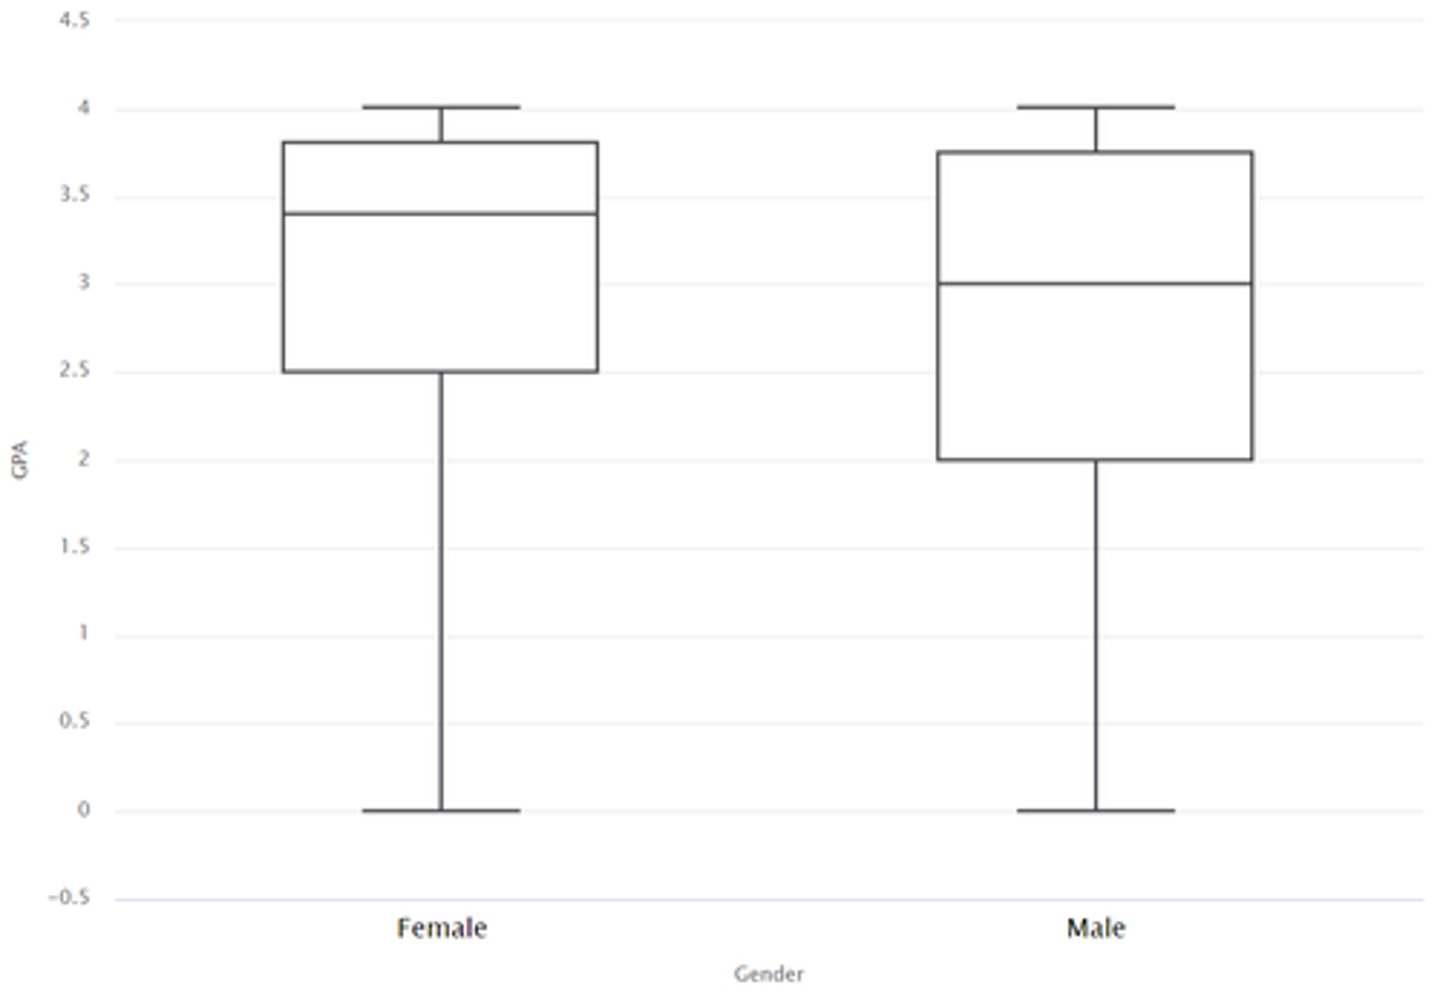
The following box plot shows students' GPA stratified by students' Gender. According to this plot, the minimum GPA of Male students is less than Female students.
T/F
False
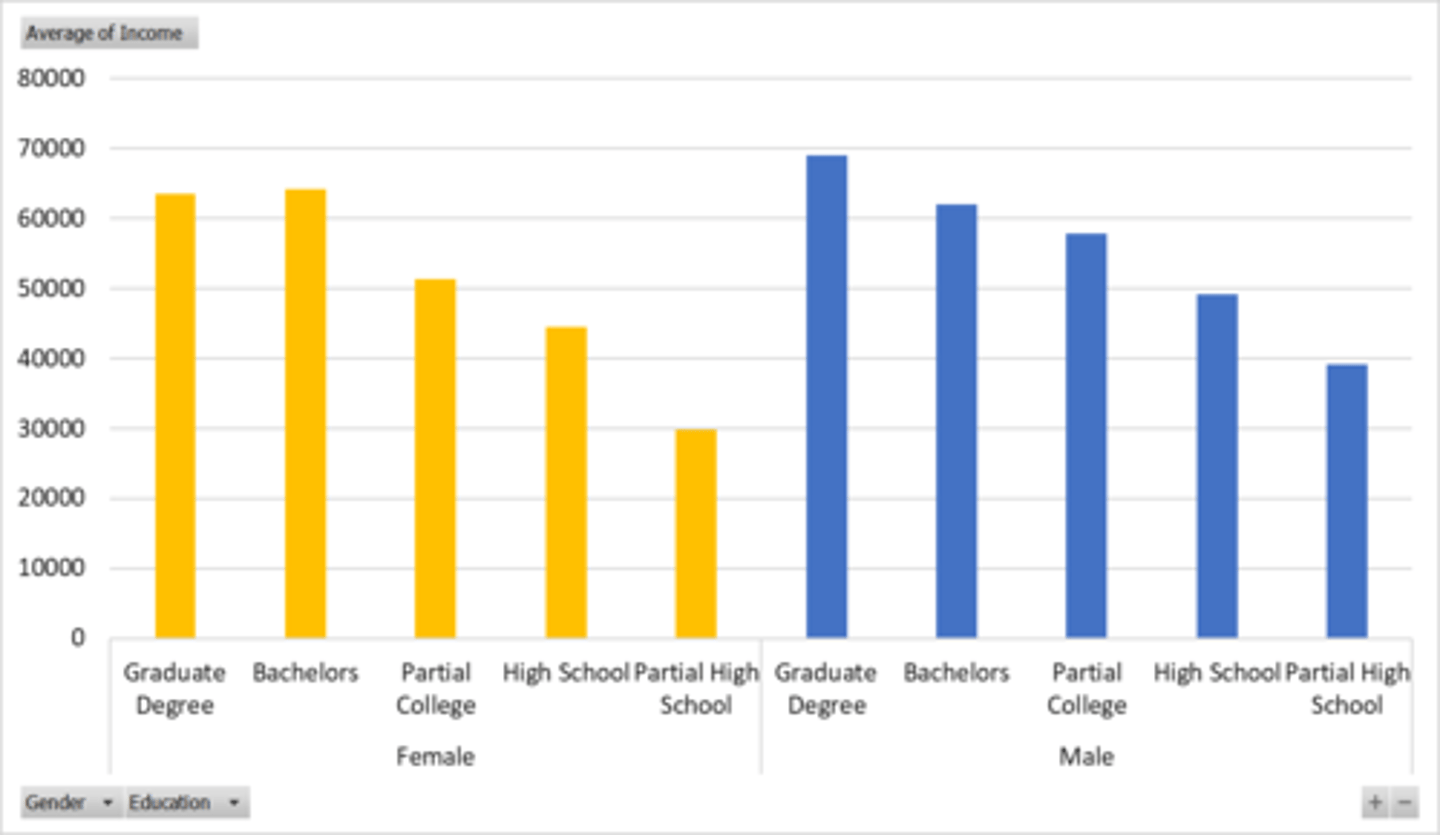
Based on the following plot (Average Income versus Gender and Education Level) which statement is CORRECT?
a. Number of Males with Graduate Degree is higher than Females with the same degree
b. As the level of education decreases the average income decreases in both gender categories
c. The percentage of Female with Bachelors degree is higher than Males with the same education
d. Minimum Income of Females with Partial High School degree is less than the Males with the same degree
b. As the level of education decreases the average income decreases in both gender categories
Both the histogram and box plot are univariate plots that are useful for exploring the distribution of a variable.
T/F
True
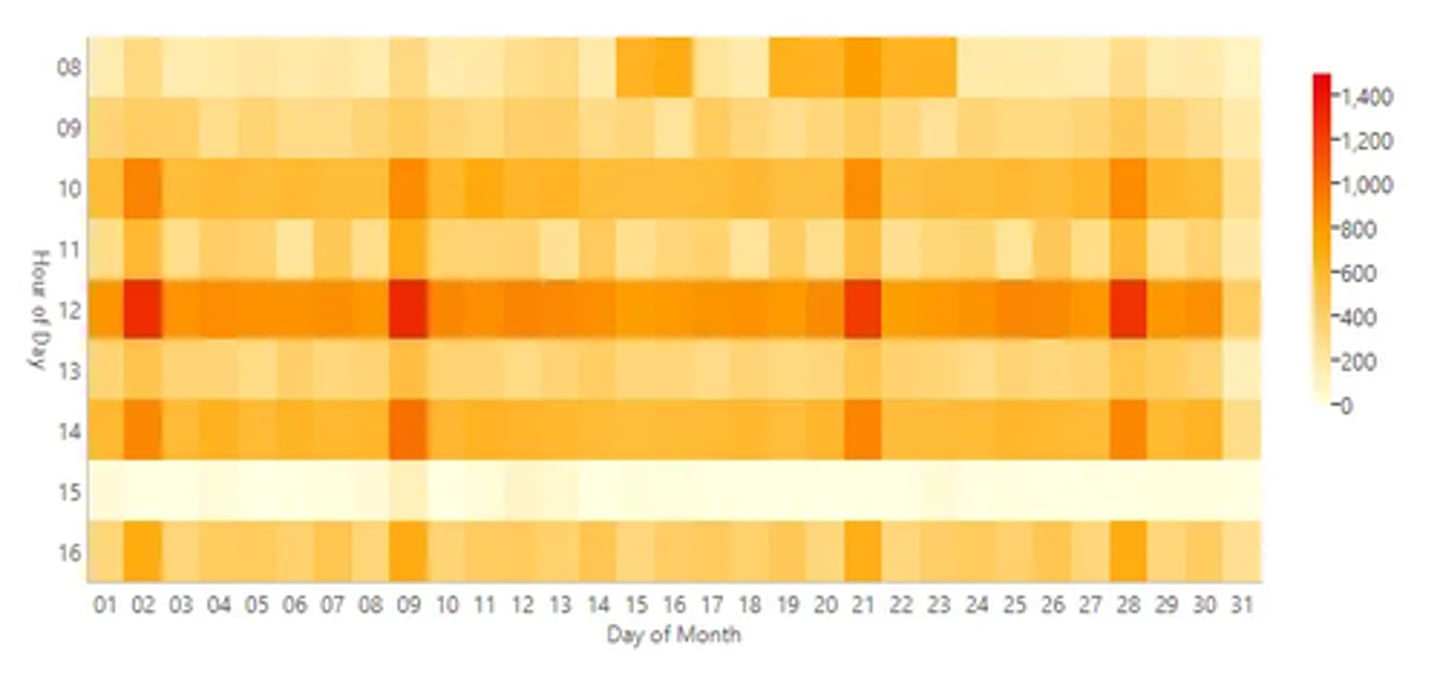
What is the name of the following plot?
a. heat map
b. correlation matrix
c. Gantt chart
d. scatter chart
a. heat map
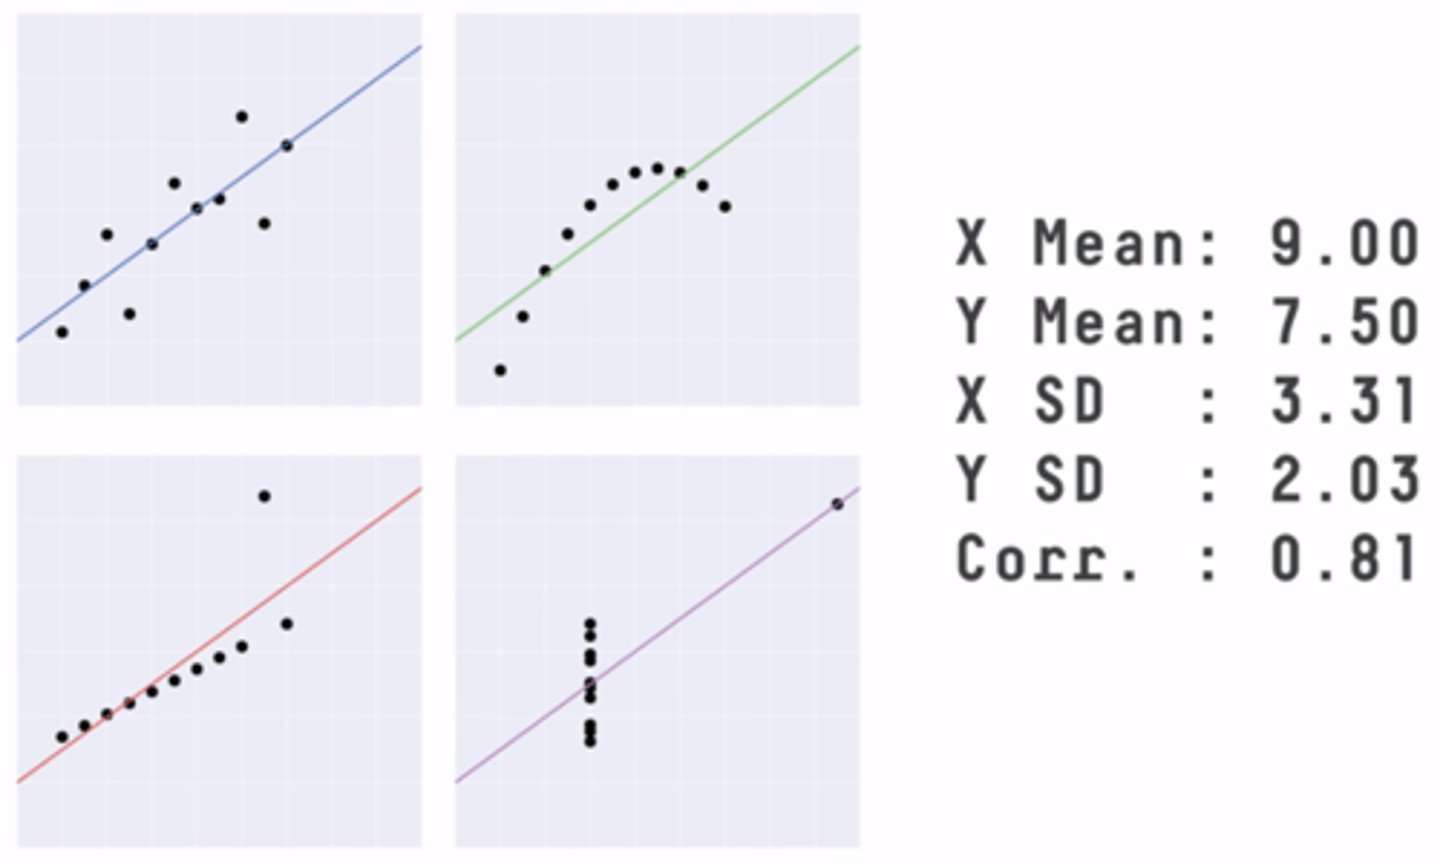
Based on the following scatter plots and summary statistics, which statement is CORRECT?
a. Same summary statistics always mean the same data set
b. Summary statistics is always misleading
c. Visualization can help us see differences between data sets, that can not be identified by looking at summary statistics
d. Data visualization is not required when we have the summary statistics
c. Visualization can help us see differences between data sets, that can not be identified by looking at summary statistics
Which statement is INCORRECT about the k-means clustering algorithm?
a. The algorithm starts with initial centroids that are determined by distance function
b. Each data point is assigned to the cluster with the nearest centroid
c. The algorithm starts with random seeds as the initial centroids
d. The choice of distance function is arbitrary, and the Euclidean distance function is very popular
a. The algorithm starts with initial centroids that are determined by distance function
The k-means clustering algorithm can easily handle noisy data with outliers as well as non-convex data patterns.
T/F
False
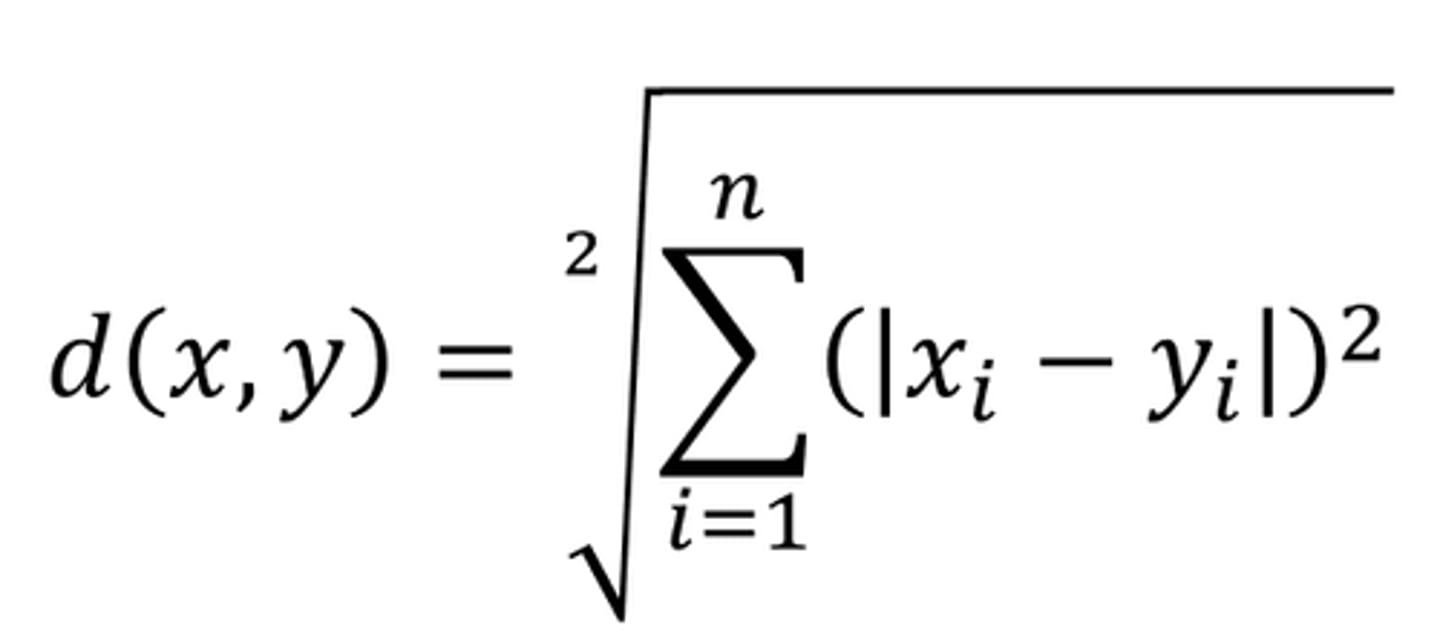
What is the Euclidean distance between the following two records WITHOUT normalization? Round your answer to 1 decimal.
Euclidean distance formula:
11.5
We run two k-means clustering models on the same data with k=3 and k=5. The model with k=3 is necessarily better than the other one because a smaller value of k is always better for clustering.
T/F
false
Before computing the distance between two data records, we should normalize the numerical variables to prevent variables with large scales from having an undue effect.
T/F
True
Both numerical and categorical variables can be used similarly in the Euclidian distance function in the k-means clustering algorithm.
T/F
False
Which statement is INCORRECT about clustering?
a. Clustering has many applications is marketing, insurance, logistics, and health care businesses
b. Clustering is an unsupervised learning method
c. Quality of a clustering model depends on the similarity measure that is used
d. Clustering is useful for predicting association rules
d. Clustering is useful for predicting association rules
In the k-means clustering technique, the desired number of clusters (k) is a number that is determined at the end of the algorithm by calculating the model error.
T/F
False
Which statement is INCORRECT about choosing the number of clusters in the k-means clustering method?
a. Maximizing the within-cluster sums of squared errors (WSS) is the goal when selecting k
b. Ability to do a useful profiling based on the cluster centroids helps us select a right value of k
c. Sometimes business considerations impose constrains on the value of k
d. Similar analyses can be used to inform our decision about a right value of k
a. Maximizing the within-cluster sums of squared errors (WSS) is the goal when selecting k
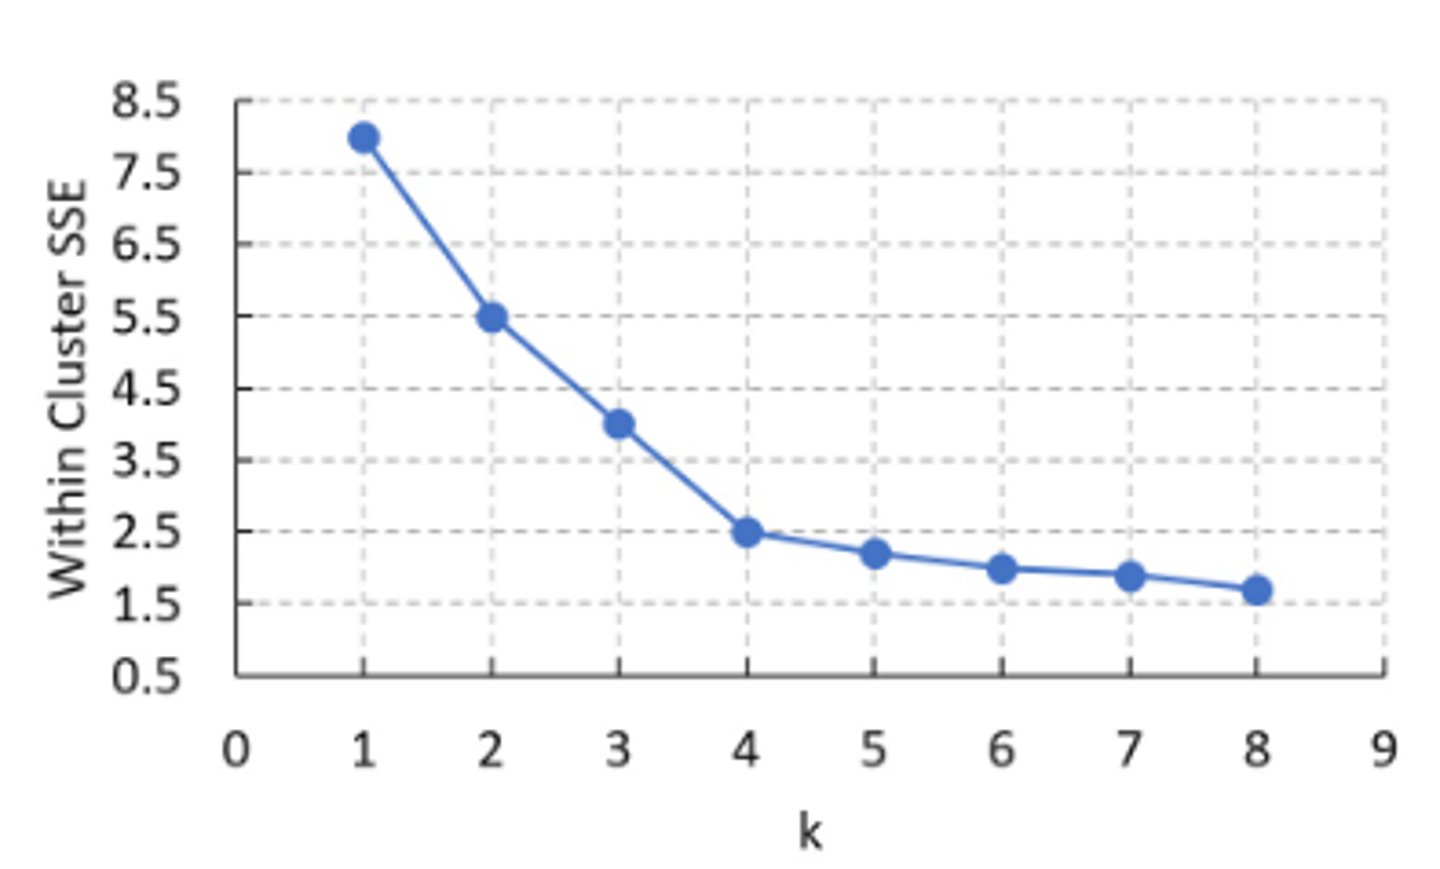
The following chart shows the within-cluster sum of square errors versus the number of clusters in a k-means clustering model. Based on the Elbow method, what value of k is optimum for clustering?
a. 8
b. 4
c. 5
d. 2
b. 4
The Mean Error (ME) of any linear regression model is equal to zero.
T/F
True
The following linear regression model is trained to predict Boston house prices using CRIM (per capita crime rate by town), ZN (proportion of residential land zone), INDUS (proportion of industrial land zone), CHAS (Charles River dummy variable), and NOX (air pollution level).
Use the model to predict the Median Value of the following house:
CRIM = 0.121
ZN = 22
INDUS = 1.47
CHAS = 0
NOX = 0.44
a. 27.7
c. 37.1
d. 34.7
e. 21.7
a. 27.7

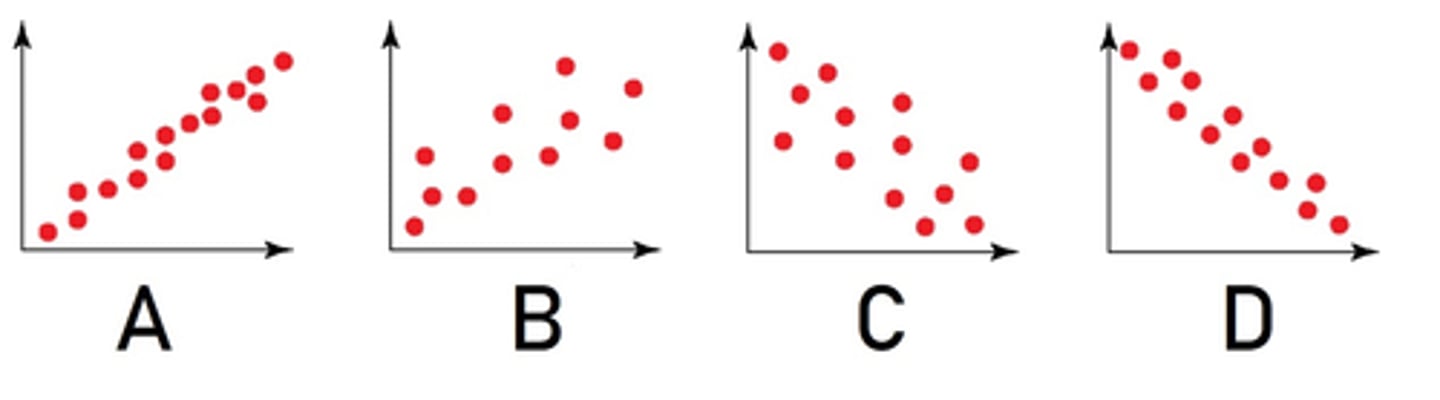
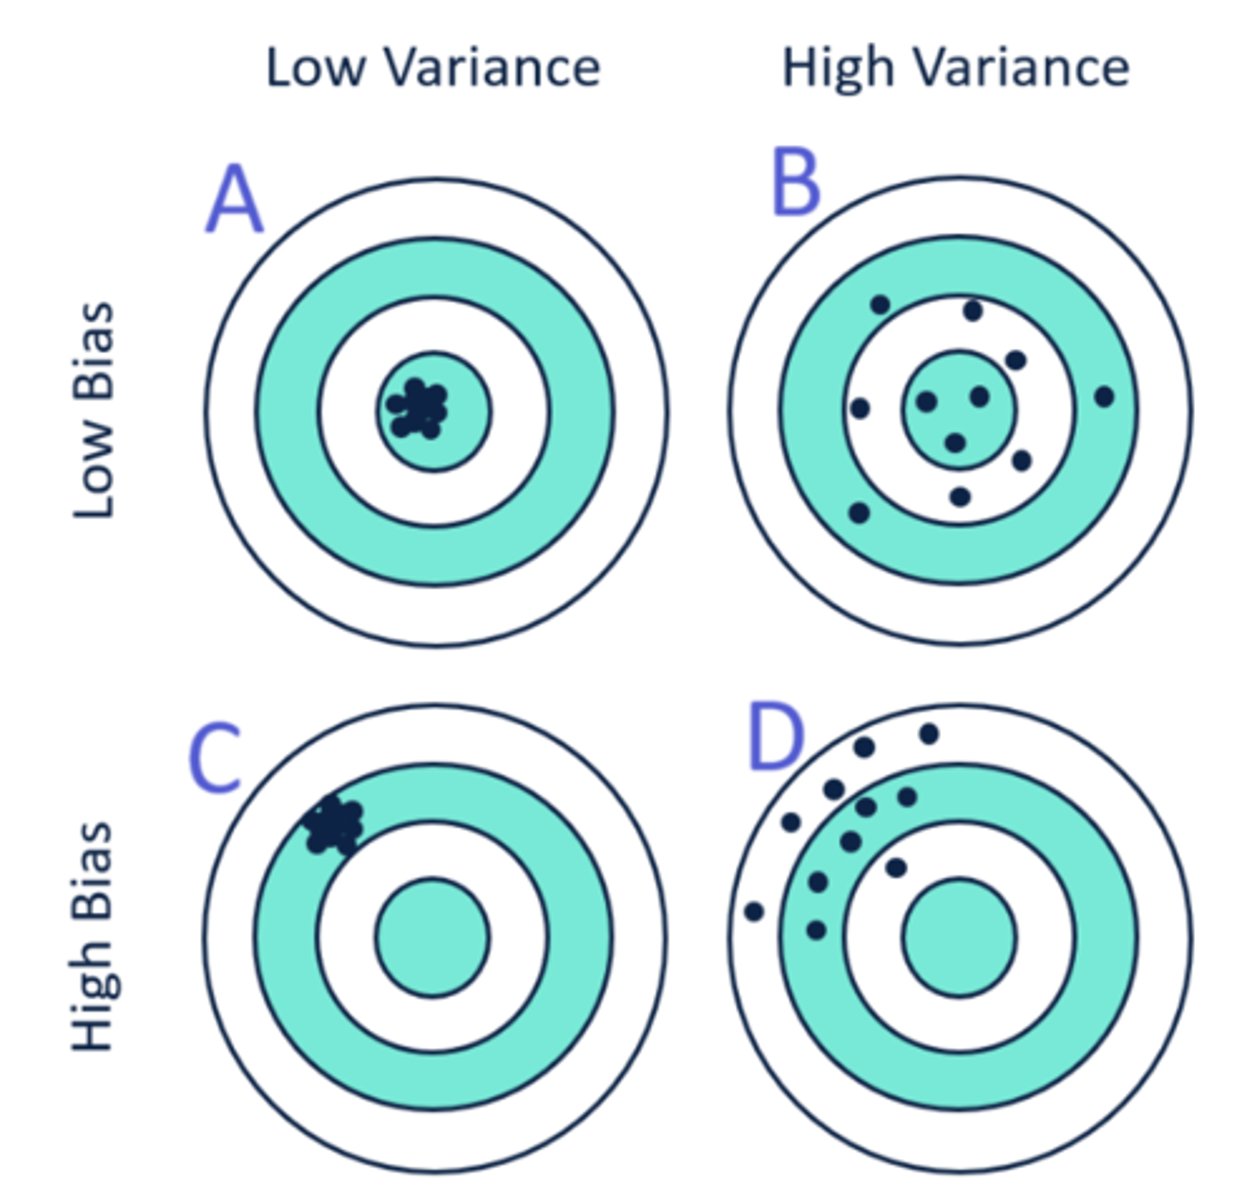
Which of the following scatterplots shows the strongest negative correlation?
a. B
b. C
c. A
d. D
d. D
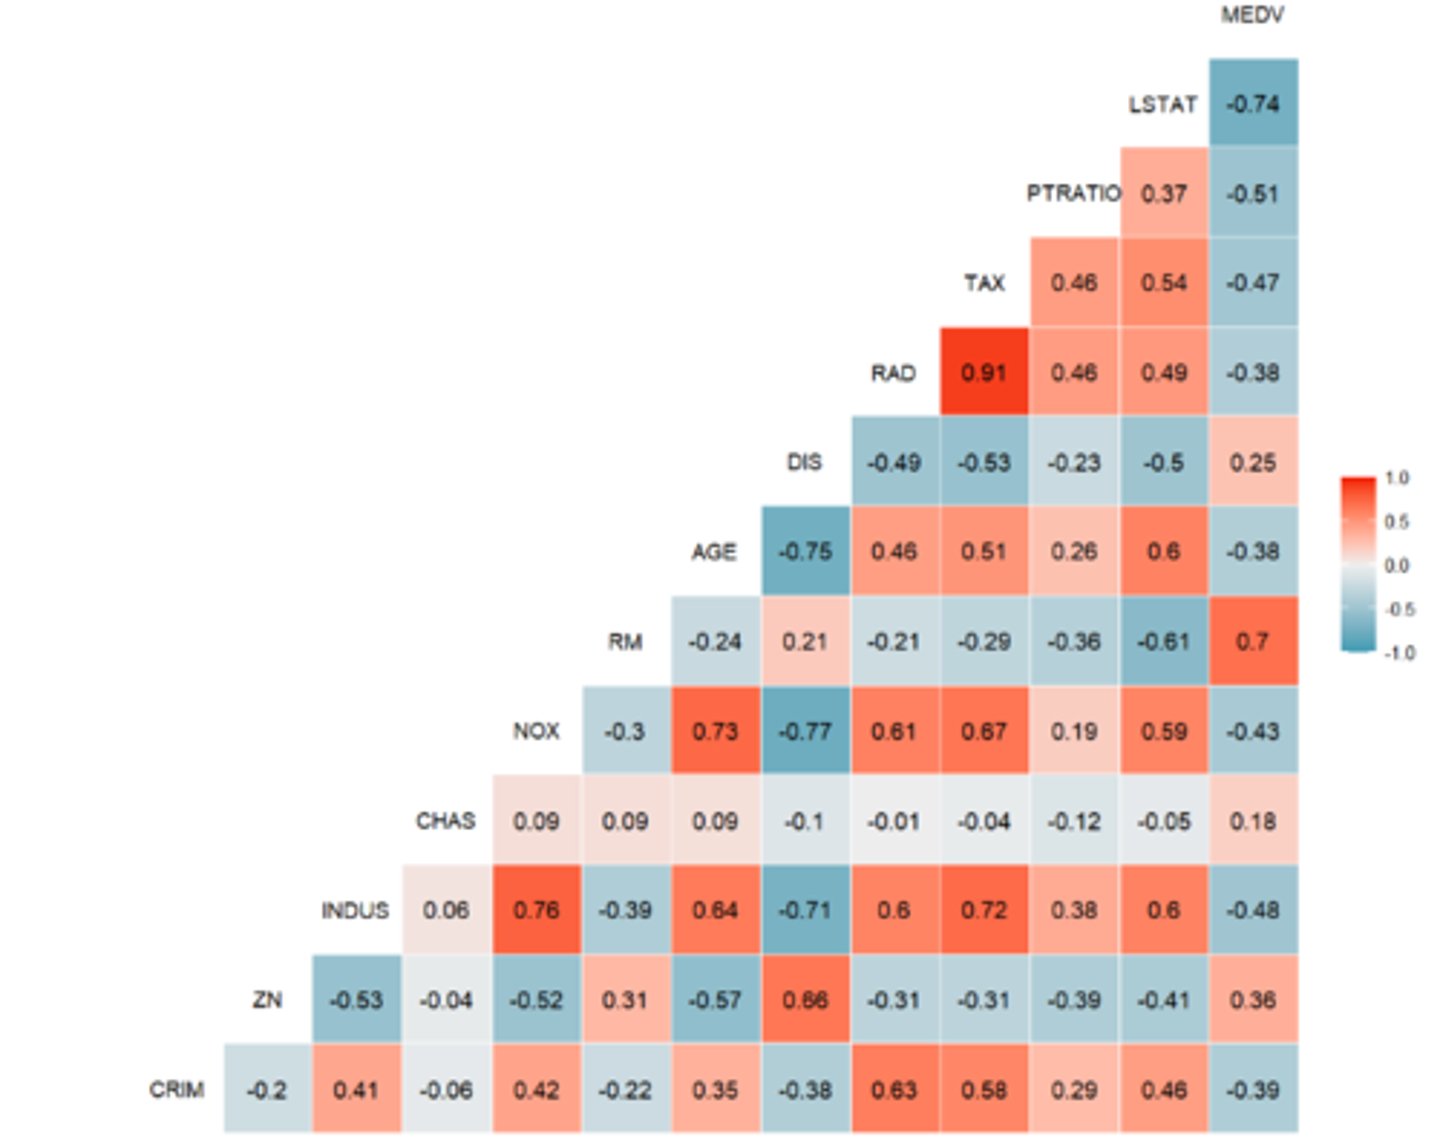
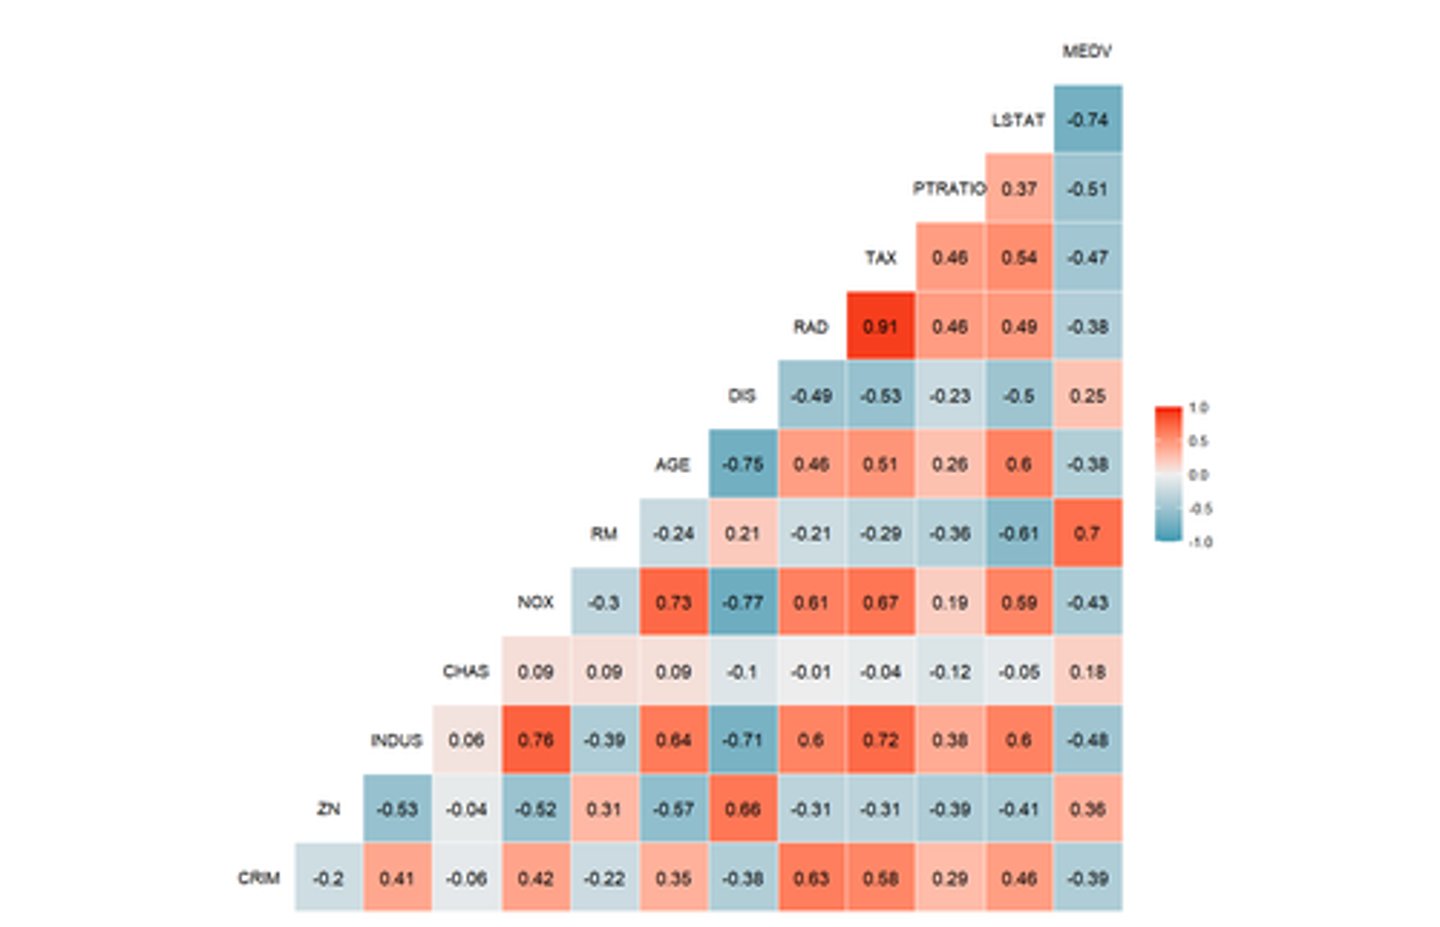
Based on the following correlation matrix, what is potentially the weakest predictor of MEDV?
a. PTRATIO
b. RM
c. CHAS
d. TAX
c. CHAS
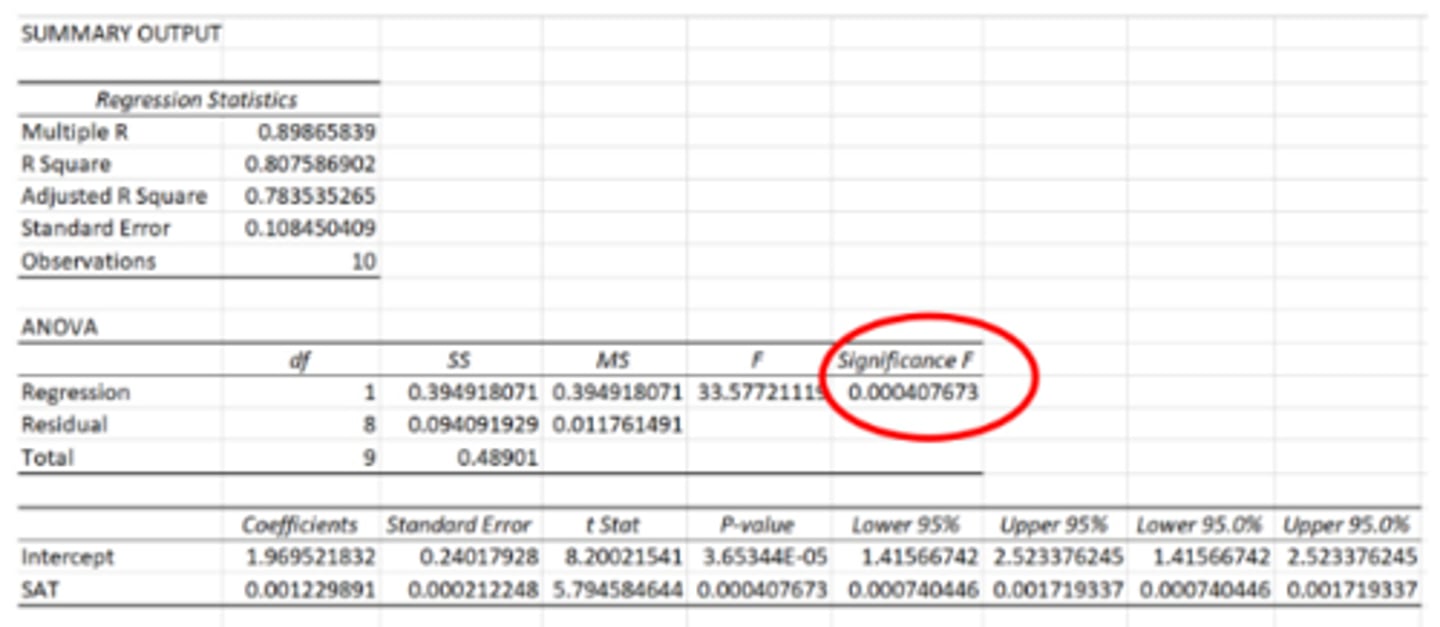
The following report shows Excel output for a linear regression model. What can the p-value of F-statistic tell us?
a. If this p-value is larger than our significance level then the coefficients are significant
b. If this p-value is less than our significance level then the model as a whole is significant
c. If this p-value is less than our significance level then the coefficients are significant
d. If this p-value is larger than our significance level then the model as a whole is significant
b. If this p-value is less than our significance level then the model as a whole is significant
Based on the following correlation matrix, what is potentially the strongest predictor of MEDV?
a. RM
b. INDUS
c. AGE
d. LSTAT
d. LSTAT

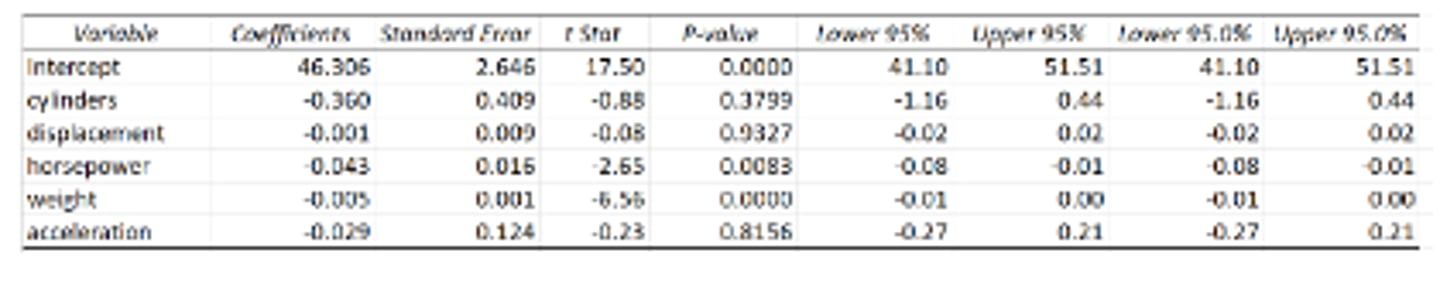
We have created a multiple linear regression model to predict car MPG (miles per gallon) values by five cas features: cylinders, displacement, horsepower, weight, and acceleration.
The following table shows the linear model. Based on the results, what variable's estimated coefficient is significantly different from zero?
a. acceleration
b. cylinders
c. displacement
d. horsepower
d. horsepower
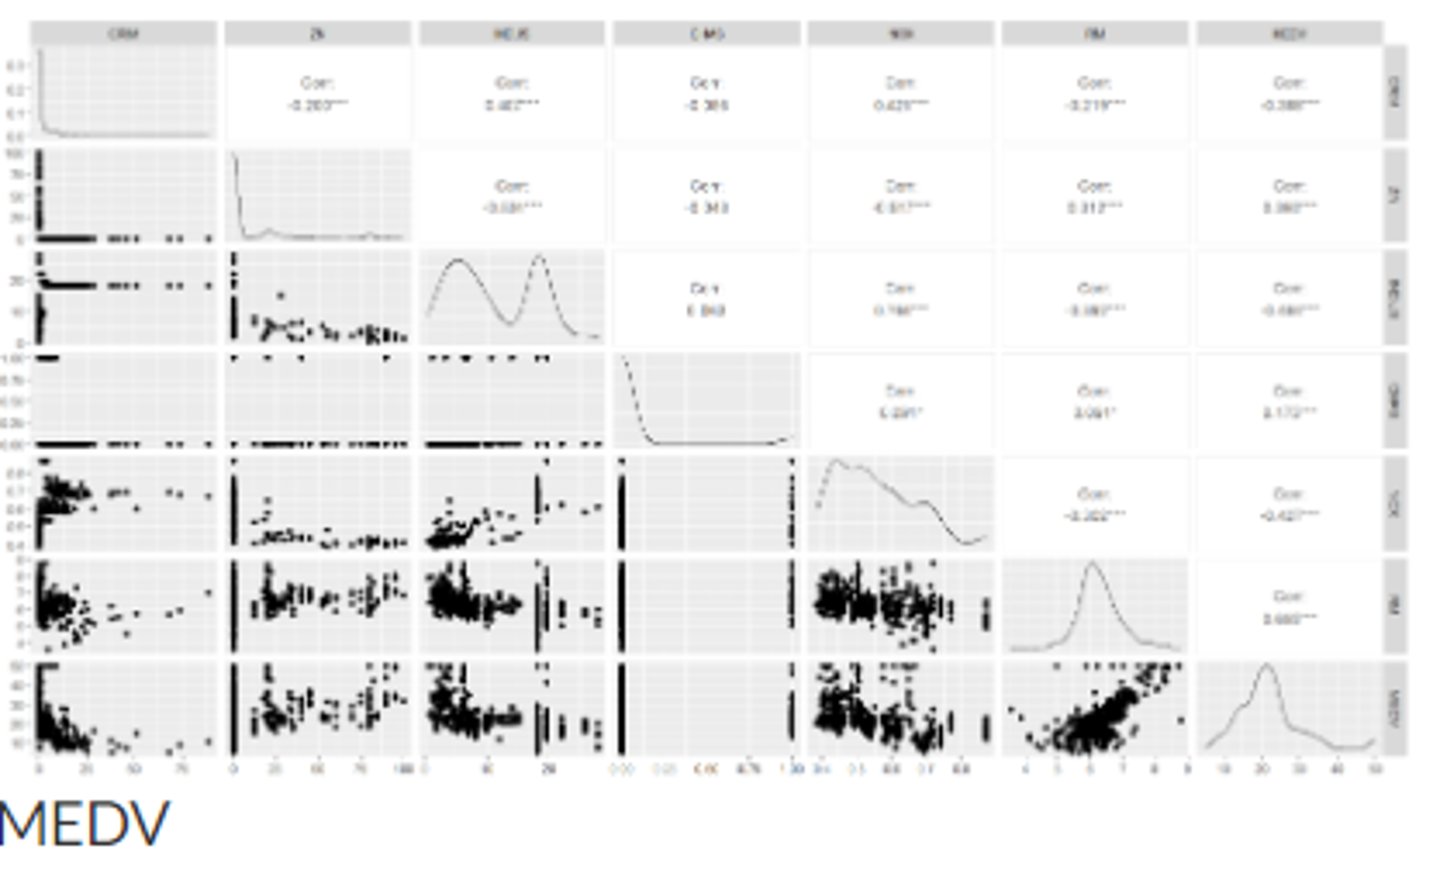
The following scatterplot matrix is created from the Boston Housing data set that shows the median price of the houses in the Boston metropolitan area. Which two variables (any two variables) show the strongest correlation?
(read the column and row labels to find the variable names)
a. MEDV & RM
b. INDUS & NOX
c. CHAS & INDUS
d. MEDV & NOX
b. INDUS & NOX
You are asked to use a large data set of customers to predict how many days after their first purchase they will make the second purchase. You can do this by developing a classification model.
T/F
False
Predictors of a multiple linear regression model can only be numeric type.
T/F
False
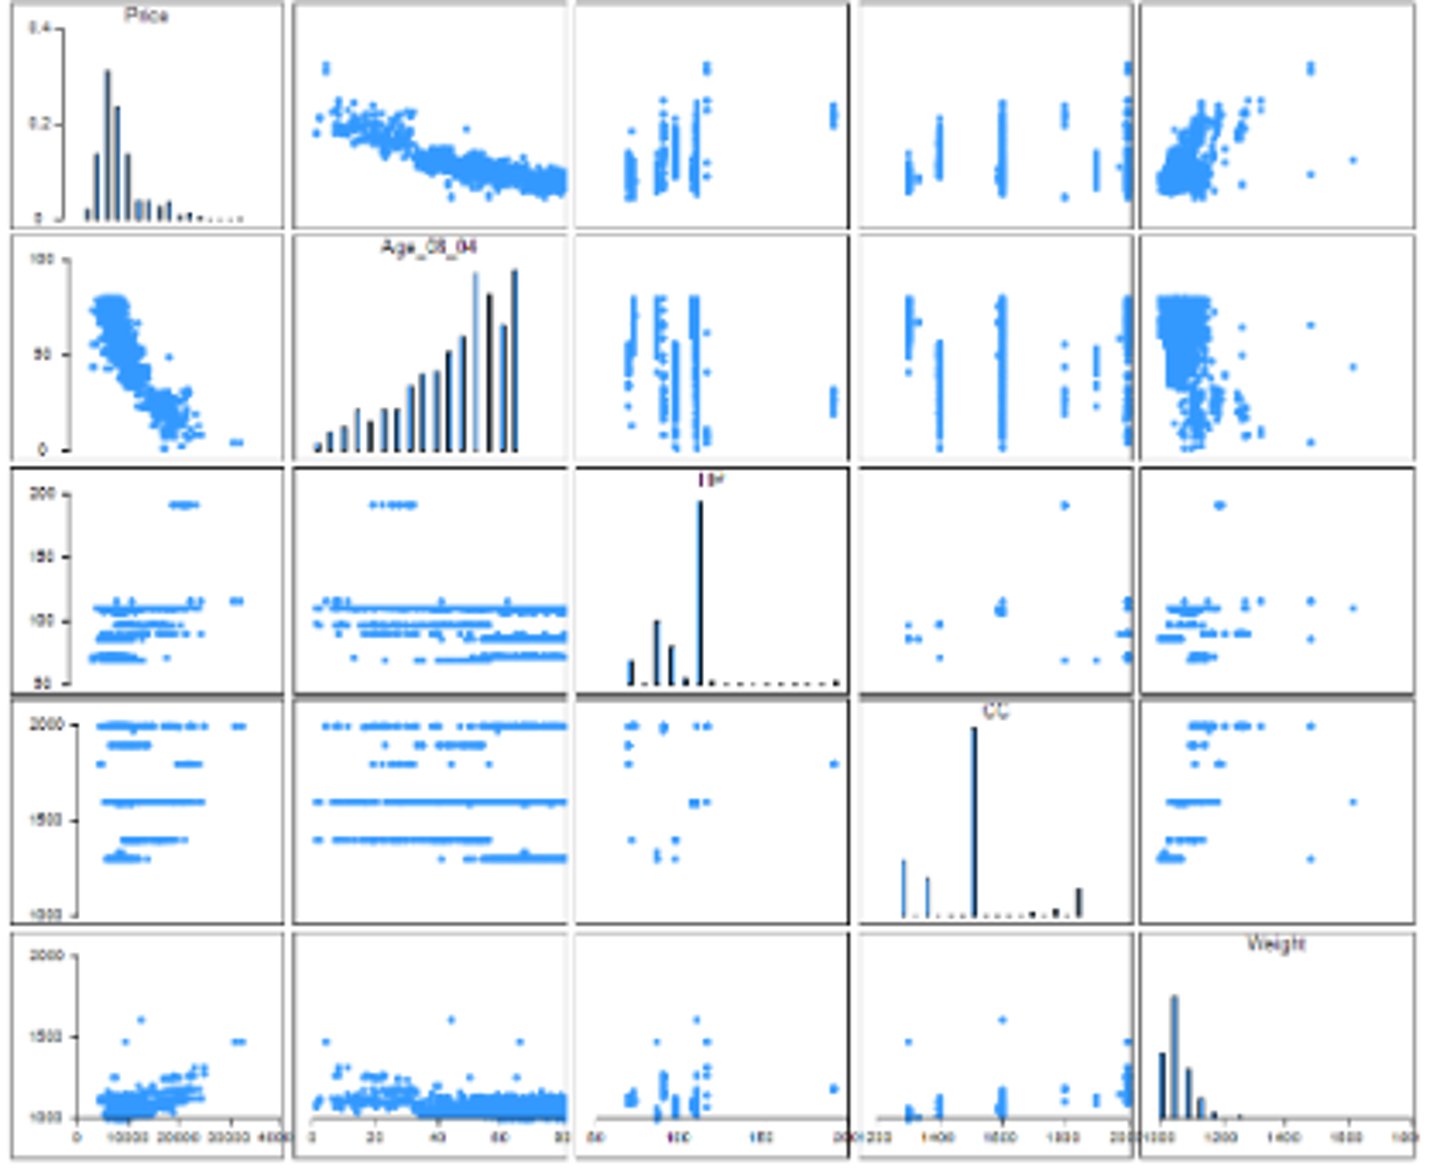
In the following scatter plot matrix, Price is the target variable. What predictor shows the strongest negative correlation with Price?
(read the variable name at the top of the histograms)
a. Weight
b. HP
c. Age_08_04
d. CC
c. Age_08_04
When we are building a linear regression model, against what model do we compare it to evaluate its significance?
a. Classification model
b. Logistic model
c. Naïve (average) model
d. Random model
c. Naïve (average) model
Which of the following is NOT a property of a linear relationship?
a. Proportionality of change
b. Could be causal or not
c. Must be causal
d. Association of change
c. Must be causal
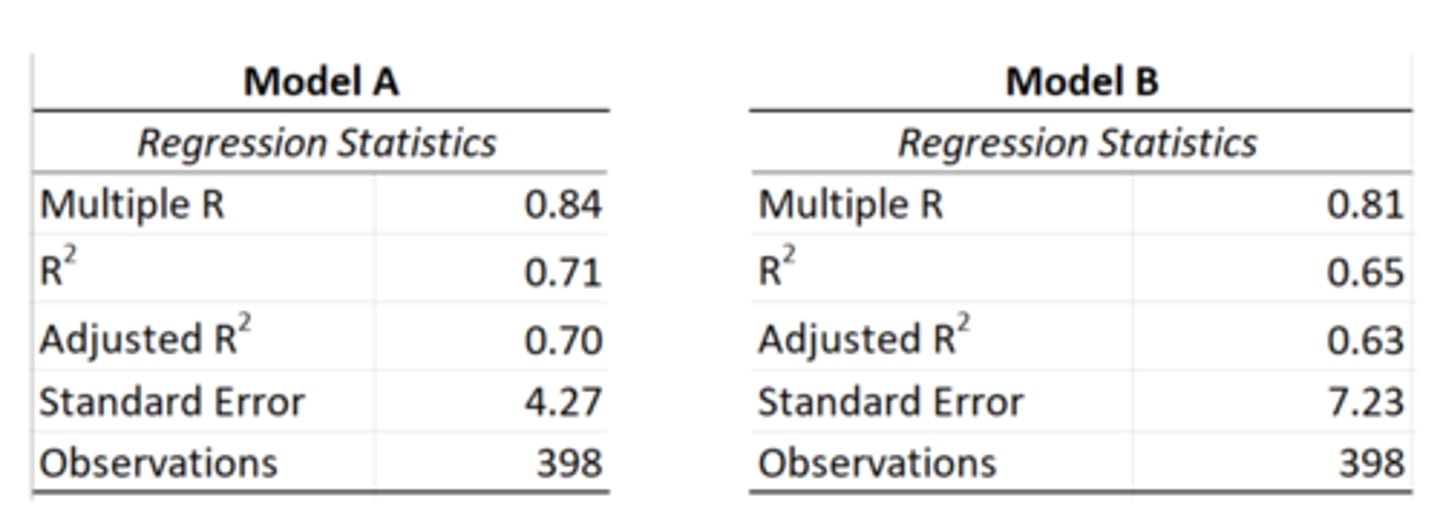
We have developed two different linear regression models on the same data set. Which model shows a better goodness-of-fit?
a. Models are the same
b. Model A
c. Not enough information
d. Model B
b. Model A
Categorical variables can NOT be used as predictors in the linear regression model.
T/F
False
The strongest predictor of a target variable is the variable with the correlation coefficient closer to zero.
T/F
False
In a linear regression model, the t-Test for each predictor's coefficient indicates if the estimated value is significantly different from zero.
T/F
True
The target variable in a multiple linear regression model must be a:
a. Nominal Variable
b. Binary variable
c. Ordinal variable
d. Numerical variable
d. Numerical variable
In the development of a linear regression model, what is the naive (based) model that we compare the performance of the linear model with?
a. Random guess
b. Average model
c. Simple linear model
d. Multiple linear model
b. Average model
What metric of the linear regression shows "absolute deviation from the model"?
a. Standard Error
b. t-Score
c. F-Score
d. Adjusted R2
a. Standard Error
Which of the followings is NOT a strategy to prevent model over-fitting?
a. Penalizing the model for including more variables
b. Adding variables to the model only if they improve the model performance and goodness-of-fit
c. Splitting data into train and validation sets
d. Set a limit on the value of R2 metric
d. Set a limit on the value of R2 metric
Which of the following variable selection methods for the linear regression model examines all possible combinations of variables?
a. Stepwise search
b. Forward selection
c. Backward elimination
d. Exhaustive search
d. Exhaustive search
In model training, ... measures how much the model's predictions fluctuate when given different input data.
a. p-value
b. Bias
c. Adjusted R2
d. Variance
d. Variance
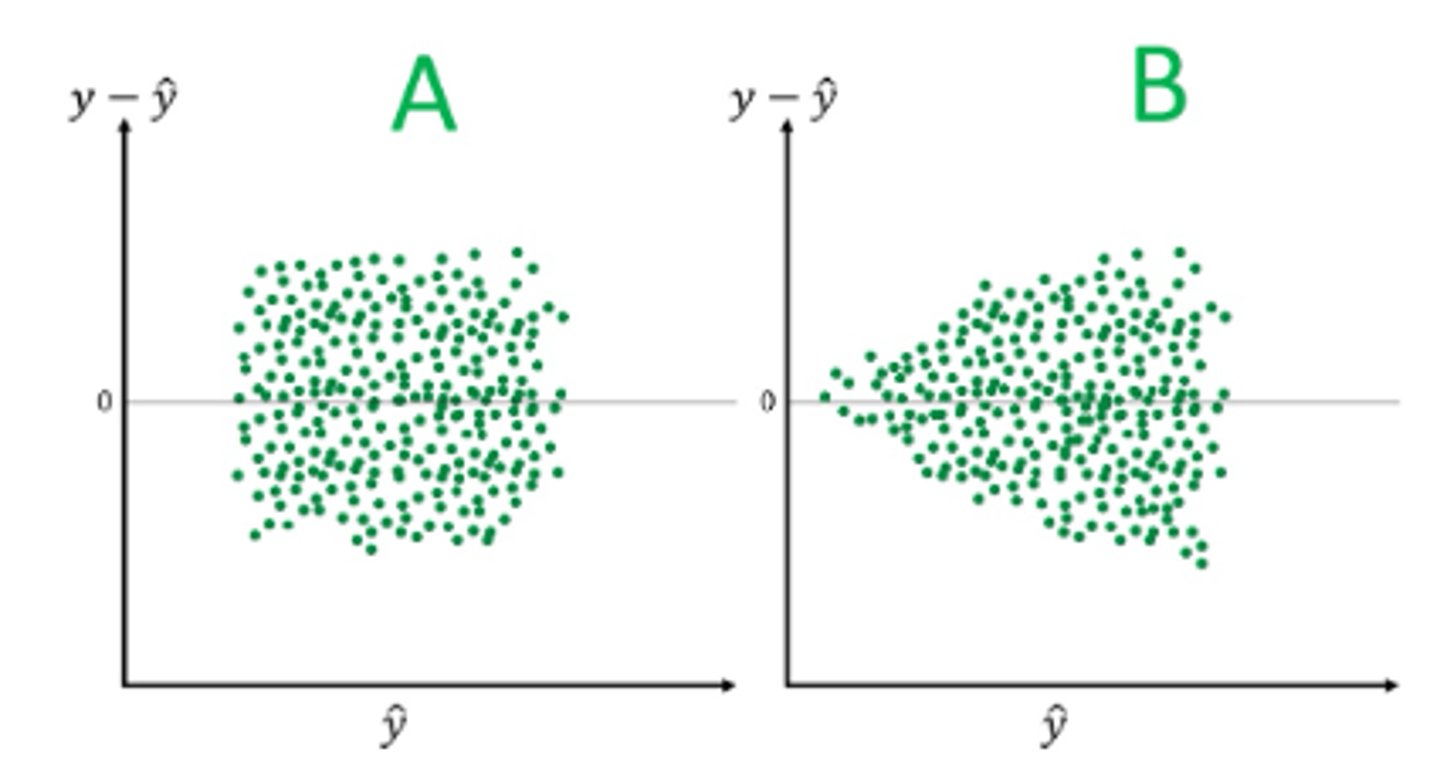
The following figure shows residual plots of two linear regression models A and B. Which of the following statements is CORRECT?
a. Model B is better than Model A because it shows smaller residuals
b. Model A is violating linearity assumption
c. Model B is violating homoscedasticity assumption
d. Both models have met all the assumptions of the linear regression model
c. Model B is violating homoscedasticity assumption
When a model captures both the underlying patterns and random fluctuations in data, it is called ...
a. optimal fitting
b. under-fitting
c. non-linear regression
d. over-fitting
d. over-fitting
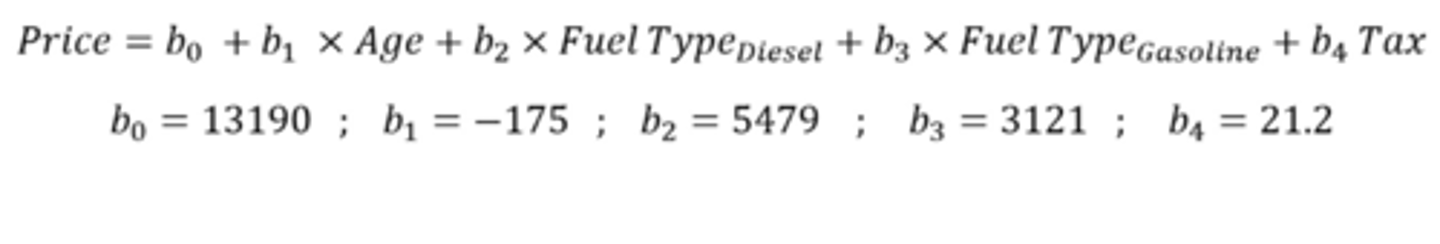
The following formula shows the model that we have developed to predict the average used car Price based on its Age, Fuel Type, and quarterly Tax amount (Fuel Type = Natural Gas is the model baseline). Use the model to predict the price of a car with the following characteristics:
Age = 12
Fuel Type = Diesel
Tax = 230
a. 19087
b. 24566
c. 15996
d. 21445
d. 21445
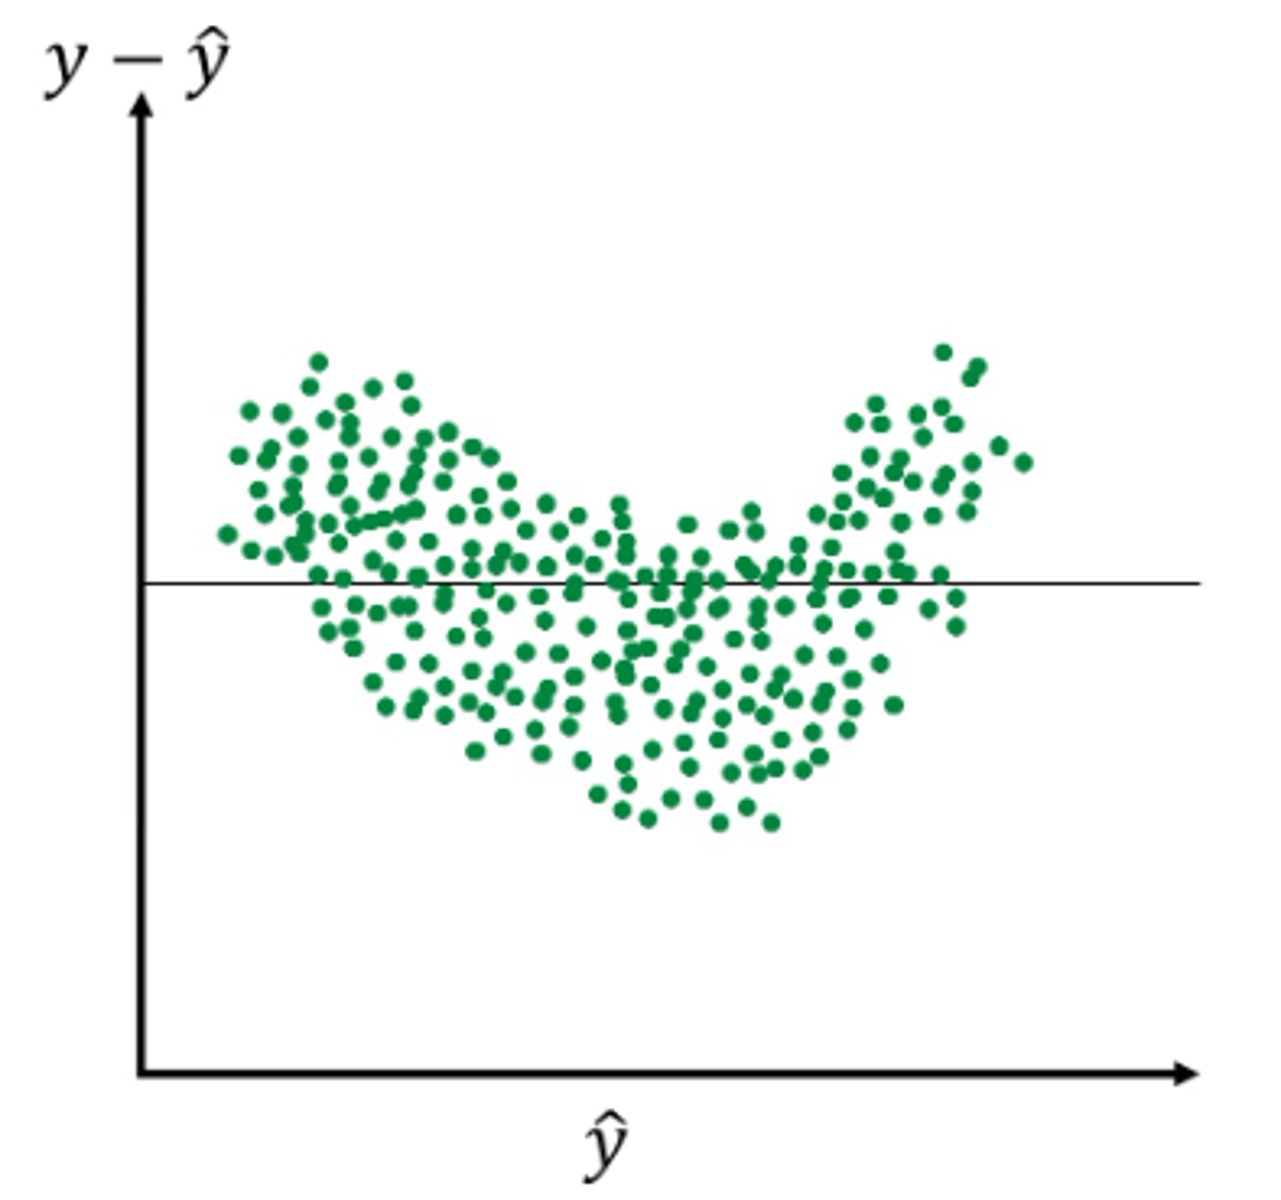
We have developed a linear regression model and the residual plots are shown in the following figure. What statement is CORRECT about the model?
a. Model is violating the homoscedasticity assumption
b. Model is violating the assumption of independence of observations
c. Model is not violating any of the linear regression assumptions
d. Model is violating the linearity assumption
d. Model is violating the linearity assumption
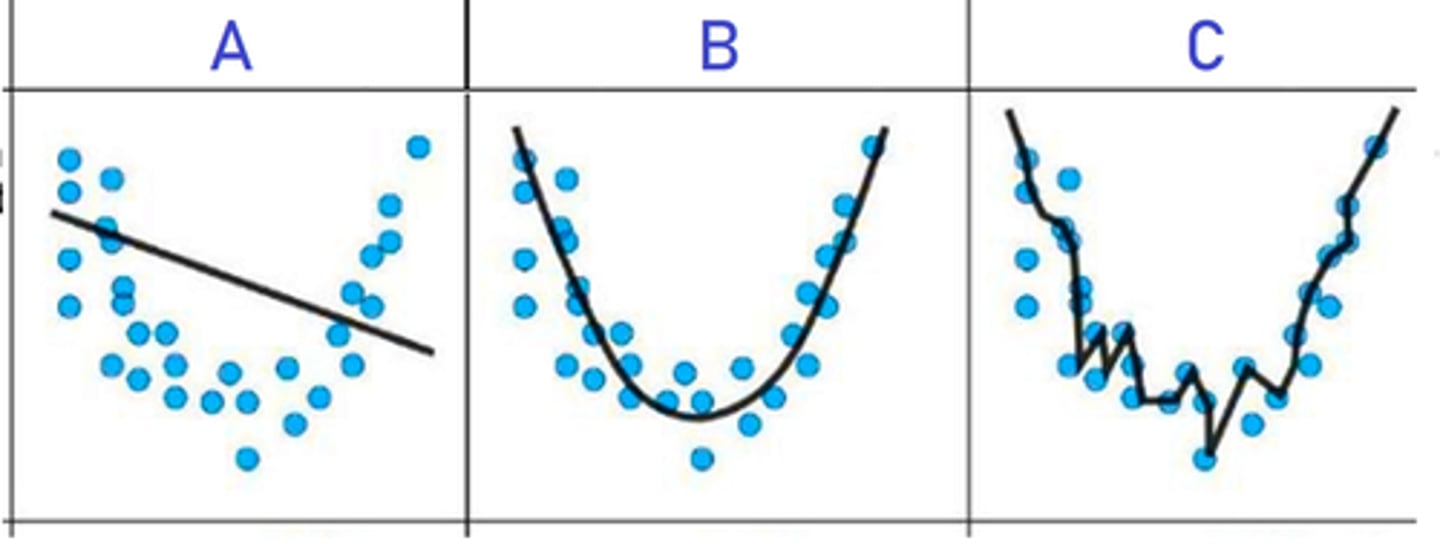
Which model is an OVER-FITTED model?
a. A
b. B
c. D
d. C
b. B
When a model is over-fitted the regression coefficients represent noise in the data, rather than the genuine relationships in the population
T/F
True
You are building a multiple linear regression model to predict median house price (MEDV) in Boston using a data set with 12 predictors as shown in the following correlation matrix. Based on the matrix, you would expect the violation of the multicollinearity assumption to happen between what variables?
Hint: multicollinearity means a strong linear relationship between two predictors (independent variables).
a. TAX & RAD
b. MEDV & PTRATIO
c. CHAS & NOX
d. MEDV & LSTAT
a. TAX & RAD
Increasing the data size can help reduce both over and under-fitting problems.
T/F
True
Which of the following models (the dark blue line) shows a case of underfitting?
a. C
b. A
c. B
d. None of the others
b. A

In the search for the best set of variables for the linear regression model, when the number of potential predictors is small, the exhaustive search method gives significantly different and better results than other methods.
T/F
False
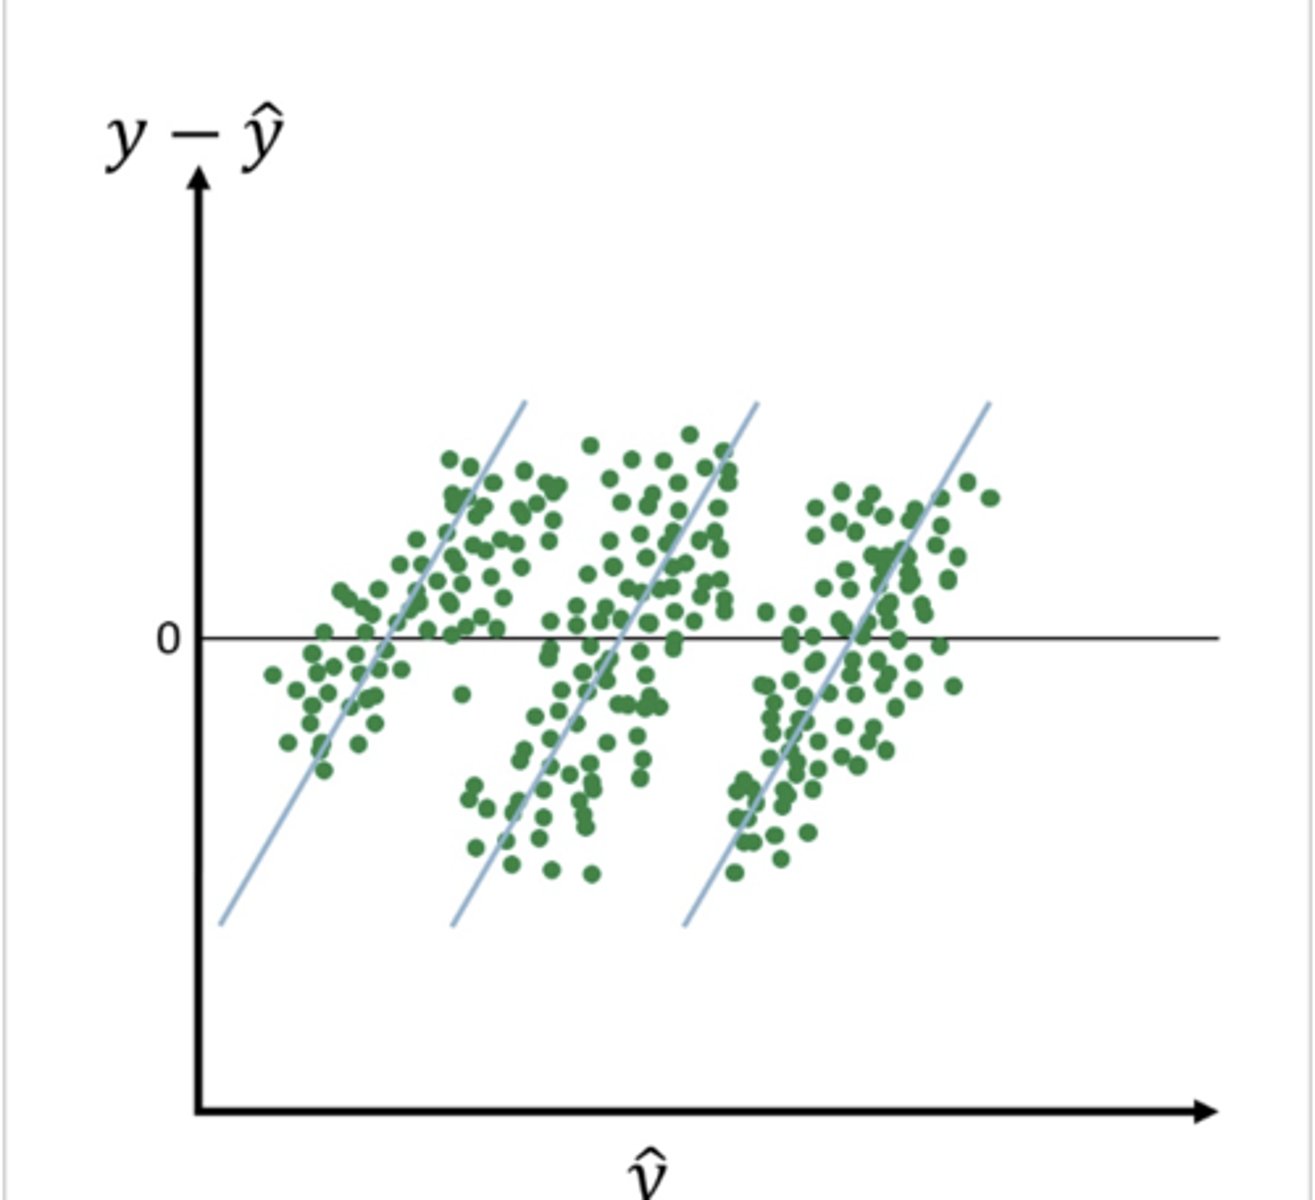
We have developed a linear regression model and the residual plots are shown in the following figure. What statement is CORRECT about the model?
a. Model is violating the assumption of independence of observations
b. Model is not violating any of the linear regression assumptions
c. Model is violating the homoscedasticity assumption
d. Model is violating the linearity assumption
a. Model is violating the assumption of independence of observations
Splitting the data set into training and validation is a method to avoid overfitting. We can calculate metrics such as RMSE and R2 for the training and validation sets. Under what conditions, we can tell the model is overfitted?
a. Low training and testing errors
b. Very low training error and high test error
c. Very high training and test errors
d. High training, but low testing error
b. Very low training error and high test error
Which of the following models (the dark blue line) shows a case of overfitting?
a. C
b. None of the others
c. A
d. B
a. C
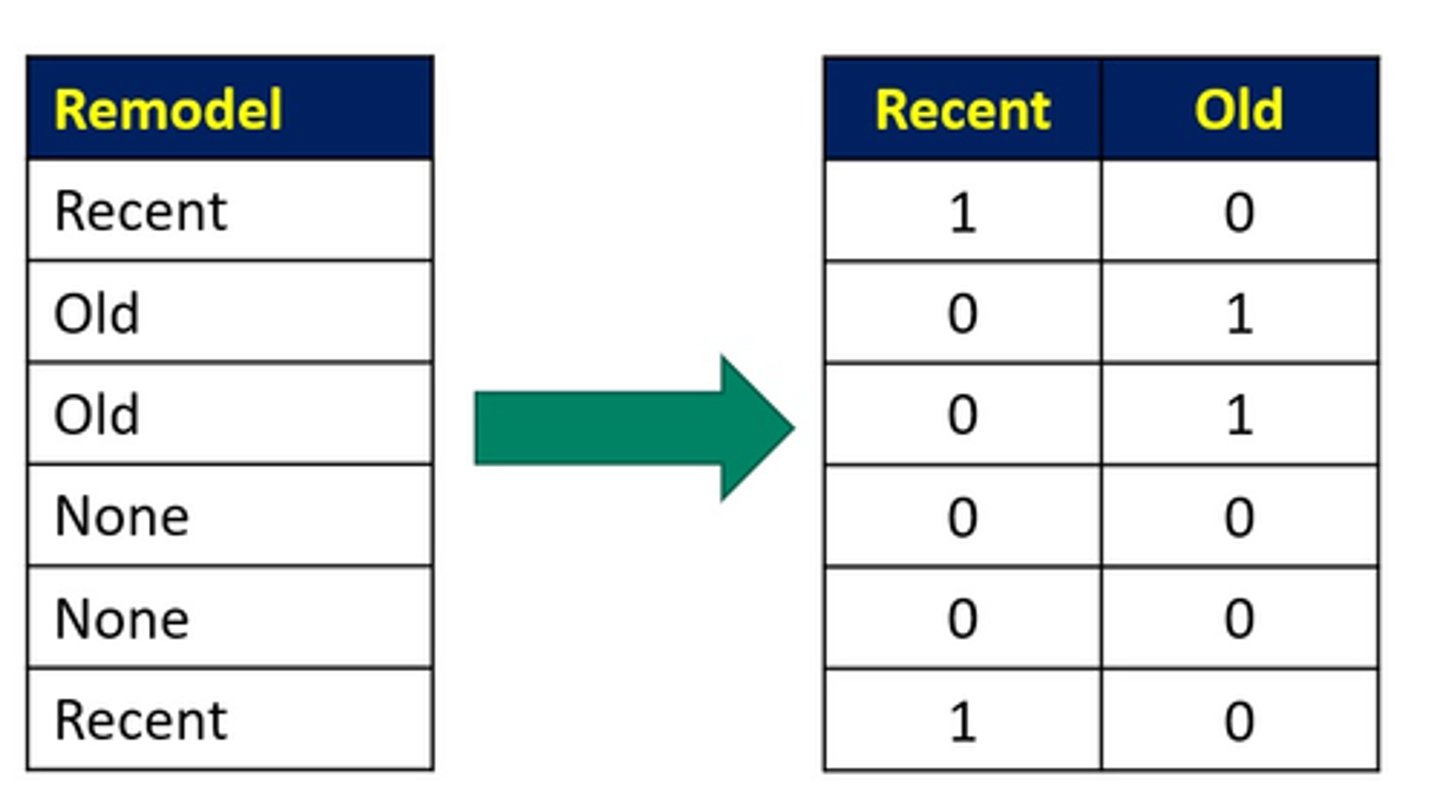
The following figure shows the logic for creating dummy variables from a categorical predictor called "Remodel". Which class level is considered the baseline (reference)?
a. "None"
b. "Old"
c. "Remodel"
d. "Recent"
a. "None"
We have trained a linear regression model and tested it on the validation set. Here are the results:
On the training set: RMSE is low, R2 is high
On the validation set: RMSE is low, R2 is high
What type of fit is this?
a. Over-fit
b. Good (optimized) fit
c. Under-fit
b. Good (optimized) fit
Which statement is INCORRECT about linear regression models?
a. Linear regression models are relatively easy to explain
b. In some cases, it is better to transform the variables before training the model to build a better model in terms of goodness-of-fit and accuracy
c. It is a very popular, robust, and flexible method for predicting numerical and categorical targets
d. Regression models are robust against violation of some assumptions such as normality assumption
c. It is a very popular, robust, and flexible method for predicting numerical and categorical targets
In the context of predictive model training .... is a measure that shows how much the model's predictions differ from the true values.
a. Bias
b. Variance
c. F-Test
d. R2
a. Bias