Charts, graphs, visuals, and printed communication, pie chart, bar graph, line graph, pictograph etc..
1/22
There's no tags or description
Looks like no tags are added yet.
Name | Mastery | Learn | Test | Matching | Spaced | Call with Kai |
|---|
No analytics yet
Send a link to your students to track their progress
23 Terms
What is a pie chart?
Also known as a circle graph, it is useful for depicting how a single unit or category is divided. The standard pie chart is a circle with designated wedges. Each wedge is proportional in size to a part of the whole
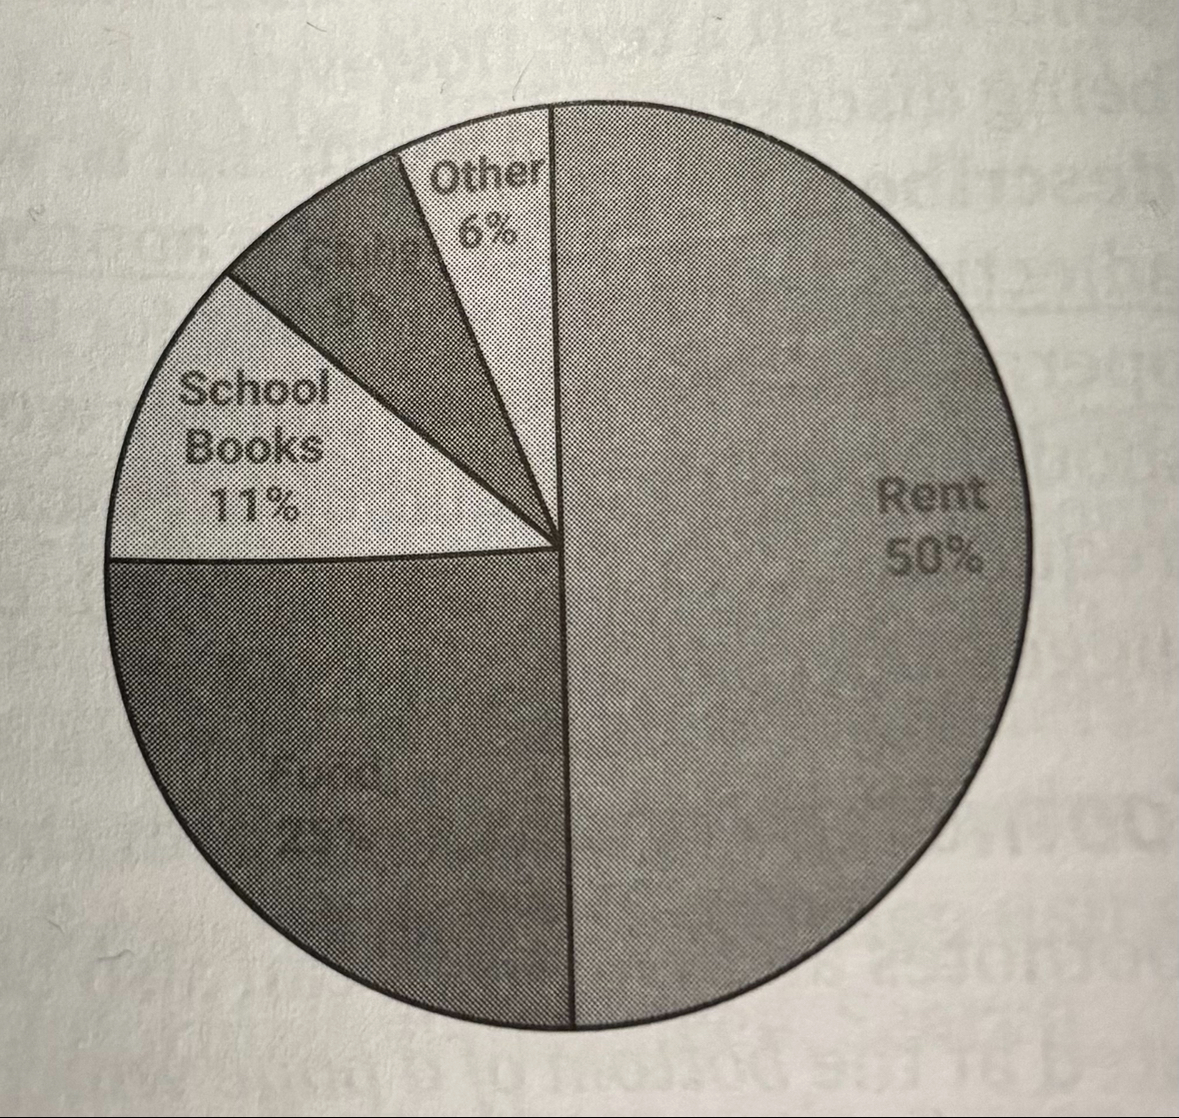
What is a good example of a pie chart?
For instance, consider Shawna, a student at City College, who uses a pie chart to represent her budget. If she spends half of her money on rent, then the pie chart will represent her budget. If she spends a quarter of her money on food, there will be a line extending from the edge of the circle to the center at a right angle to the line depicting rent. This illustration would make it clear that the student spends twice the amount of money on rent than she does on food
What is a pie chart considered effective in?
A pie chart is effective at showing how a single entity is divided into parts. They are not effective at demonstrating the relationships between parts of different wholes. For example, an unhelpful use of a pie chart would be to compare the respective amounts of state and federal spending devoted to infrastructure, since these values are only meaningful in the context of the entire budget
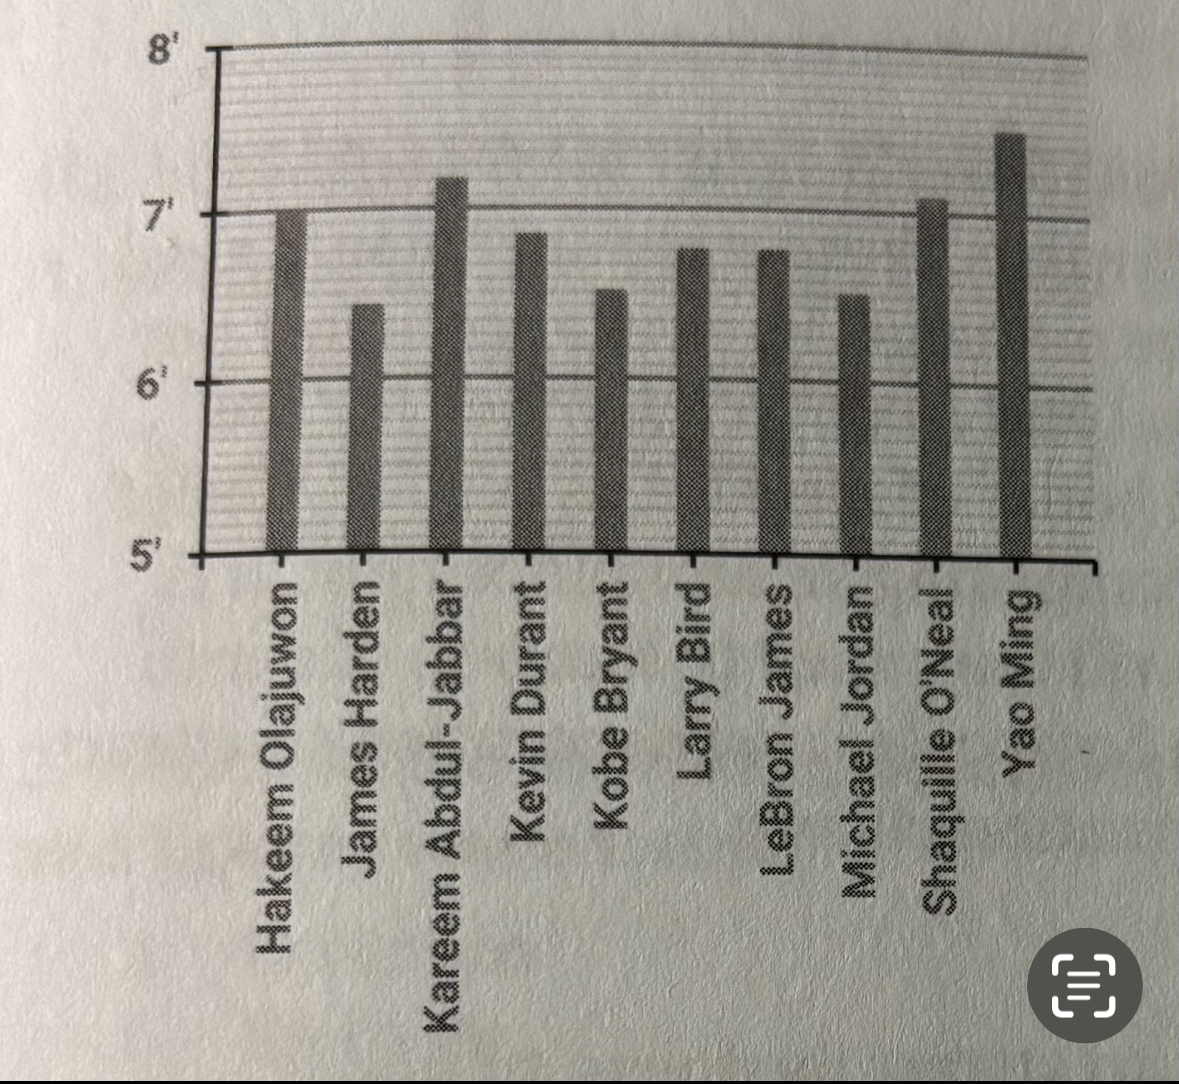
What is a bar graph?
It is one of the most common visual representations of information. Bar graphs are used to illustrate sets of numerical data.
What does a bar graph contain?
The graph has a vertical axis along which numbers are listed and a horizontal axis along which categories, words, or some other indicators are placed.

What is an example of a bar graph?
It is a depiction of the respective heights of famous basketball players: the vertical axis would contain numbers ranging from five to eight feet, and the horizontal axis would contain the names of the players. The length of the bar above the player’s name would illustrate his height listed along the left side.
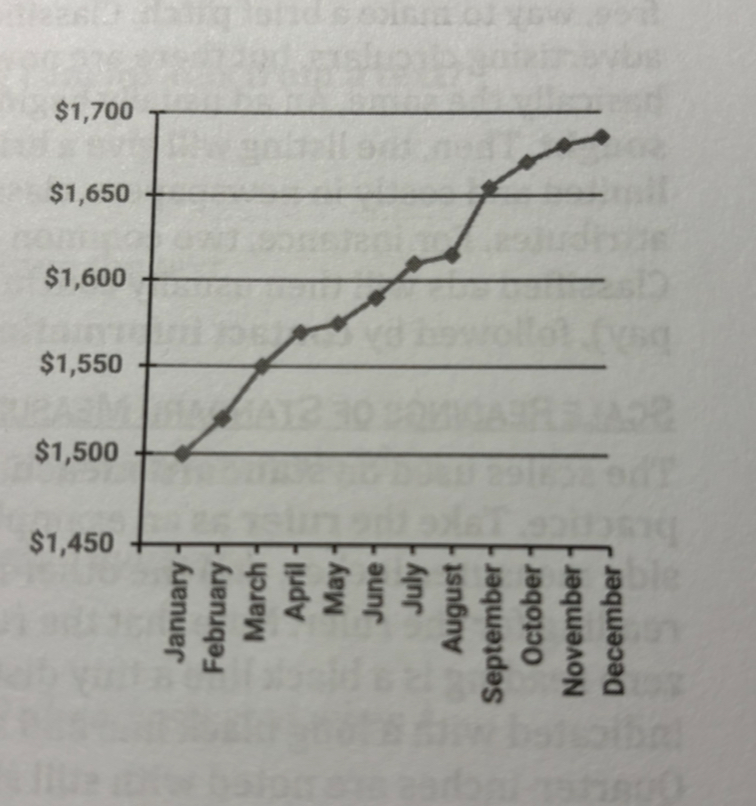
What is a line graph, and what is it used for?
It is a type of graph that is typically used for measuring trends over time. The graph is set up along a vertical and horizontal axis
Where are the variables being measured listed along in a line graph?
the left side and the bottom side of the axes. Points are then plotted along the graph as they correspond with their values for each variable
What is a good example of a line graph?
For instance, consider a line graph measuring a person’s income for each month of the year. If the person earned $1500 in January, there should be a point directly above January (perpendicular to the horizontal axis) and directly to the right of $1500 (perpendicular to the vertical axis). Once all of the lines are plotted, they are connected with a line from left to right
What is a pictograph?
A graph that is generally in the horizontal orientation, which uses pictures or symbols to represent data.
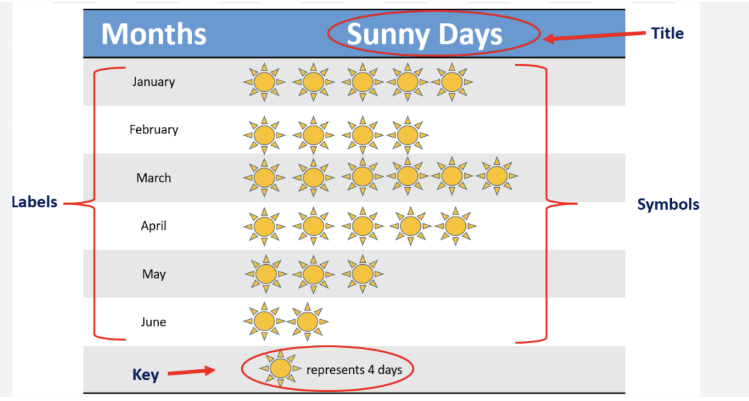
What should each pictograph have?
Each pictograph must have a key that defines the picture or symbol and gives the quantity each picture or symbol represents
Pictures and symbols on a pictograph are not always shown as whole elements. What happens in this case?
In this case, the fraction of the picture or symbol shown represents the same fraction of the quantity a whole picture or symbol stands for
What are the different types of printed communication?
Memo
Posted announcement
Classified advertisement
Scale readings of standard measurement instruments
What is a memo?
short for memorandum, is a common form of written communication. There is a standard format for these documents. It is typical for there to be a heading at the top indicating the author, date, and recipient.
In a memo, what happens in some cases?
The heading in a memo will also include the author’s title and the name of his or her institution. Below this information will be the body of the memo.
Memos are considered to be official documents, so they are usually written in a formal style
true
How are many memos organized in?
with numbers or bullet points, making it easier for the reader to identify the key ideas
According to posted announcement, when composing an announcement, it is important to consider the perspective of the audience—what will they need to know in order to respond to the message? Although a posted announcement can have color and decoration to attract the eye of the passerby, it must also convey the necessary information clearly
true
What is a classified advertisement used for?
to sell or buy goods, to attract business, to make romantic connections, and to do countless other things
An ad begins with what?
a word or phrase indicating what is being sold or sought. Then the listing will give a brief description of the product or service
According to scale readings of standard measurement instruments, it is best said that..
the scales used on standard measurement instruments are fairly easy to read with a little practice, take the ruler as an example
According to interpreting events in a sequence, it is best said that,
Often, the sequence of steps or events in a text is indicated by signal words like: first, then, next, before, and last.
What is a good example of interpreting events in a sequence?
“He walked through the garden and gave water and fertilizer to the plants.” Clearly, the man did not walk through the garden before he collected and fertilizer for the plants. So, the implied sequence is that he first collected water, then he collected fertilizer, next he walked through the garden, and last he gave water or fertilizer as necessary to the plants. Texts do not always proceed in an orderly sequence from first to last