STATS FINAL Study Guide
1/56
There's no tags or description
Looks like no tags are added yet.
Name | Mastery | Learn | Test | Matching | Spaced |
|---|
No study sessions yet.
57 Terms
What are the 5 scales of measurement?
binary, nominal, ordinal, interval, ratio
What are the 3 Scales of measurement for Categorical variables?
Categorical: entities are divided into distinct categories
binary variable: there are only two categories (ex. dead or alive)
nominal variable: there are more than two categories (ex. whether someone is an omnivore, vegetarian, or vegan)
ordinal variable: the same as a nominal variable but the categories have a logical order (ex. whether people got a fail, a pass, a merit or a distinction in their exam)
What are the 2 Scales of measurement for Continuous variables?
Continuous: entities get a distinct score
interval variable: equal intervals on the variable represent equal differences in the property being measured (ex. the difference between 6 and 8 is equivalent to the difference between 13 and 15)
ratio variable: the same as an interval variable, but the ratios of scores on the scale must also make sense and have true 0 value (ex. a score of 16 on an anxiety scale means that the person is, in reality, twice as anxious as someone scoring 8)
What are the 4 types of reliability?
Reliability: The ability of the measure to produce the same results under the same condition
Test-retest reliability: The ability of a measure to produce consistent results when the same entities are tested at two different points in time
Inter-rater reliability: Consistency across people. Do they produce the same answer?
Parallel forms reliability: Do different measures that are supposed to measure the same thing actually measure it the same? (Two different eye trackers)
Internal consistency reliability: Do things that are supposed to measure the same thing actually measure it? (Multiple questions measuring IQ)
examples:
inter-rater: Two judges measuring the speed of 20 athletes. If their results are very similar, the results show high inter-rater reliability.
the degree of agreement among independent observers who rate, code, or assess the same phenomenon.
test-retest: Consistent results are measured over various occasions.
measures the stability of the scores of a stable construct obtained from the same person on two or more separate occasions. Reliability concerns the degree to which scores can be distinguished from each other, despite measurement error.
**internal consistency: A person agreeing with the statement, "I like to ride bicycles" and "I've enjoyed riding bicycles in the past", and disagreeing with the statement "I hate bicycles". This would show good internal consistency of the test.
a measure based on the correlations between different items on the same test.
parallel forms: Randomly splitting a 100-question test into Test A and Test B which both contain 50 questions. If the results show a high correlation, there is parallel forms reliability.
measure of reliability obtained by administering different versions of an assessment tool (both versions must contain items that probe the same construct, skill, knowledge base, etc.) to the same group of individuals.
What are the 5 types of validity?
Internal validity: the extent to which you are able to draw the correct conclusions about the causal relationships between variables
External validity: the generalizability of your findings. To what extent do you expect to see the same pattern of resuts in “real life” as you saw in your study
Construct validity: whether you’re actually measuring what you want to be measuring
Face validity: whether or not a measure “looks like” it’s doing what it’s supposed to
Ecological validity: the entire set up of the study should closely approximate the real world scenario that is being investigated
What are arithmetic and logical operators in R?
Arithmetic operators: +, -, *, /, ^
Logical operators: == (equality), != (inequality), <, <=, >, >=, & (AND), | (OR), ! (NOT)
What is a function in R? What are arguments?
A function performs a specific tast
a tool that R uses to complete some kind of operation (ex. mean() creates average of a set of values)
Can take more than one argument. Separate argument by using commas. A lot of arguments use the default values if those are not specialized.
Arguments are values you provide to customize the function’s behavior.
Example:
mean(x, na.rm = TRUE)→xandna.rmare arguments
*ROUND BRACKETS
How do you assign a value to a variable in R?
Use <- or =
Example:
x <- 5assigns the value 5 tox
What are the 4 common variable types?
numeric: 3.14, 5, 1e+03, x = as.numeric("7")
as.numeric stores a string as a number
character: "text"
logical: TRUE, FALSE
vector: ordered collection of values of the same type
What do the special values Inf, NA, NaN, NULL represent in R?
Inf: infinite value (e.g. 1/0)
NA: missing value (not a variable)
NaN: not a number (e.g. 0/0)
NULL: no value or object
How do you create and access elements (vector indexing) of a vector in R?
A vector is a collection of data that must consist of the same type (ex. all numeric or all text) → variables that store multiple pieces of information
Create:
v <- c(1, 2, 3)→ c() combines a set of values and stores them as a vector (a collection of those numbers)Access elements:
v[1]returns the first element
Numeric vector: age <- c( 34, 4, 35, 67, 3, 5 )
Character vector: names <- c( “Jane”, “Bob”, “Max”, “Lara”, “Camilla” )
Logical vector: sleepy <- c( TRUE, FALSE )
You can label the elements in a vector: times <- c( time1 = 0.52, time2 = 0.67, time3 = 0.98 )
How do you install and load a package in R?
A package is a collection of R functions and data
Install:
install.packages("package_name")Load:
library(package_name)
What are data frames, matrices, and matrix subsetting in R?
Data frame: table where columns can have different types → the way R stores a typical data set
a collection of data that can contain different types (ex. both numeric and text)
collection of variables “bundled” together
Organized into a “case by variable” matrix: Each row is a “case”, each column is a named “variable”
Matrix: table where all elements are the same type
Matrix Subsetting:
df[rows, columns], e.g.,df[1, 2]To access a variable in a dataset = dataset$variable
This tells to R to look for a vector called as the name of the variable you’re interested in that is stored in the given dataset
Variables inside data frames behave the same way as any other variable
To change the values of variables in a dataset: dataset$variable[1] <- newvalue
To add variables to a dataset: dataset$newvariable <- dataset$existingvariable > newvalue
To remove variables is even easier: dataset$variable <- NULL
How do you read a file into R?
read.csv(“filename.csv“)
*make sure you’re in the right directory
How do you save and load a workspace in R?
Save:
save.image("my_workspace.RData")Load:
load("my_workspace.RData")
Which 5 functions summarize a data frame in R?
summary(df)→ basic statsstr(df)→ structure of datahead(df)→ first rowstail(df)→ last rowsdim(df)→ dimensions of data
What are the 4 measures of central tendency?
Central tendency is where most of the data is concentrated
Mean: the average of all values
value from which the (squared) scores deviate least (it has the least error)
Trimmed mean:
Median: the middle value when data are ordered
Mode: the value that occurs most frequently in the dataset → use lsr package
What are 5 common measures of dispersion/spread?
Measures of dispersion describe how spread out the data are.
Range: difference between the highest and lowest values
Interquartile Range (IQR): difference between the 75th and 25th percentiles
Variance: average of squared deviations from the mean
not always smaller than the standard deviation
variance of the sample is an unbiased estimate of the variance of the population
Standard Deviation (SD): square root of the variance; shows average distance from the mean
affected by outliers
SD of 0 shows a dataset with a small range
Quantiles: values that divide the data into equal-sized intervals
Important to remember: The sum of squares, variance, and standard deviation represent all the same thing: The ‘fit’ of the mean to the data, the variability in the data, How well the mean represents the observed data, Error, Descriptive statistics in R
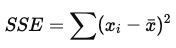
What are deviations and sums of squared errors?
Deviation is the difference between a data point and the mean of the dataset
The sum of squared errors (SSE) is the sum of all squared deviations
the sum of the squares of residuals (deviations from the actual data values). It is a measure of the discrepancy between the data and an estimation model for the data. A small RSS indicates a tight fit of the model to the data. It is just squaring the values of the deviations. It is a good measure of overall variability, but is dependent on the number of scores
*used to calculate variance and standard deviation, which measure the overall spread of data around the mean
What is skewness? What 3 types exist?
Skewness measures the asymmetry of a distribution:
Positive skew (right-skewed): tail extends to the right; most values are low (long tail of large values)
Negative skew (left-skewed): tail extends to the left; most values are high (a long tail of small values)
Zero skew: symmetric distribution (e.g., normal distribution)
skew() [psych package]
normal range = Skew: -1, 1
What is kurtosis? What 3 types exist?
Kurtosis measures the pointiness of a distribution:
Leptokurtic: heavy tails and sharp peak (more outliers) → too pointy, kurtosis > 0
Platykurtic: light tails and flatter peak (fewer outliers) → too flat, kurtosis < 0
Mesokurtic: normal distribution (baseline kurtosis) → kurtosis = 0
kurtosis() [psych package]
normal range = Kurtosis: -2, 2
What is correlation in statistics? - Relations between variables
Correlation measures the strength and direction of a linear relationship between two continuous variables.
The correlation coefficient (r) ranges from −1 to +1:
r = +1: perfect positive linear relationship
r = −1: perfect negative linear relationship
r = 0: no linear relationship
EXTRA: Commonly used methods:
Pearson correlation: for linear relationships with normally distributed data
Spearman rank correlation: for ordinal data or non-linear relationships
What are Descriptive Statistics? - extra
A way to characterize some data we collected (our sample) without attempting to go beyond that data (to understand a population)
extra: They are numbers that are used to summarize and describe data. The word "data" refers to the information that has been collected from an experiment, a survey, a historical record, etc. Several descriptive statistics are often used at one time to give a full picture of the data. Descriptive statistics are just descriptive. They do not involve generalizing beyond the data at hand (which is done with inferential statistics).
Which R functions calculate descriptive statistics in R (8) and what are key arguments?
mean(x, na.rm = TRUE)→ meanmedian(x, na.rm = TRUE)→ medianmode()→ no base R function; use custom functionsd(x, na.rm = TRUE)→ standard deviationvar(x, na.rm = TRUE)→ variancerange(x, na.rm = TRUE)→ min and maxIQR(x, na.rm = TRUE)→ interquartile rangequantile(x, probs = c(0.25, 0.75))→ specific quantilesdescribe() → psych package
describeBy() → first parameter is the dataset, second is the variable used to define the groups, psych package
summary()
To calculate by groups: tapply(x, group, FUN)
Example:
tapply(df$score, df$group, mean)
How do you interpret the output of R’s descriptive statistics functions?
The IQR shows the spread of the middle 50% of values
How do you report descriptive statistics in APA format? - not needed for exam
State the statistic, sample size, and values clearly. Example:
The participants had a mean memory score of 78.5 (SD = 12.3), n = 120.
Guidelines:
Round values to two decimal places
Italicize statistical symbols (M, SD, n)
Use parentheses for SD and sample size
Which R functions create scatter plots, box plots, histograms, bar graphs, and line graphs?
Scatter plot:
plot(x, y)Box plot:
boxplot(y ~ group)Histogram:
hist(x)Bar graph:
barplot(heights)Line graph:
plot(x, y, type = "l")
What are common arguments to fine-tune plots in R? (6)
main = "Title"→ plot titlexlab,ylab→ axis labelscol→ colorpch→ point style in scatter plotslwd,lty→ line width and typeylim,xlim→ axis limits
How do you interpret information in R plots?
Scatter plot: shows relationship or correlation between two variables
Box plot: shows median, quartiles, and outliers
Histogram: shows distribution of one variable → skew, kurtosis, distribution shape, spread or variation in scores, unusual scores
Bar graph: compares categories (heights of bars = values)
Line graph: shows trends over continuous values or time
*Always look for patterns, outliers, skewness, and spread in the data
Define null and alternative hypothesis
Null hypothesis (H₀): no effect or no difference exists
Alternative hypothesis (H₁): there is an effect or difference
*Statistical tests evaluate whether data provide enough evidence to reject H₀
What is the relation between the null hypothesis, statistical testing, and the p-value?
What is a p-value? (NAME of it)
The probability of obtaining results at least as extreme as the observed results, assuming H₀ is true
If p < α (alpha, commonly 0.05), H₀ is rejected
What is a rejection region? (in hypothesis testing?) and what two things is it based on?
The range of test statistic values that leads to rejecting H₀
It is based on:
The test distribution (e.g., t, χ², F)
The significance level (α)
Rejection regions for different distributions (e.g., c2 -distribution, t-distribution, F-distribution)
What is the a-level? (alpha)
What’s the difference between one-sided and two-sided tests?
One-sided test: tests for an effect in one direction only (e.g., mean > 0)
Two-sided test: tests for an effect in either direction (e.g., mean ≠ 0)
Two-sided tests are more conservative and commonly used
What is the difference between significance and effect size?
What is the exact definition of a confidence interval?
A confidence interval gives a range of values within which the true population parameter is likely to fall, based on the sample data.
Example: a 95% CI means that if the same sampling process were repeated many times, approximately 95% of the calculated intervals would contain the true parameter.
How do you interpret a confidence interval in relation to the null hypothesis?
If a 95% CI does not include the null value (e.g., a difference of 0), you reject H₀ at α = 0.05.
If the CI includes the null value, the result is not statistically significant.
How do you compute a confidence interval for a mean in a t-test?
qs: Computation of a confidence interval for a t-test
ˉ = sample mean
t∗t^*t∗ = critical t-value for the confidence level and degrees of freedom
sss = sample standard deviation
nnn = sample size
What’s the difference between information about a sample and information about a population?
A sample is a subset of individuals from a population.
A population includes all possible individuals of interest.
*Sample statistics (e.g., sample mean) are used to estimate population parameters (e.g., population mean).
What is the sampling distribution of the mean?
It is the distribution of sample means you would get if you repeatedly took samples from the population.
It describes how sample means vary from sample to sample.
What is the standard error? - Sampling distribution of the standard deviation
The standard error (SE) is the standard deviation of the sampling distribution of the sample mean: measure of the variability of a statistic
SE = s/root(n)
where s is sample standard deviation and n is sample size.
It reflects the precision of the sample mean estimate.
Depends on three factors:
The number of observations in the population
The number of observations in the sample
The way that the random sample is chosen
What are 3 things the central limit theorem states about large sample sizes?
The sampling distribution of the mean approaches a normal distribution, regardless of the population distribution.
The mean of the sampling distribution equals the population mean.
The standard deviation of the sampling distribution decreases as sample size increases.
the mean of the sampling distribution is the mean of the population
the standard deviation of the sampling distribution is smaller for larger samples
the sampling distribution approaches normality for large samples
How do we estimate the population mean and standard deviation?
Population mean: estimated by the sample mean xˉ\bar{x}xˉ.
Population standard deviation: estimated by the sample standard deviation sss.
Larger samples provide more accurate estimates.
What is a Type I error?
A Type I error occurs when you reject a true null hypothesis.
It’s also called a false positive.
The probability of making a Type I error is set by the α level (e.g., α = 0.05 means a 5% chance of this error).
What is a Type II error?
A Type II error occurs when you fail to reject a false null hypothesis.
It’s also called a false negative.
The probability of a Type II error is denoted by β.
What is the relation between the probability of a Type I error and the p-value?
The p-value estimates the probability of observing the data (or more extreme) if H₀ is true.
If p < α, you reject H₀, accepting a risk of Type I error equal to α.
What is the relation between the probability of a Type II error and statistical power?
Power = 1 − β
Power is the probability of correctly rejecting a false null hypothesis.
Higher power means lower risk of Type II error.
Power increases with larger sample size, larger effect size, and lower variability.
What is a crossed design?
In a crossed design, every level of one factor occurs with every level of another factor.
Example: a 2 (gender) × 3 (treatment type) design where each gender experiences all treatment levels.
What is a balanced design?
A balanced design has equal sample sizes in each group or condition.
Balanced designs simplify statistical analysis and improve power.
What are marginal means in factorial ANOVA?
qs: Marginal means as group means in factorial ANOVA’s
Marginal means are the average group means across levels of another factor.
They help interpret main effects in factorial ANOVA by averaging over the levels of the other factor(s).
What are degrees of freedom (df)?
Degrees of freedom represent the number of independent values that can vary in an analysis without violating any constraints.
𝑑𝑓 = number of observations − number of estimated parameters (constraints)
Important information that is not provided in this document, but that is part of the materials for the final exam includes:
How to calculate the test statistic for each statistical test
How to report the results of each statistical test
How to interpret the R output of each statistical test
You will not be asked to do the following in the exam:
Calculate pooled standard deviations for independent samples t-tests and paired samples t-tests
Calculate the sums of squares for one-way and factorial ANOVAs (You may be asked to calculate the mean of squares or the F-statistic given the sums of squares, however)
Apply the Yates continuity correction (Make sure you know what it is and when to apply it, though)
Answer questions about unbalanced factorial ANOVAs or contrast coding
Indexing in a data frame
To request the first element of a vector: dataset$variable[1]
To request the value in the first row and second column: dataset[1,2]
To request the value found in the first raw and the column of a certain variable: dataset [1, variable]
To pull out an individual row: dataset[4,]
To pull out lots of rows: dataset[ c( 1,4,7,9 ) ]
Getting a subset of cases (rows) and variables (columns): dataset[ c( 1,4,7,9 ), c( “variable1”, “variable2”, “variable3” ) ]
Pull out all cases (rows) that satisfy a criterion: subset( dataset, variable == “level” )
Factors
Factors look like character vectors but are much richer than that. They come in when we’re dealing with nominal scale variables. In fact, a factor is a indicates a nominal scale variable. You can use the as.factor() command to convert something into a factor. Factors are important especially for ANOVA.