Looks like no one added any tags here yet for you.
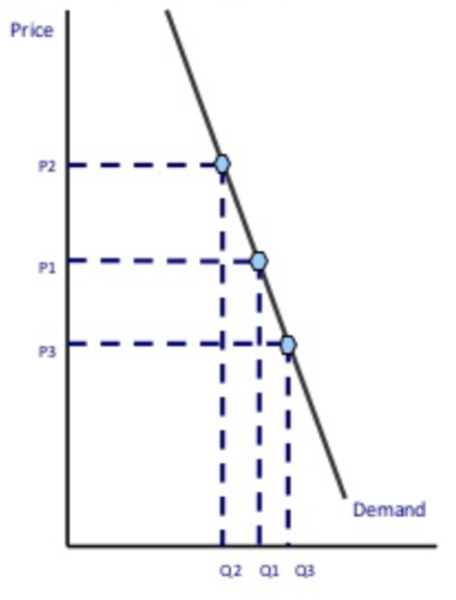
elasticity of demand - relatively elastic
PED > 1
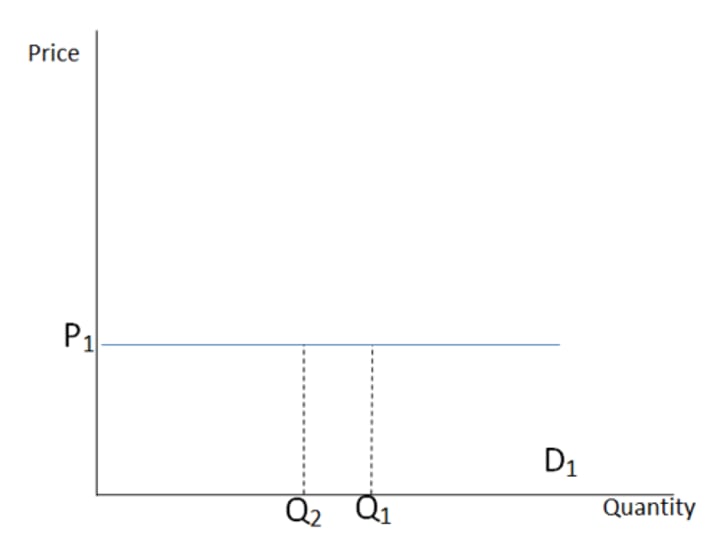
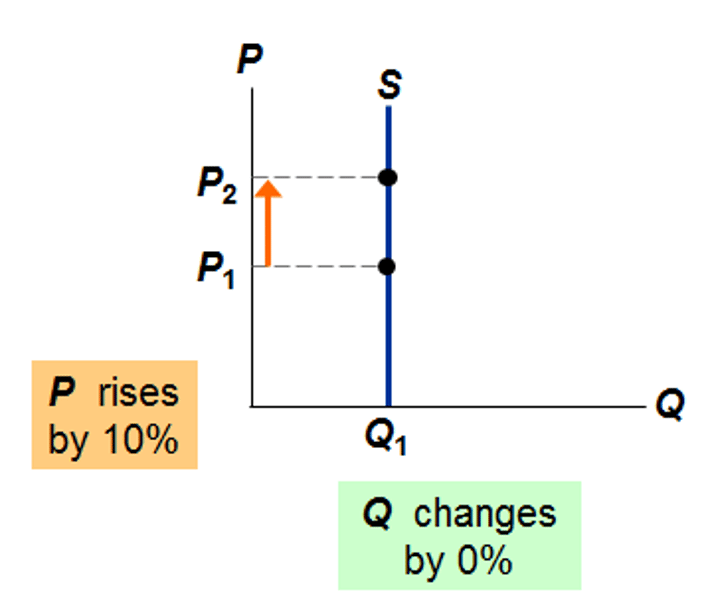
elasticity of demand - completely inelastic
PED = 0
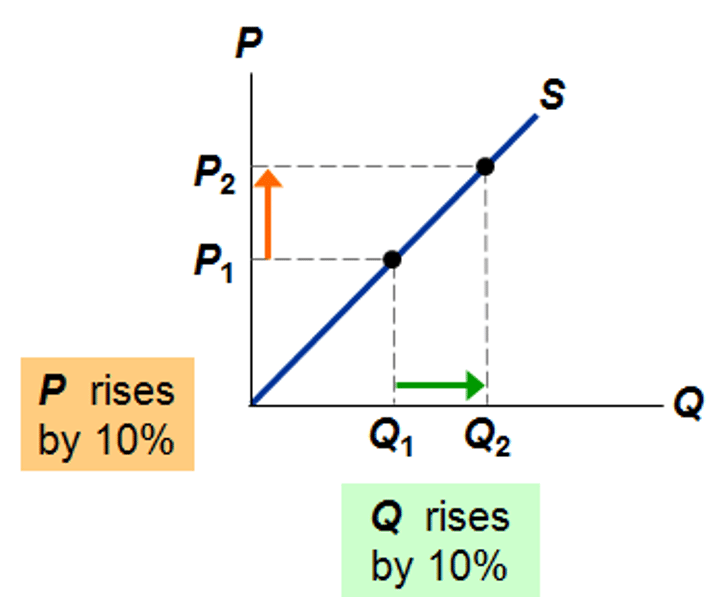
elasticity of supply - unitary elastic
PES = 1
elasticity of demand - perfectly elastic
PED = infinity
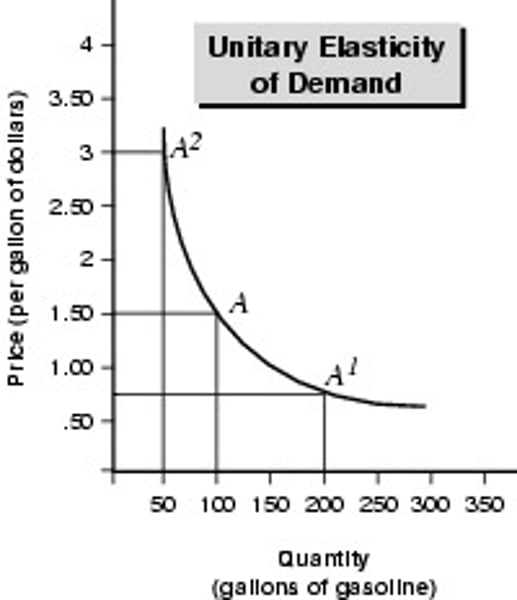
elasticity of demand - unitary elastic
PED = 1
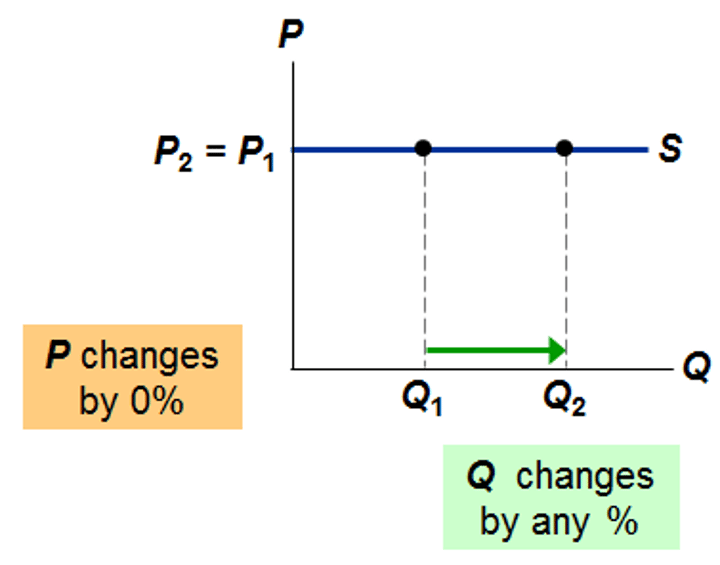
elasticity of supply - perfectly elastic
PES = infinity
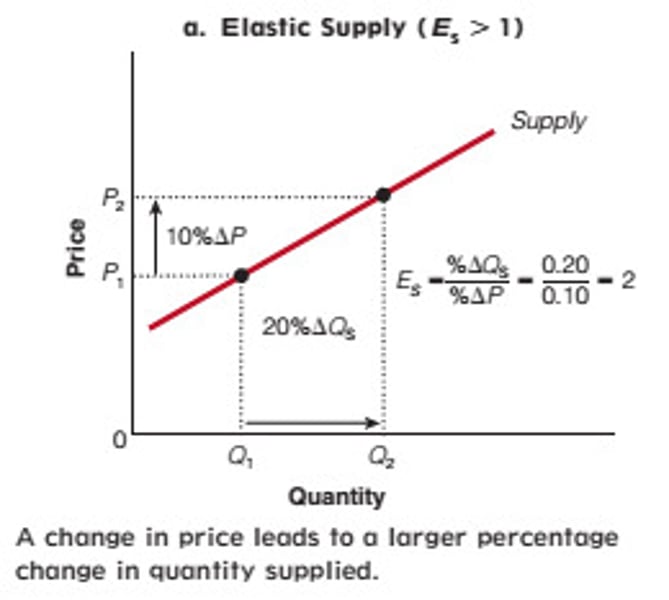
elasticity of supply - relatively elastic
PES > 1
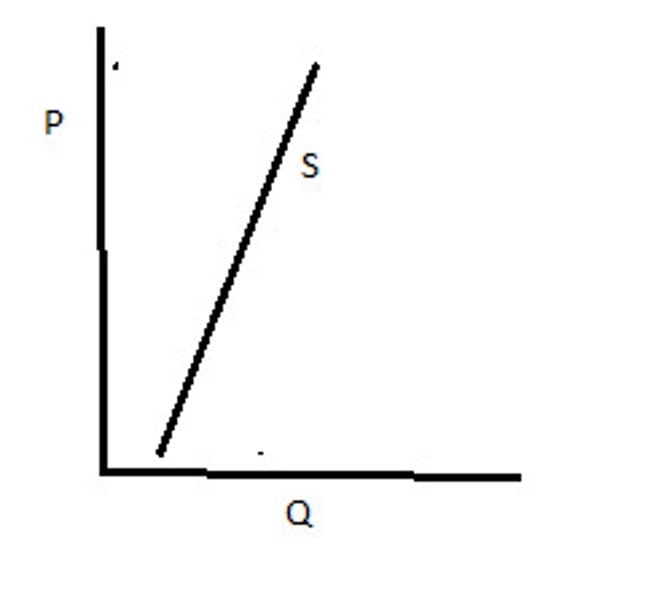
elasticity of supply - relatively inelastic
PES < 1
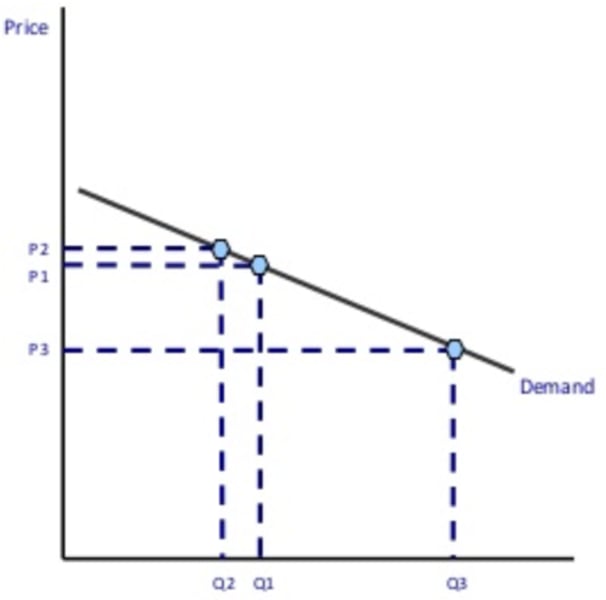
elasticity of demand - relativity inelastic
PED < 1
elasticity of supply - completely inelastic
PES = 0
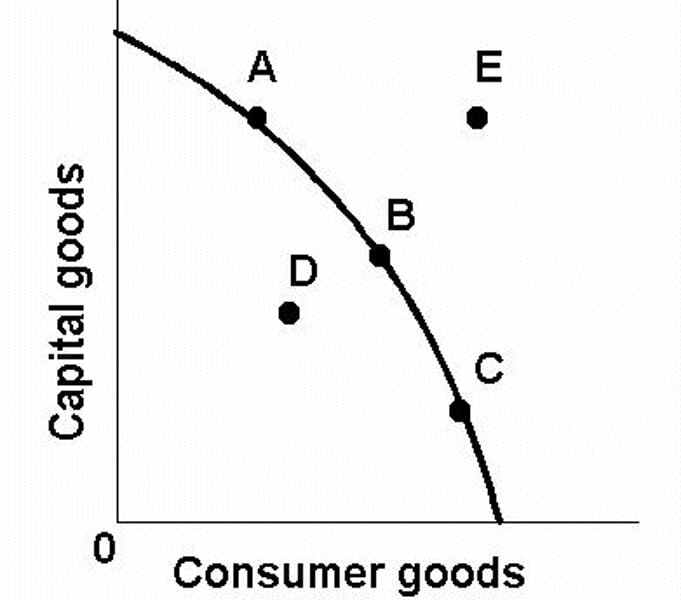
PPF curve
This diagram can be used to show economic growth ( a shift outwards in the PPF), opportunity cost, unemployed resources, productive efficiency (any point on the PPF curve), but not allocative efficiency.
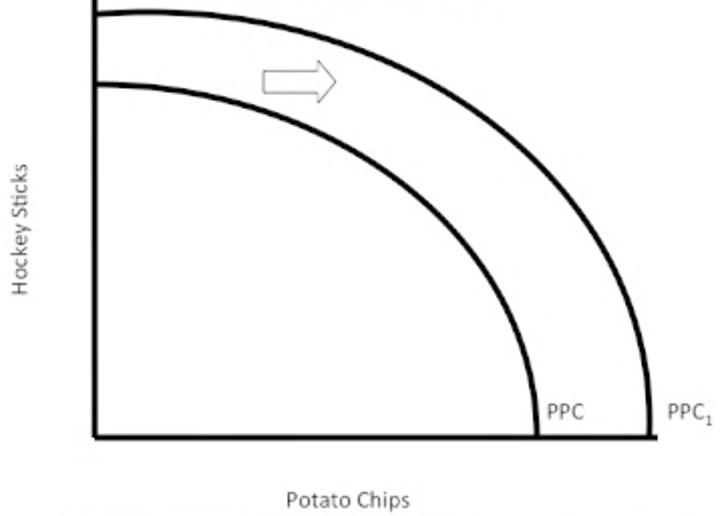
PPF curve - economic growth
a PPF curve showing economic
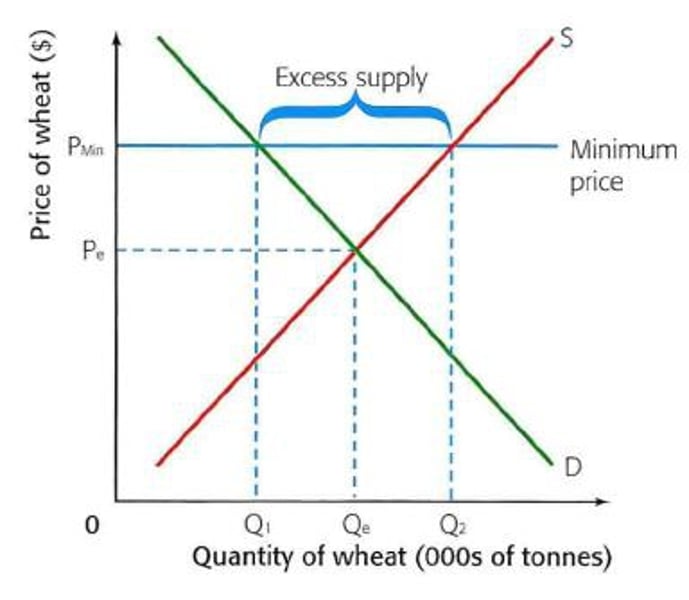
Minimum Price diagram
A potenail solution to demerit goods e.g. Minmum price for alcohol in Scotland. Increasing the price
from Pe to Pmin reduces consumption from Qe to Q1.
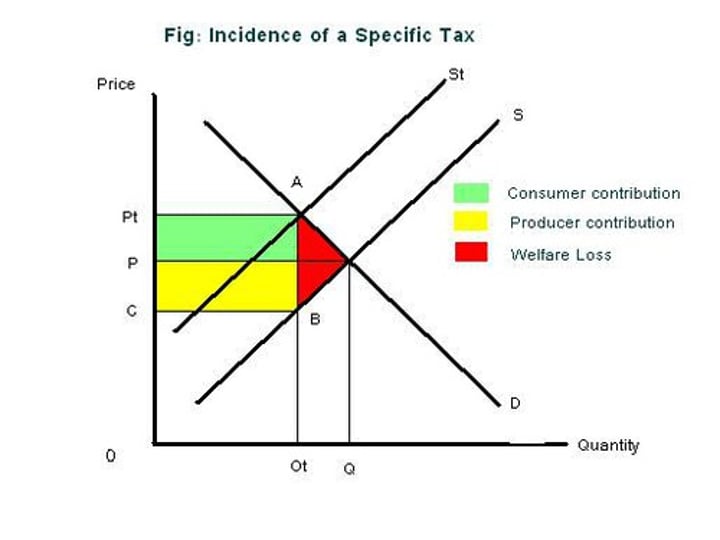
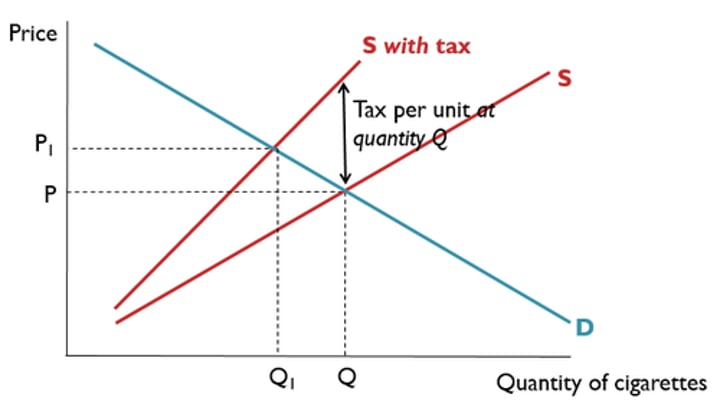
Specific Tax
A solution to demerit goods e.g. cigarettes. It internalises the externalities. The diagram can be used to show the impact of a tax on consumption (Q1 to Q2) and the tax revenue and the incidence of the tax on consumers and producers. The size of the tax per unit is always the vertical distance between the supply curves.
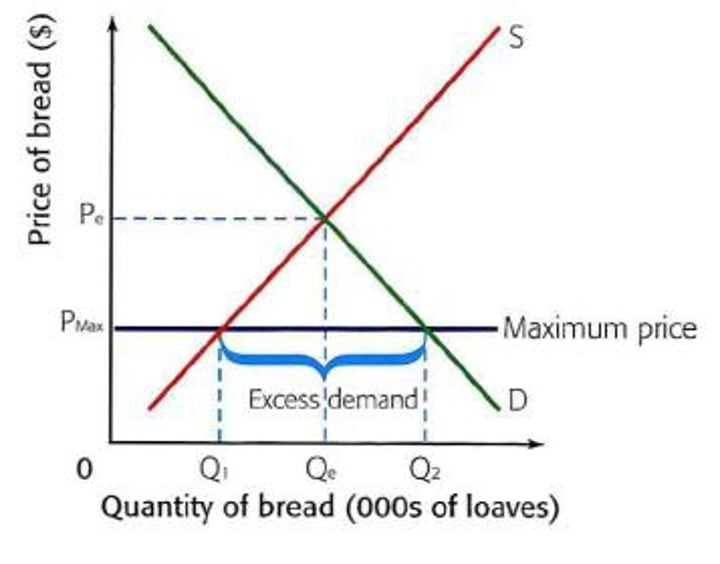
Maximum price
Used to make merit goods more affordable e.g. maximum rents. Not such an effective policy because it can reduce supply (Qo to Q1), creating excess demand (Qo to Q2)
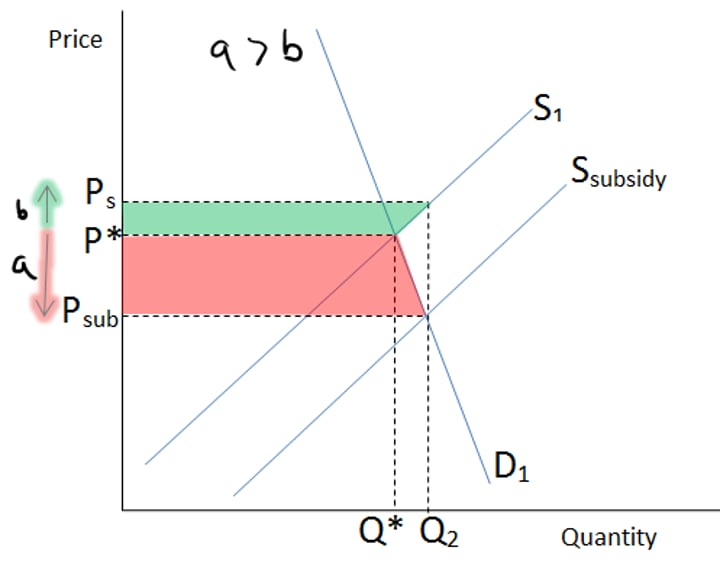
Subsidy
Solution to under consumption and production of merit goods. Internalises the positive externalities.
Shows the cost to government of subsidy (shaded area) The size of the subsidy per unit is always the
vertical distance between the supply curves.
Ad Valorem Tax
e.g. VAT. because it is a percentage tax the size of the increases as the price increases. Hence the supply curves diverge.
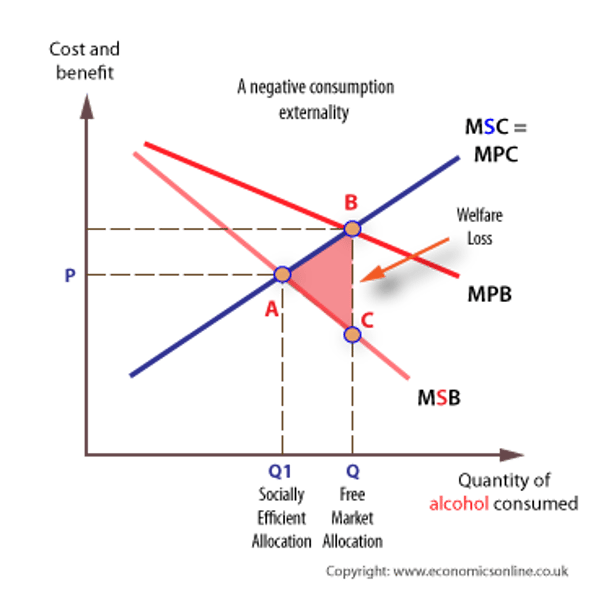
Marginal Model - Demerit good - negative externalities in consumtpion
negative externalities in consumtpion e.g. smoking and passive smoking. This diagram shows why demerit goods may be overconsumed in a free market because externalities are ignored in decision making. Consumption occurs are Q and not the socially desirable level of Q1. This is the most common marginal diagram as it can be used for alcohol, cigarettes,
gambling, fast food etc.
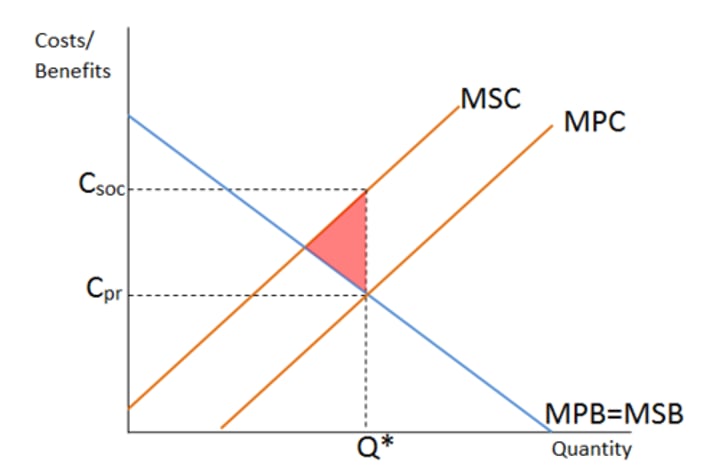
Marginal Model - Demerit good - negative externalities in production
negative externalities in production e.g. electricity production from coal and pollution. This grandam shows why demerit goods may be over consumed in a free market because externalities are ignored in decision making by firms. Production occurs are Q and not the socially desirable level of Q1
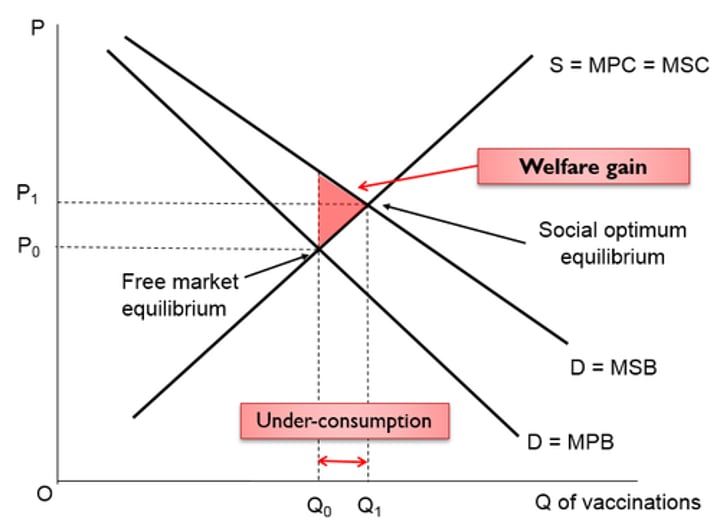
Marginal Model - Merit good - positive externalities in consumption
positive externalities in consumption e.g. vaccination or public transport. This diagram shows why merit goods may be under consumed in a free market because externalities are often ignored in decision making. Consumption occurs are Q and not the socially desirable level of Q1
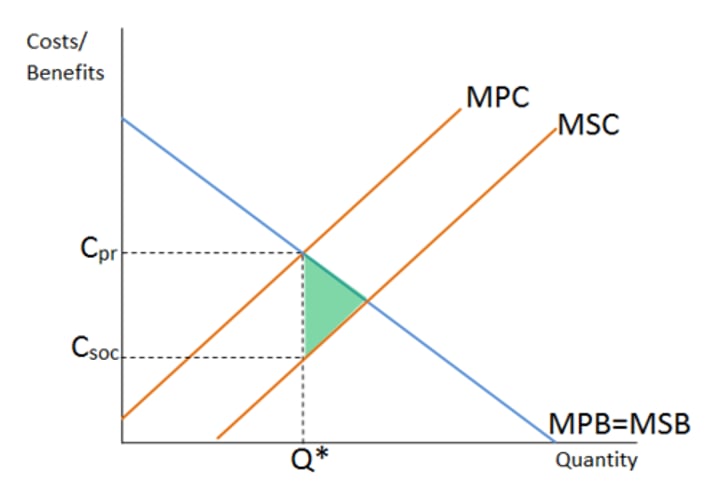
Marginal Model - Merit good - positive externalities in production
positive externalities in production e.g. infrastructure projects, such as a new airport, or motorways. This diagram shows why Merit goods may be under consumed in a free market because externalities are often ignored in decision making, production occurs are Q and not the socially desirable level of Q1
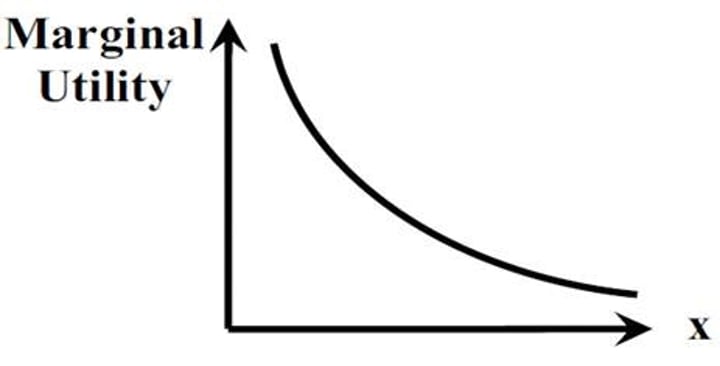
Diminishing marginal utility
The traditional view of individual economic decision making indicates that consumers will weigh up costs and benefits when making decisions. The falling marginal utility (think pizza slices) indicates that the extra satisfaction from one more unit falls as we consume more. The top diagram shows that maximum utility occurs when marginal utility is zero.