Populations and Genomes Exam 2
1/118
There's no tags or description
Looks like no tags are added yet.
Name | Mastery | Learn | Test | Matching | Spaced | Call with Kai |
|---|
No analytics yet
Send a link to your students to track their progress
119 Terms
What is the role of the binomial distribution in population genetics?
It models the probability of getting a particular number of “A” alleles in the next generation, based on random sampling from the current generation
What does the variance of the binomial distribution represent in the context of genetic drift?
It represents how much allele frequencies are expected to vary between generations due to random chance
What does the standard deviation of allele frequency change tell us?
It shows how much the allele frequency is expected to vary in the next generation
What is the key determinant of the strength of genetic drift?
Population size (N) — drift is stronger in small populations and weaker in large ones
How can we estimate the size of real populations?
By counting individuals directly or using a mark–recapture method to estimate the census size (Nc)
Why isn’t the census size (Nc) always the same as the genetic population size (N)?
Because not all individuals reproduce equally or at all, and population sizes often fluctuate over time
What is the effective population size (Ne)?
The number of individuals in an idealized population that would show the same amount of genetic drift as the real population being studied
Why is Ne usually much smaller than Nc in nature?
Because of unequal reproductive success, uneven sex ratios, population bottlenecks, and fluctuating population sizes through time
How can we estimate Ne?
By using the relationship between variance in allele frequency and population size:
V=pq/2Ne
measured through temporal sampling across generations
What is temporal sampling?
A method that tracks allele frequency changes over time to estimate the variance and infer Ne
Knowing Ne allows scientists to estimate what key parameters?
The strength of genetic drift, mutation rates, and the timing of population/species divergence events
How does Ne vary among organisms?
It varies widely — often not in proportion to their census size — due to differences in reproductive patterns and life history traits
If drift removes variation, why does genetic variation still exist in populations?
Because new mutations constantly arise and introduce variation back into the population
What is μ (mu) in population genetics?
The mutation rate — the probability that a gamete or offspring has a new allele different from the parent’s at a particular locus
In a single-locus model with two alleles (A and a), what does μ represent?
The chance per generation that A mutates to a, or a mutates back to A
What happens to mutations with large fitness effects?
They can easily overcome genetic drift and spread rapidly through the population
When drift is weaker (in larger Ne), what happens to smaller-effect mutations?
Even mutations with small selective advantages can overcome drift and become fixed
How does recessiveness influence selective effects?
Recessive alleles may have low average effects when rare, slowing selection and allowing drift to dominate
Why are many genetic diseases more common in small populations?
Because drift can randomly increase the frequency of harmful alleles when Ne is small — seen in founder or isolated populations (e.g., Amish, Blue People of Kentucky)
What does genetic drift eventually cause for alleles in the long term?
It leads to fixation of one allele (frequency = 1) and loss of the other (frequency = 0)
What does μ represent in mutation rate equations?
It is the per-generation mutation rate per locus or per gamete
What does 2Nμ represent?
The number of new mutations that occur each generation across the population
What determines the probability that a new neutral mutation will fix?
Its initial frequency, which for a new mutation is 1 / (2N)
What does it mean when we say populations accumulate fixed differences at a constant rate?
Neutral mutations fix at a rate equal to μ, creating a molecular clock that ticks at a constant rate, independent of population size
What does it mean that genetic diversity is hierarchically structured?
It means that genetic variation exists at multiple biological levels — within individuals, among individuals within a population, and among populations within a species. This creates a nested pattern of diversity
What is population structure?
Describes how genetic variation is distributed among populations. It arises due to limited gene flow, geographic isolation, drift, and selection, which cause populations to differ in allele frequencies
What are summary statistics in population genetics?
Summary statistics are numerical values that capture and describe aspects of genetic variation in a dataset, such as heterozygosity, nucleotide diversity, or fixation indices
What is observed heterozygosity (Ho)?
The proportion of individuals in a population that are heterozygous at a given genetic locus, calculated by dividing the number of heterozygotes by the total number of genotypes
What is expected heterozygosity (He)?
The proportion of heterozygotes predicted under Hardy-Weinberg equilibrium, based on allele frequencies in the population. It is given by the equation He = 2pq
What can comparing observed and expected heterozygosity tell us?
This comparison reveals whether a population deviates from Hardy-Weinberg equilibrium, often indicating processes like inbreeding, selection, or nonrandom mating
What is the inbreeding coefficient (f)?
Shows how much heterozygosity is reduced due to inbreeding. It is calculated as f = 1 - (Ho / He), where values closer to one indicate strong inbreeding
What does a positive f value indicate?
A positive value of f means there are fewer heterozygotes than expected, suggesting inbreeding or population substructure
What does a negative f value indicate?
A negative f value means there are more heterozygotes than expected, which can result from outcrossing or balancing selection that maintains multiple alleles
What is Watterson’s theta (θW)?
Measures genetic diversity based on the number of segregating or polymorphic sites in a DNA sequence sample. It reflects how many positions in the genome vary among individuals
How is Watterson’s theta calculated?
It is calculated using the formula θW = S / a(n−1), where S is the number of segregating sites and a(n−1) is the sum of reciprocals from one to n−1, with n being the number of sequences sampled
What is Nei’s theta (π), also known as nucleotide diversity?
Average expected heterozygosity per nucleotide site. It measures how genetically different two randomly chosen DNA sequences are from each other
How are Nei’s theta and Watterson’s theta related?
Under equilibrium between mutation and genetic drift, the two measures are expected to be approximately equal, both representing the population-scaled mutation rate (θ = 4Neμ)
What does the equation θ = 4Neμ represent?
This equation shows that genetic diversity is determined by both effective population size (Ne) and mutation rate (μ). Larger populations or higher mutation rates result in greater genetic variation
How can effective population size be estimated from genetic data?
If the mutation rate is known, effective population size can be estimated by rearranging the relationship θ = 4Neμ to Ne = θ / (4μ)
What happens when there is missing data in genetic sequences?
Missing data reduce the number of sites that can be analyzed, which may bias estimates of diversity. Specialized software, such as Pixy, is used to correct for missing data and ensure accurate calculations
What does FST measure in population genetics?
FST quantifies how much of the total genetic variation is due to differences between populations, serving as a measure of population differentiation
What is the formula for calculating FST?
FST is calculated as (HT − HS) / HT, where HT represents the total heterozygosity across all populations, and HS is the average heterozygosity within populations
How are FST values interpreted?
An FST value of 0 means populations are genetically identical, while a value of 1 indicates complete differentiation. Most natural populations fall somewhere between these extremes
How do evolutionary processes influence FST?
Genetic drift and natural selection tend to increase FST by making populations more distinct, while gene flow reduces FST by mixing alleles between populations
Why does FST often increase with geographic distance?
As populations become farther apart, gene flow decreases, and genetic drift causes divergence, leading to an increase in FST. This relationship is known as isolation by distance
How can FST be used to identify local adaptation?
By scanning FST values across the genome, researchers can pinpoint loci with unusually high differentiation, suggesting that those genes may be under local selection pressures
What is Principal Components Analysis (PCA) in genetics?
PCA is a statistical method that reduces large genetic datasets into a few dimensions, allowing researchers to visualize patterns of genetic similarity and structure among individuals or populations
What does a PCA plot reveal about population relationships?
In a PCA plot, individuals or populations that are genetically similar cluster closely together, while more distinct groups are separated along principal component axes, reflecting shared ancestry or isolation
What is a STRUCTURE or ancestry plot, and what does it show?
A STRUCTURE plot represents each individual as a bar divided into colors corresponding to genetic clusters, showing the proportion of ancestry from each population. It visualizes admixture and population structure, similar to results from services like 23andMe
What is natural selection?
Natural selection is the differential survival or reproduction of genotypes with differing phenotypes, leading to non-random changes in allele frequencies over time
What causes natural selection?
Differences in fitness among individuals — some genotypes contribute more offspring to the next generation than others
Who studied Galápagos finches?
Rosemary and Peter Grant conducted long-term studies of finches on the Galápagos Islands to observe natural selection in real time
What did the Grants conclude about finches?
They found that beak size evolved in response to environmental changes (like droughts), showing that natural selection can act quickly and measurably within populations
What does “selection for” a trait mean?
“Selection for” means that individuals with a certain trait have higher fitness, causing both the trait and its alleles to increase in frequency
What does “selection against” a trait mean?
“Selection against” means that individuals with a certain trait have lower fitness, causing both the trait and its alleles to decrease in frequency
What is adaptation?
Adaptation is the process by which traits evolve to match an organism’s environment — it is only caused by natural selection
What is fitness in evolutionary biology?
Fitness is a quantitative measure of how much an individual or genotype contributes to the next generation on average
What are the two types of fitness?
Absolute fitness: Number of surviving, fertile offspring of an individual or genotype
Relative fitness: Fitness of a genotype compared to the fittest genotype in the population
Why is relative fitness important?
Because evolution depends on differences in reproductive success, not absolute numbers — relative fitness determines which alleles increase in frequency
What does “W” represent in fitness equations?
“W” stands for relative fitness of a genotype
What is the selection coefficient (s)?
“s” measures the strength of selection — how much less fit one genotype is compared to the most fit genotype
Example: if s = 0.2, the genotype has 20% lower fitness
What is the dominance coefficient (h)?
“h” describes how the heterozygote’s fitness compares to the homozygotes — it determines whether the advantageous allele is dominant, additive, or recessive
What does it mean when a mutation has a higher selection coefficient (s)?
Mutations with higher s values spread (or “sweep”) to high frequency more rapidly because selection acts on them more strongly
What is directional selection?
Selection that consistently increases or decreases the frequency of one allele over time, pushing the population toward one extreme
How do dominance patterns affect selection speed?
Dominant beneficial alleles spread faster because they affect fitness even in heterozygotes, while recessive alleles spread more slowly
How does population size affect selection?
Selection is more effective in large populations. In small populations, random genetic drift can overwhelm selection, especially when |Ne * s| < 1
What happens under genetic drift when no selection is acting?
Allele frequencies change randomly over time (WAA = WAa = Waa = 1), leading to unpredictable genetic variation
Is natural selection random or non-random?
Natural selection is non-random — certain traits consistently increase survival or reproduction — but it can be influenced by random processes like drift
What effect does natural selection have on genetic variation?
Selection generally reduces genetic variation because advantageous alleles increase in frequency while less fit alleles are eliminated
Why is there no “perfect” organism?
Because environments change, genetic drift and mutation introduce randomness, and trade-offs between traits prevent any organism from being optimal for all conditions
What is the “Drift Barrier Hypothesis”?
It suggests that the ability of natural selection to improve traits is limited by random genetic drift — weak selection cannot overcome drift in small populations
How strong is natural selection in nature?
Usually quite weak (s ≪ 0.1), but it can be extremely strong under intense conditions, such as with antibiotic resistance in bacteria.
How does selection act on phenotypes vs. genotypes?
Selection acts directly on phenotypes, but this indirectly changes allele frequencies because phenotypes are determined by genotypes
What determines whether selection will occur?
Selection will act when the product of effective population size and selection strength (|Ne * s|) is greater than 1; otherwise, drift dominates
What is the formal mathematical representation of selection?
What does “A model of natural selection” assume?
It assumes a single diploid locus at Hardy-Weinberg equilibrium, no mutation, drift, or gene flow — allowing focus purely on selection effects
What is absolute fitness (W) vs. relative fitness (w)?
Absolute fitness (W): Actual reproductive success or survival probability
Relative fitness (w): Fitness of a genotype compared to the fittest genotype in the population
How will allele frequencies change due to selection?
Genotypes with higher relative fitness contribute more alleles to the next generation, increasing their allele’s frequency over time
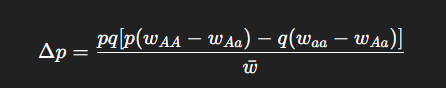
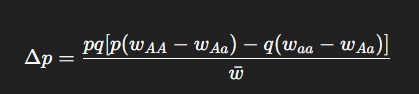
What is the general expression for the change in allele frequency due to selection?
When will Δp = 0?
When p = 0 or q = 0 (no variation left)
When wAA = wAa = waa (no fitness differences)
Allele frequencies remain constant in these cases
When will p increase (Δp > 0)?
When the A allele is associated with higher fitness:
wAA > wAa > waa
wAA > wAa = waa
wAA = wAa > waa
When will p decrease (Δp < 0)?
When the A allele is associated with lower fitness:
wAA < wAa < waa
wAA = wAa < waa
wAA < wAa = waa
What is the final case where Δp = 0 (equilibrium)?
When the heterozygote has the highest or lowest fitness:
Heterozygote advantage (wAA < wAa > waa) → balanced polymorphism
Heterozygote disadvantage (wAA > wAa < waa) → disruptive selection
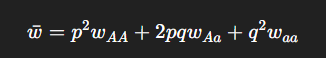
What is mean fitness ( w)?
The average fitness of the population:
How does mean fitness ( w ) affect adaptive evolution?
As mean fitness increases (the population becomes more adapted), the rate of evolution (Δp) decreases because there’s less variation left for selection to act on
What is adaptation?
The increase in mean fitness of a population over time due to natural selection acting on heritable traits
How is fitness ultimately determined?
By the phenotype of an organism — since selection acts on physical traits that affect survival and reproduction
Why are most phenotypes determined by many additive loci?
Because most traits (e.g., height, body size) are polygenic — controlled by multiple genes each contributing small additive effects
What is a fitness landscape?
A conceptual map relating genotypes or phenotypes to fitness, where populations “climb” towards peaks representing optimal adaptation
What does it mean to “climb hills” on a fitness landscape?
It represents adaptation — populations evolve toward higher fitness genotypes, increasing mean fitness until reaching an optimal peak
What is stabilizing selection?
Once a population reaches a fitness peak, low-fitness variants are continually removed, maintaining the optimal phenotype
What are “rugged” fitness landscapes?
Landscapes with multiple peaks (local and global optima). Populations can get “stuck” on local peaks because selection can’t cross fitness valleys
Why are fitness landscapes multidimensional?
Because selection acts on many traits simultaneously — creating complex, multidimensional surfaces of adaptive possibilities
What is optimization in the context of fitness landscapes?
The process of finding the combination of variables (traits or genotypes) that maximizes performance or fitness — often modeled using genetic algorithms inspired by evolution
What is a “test” for selection?
A test for selection computes a statistic or score for a genetic locus and compares it to what’s expected under neutrality (drift alone) to identify potential selection
What does linkage cause?
Linkage causes close-by alleles on a chromosome to be co-inherited in “chunks,” meaning they tend to be passed on together
What is linkage disequilibrium?
It’s the non-random association of alleles at different loci due to physical proximity on a chromosome
Alleles at loci that are close together tend to have what kind of inheritance?
They tend to have correlated inheritance, which breaks down slowly over time due to recombination
How do evolutionary forces affect linked alleles?
Selection can change the frequency of alleles close together. When an allele is favored or removed by selecton, nearby linked alleles hitchhike with it due to reduced recombination, making them increase or decrease in frequency as well
What is a selective sweep?
A selective sweep occurs when a new, beneficial mutation increases rapidly in frequency, carrying along nearby linked alleles and reducing genetic diversity in that region