APES-Unit 3: Populations
1/182
Earn XP
Description and Tags
-Review -AP Classroom MCQ Review -Knowt Flashcards
Name | Mastery | Learn | Test | Matching | Spaced | Call with Kai |
|---|
No analytics yet
Send a link to your students to track their progress
183 Terms
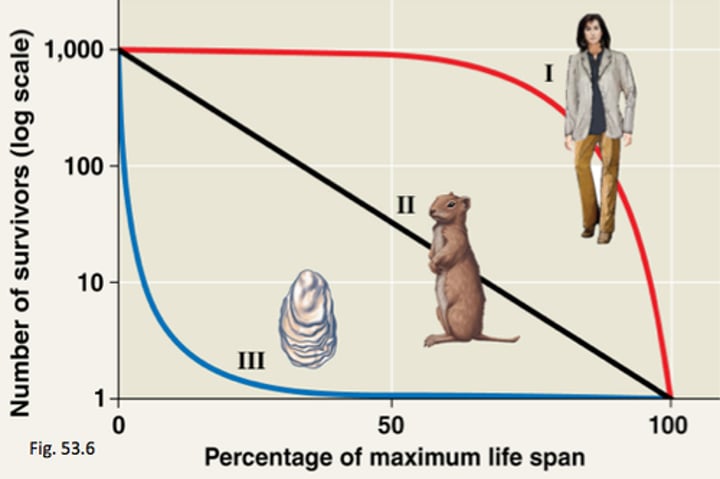
Survivorship curves
It show age-distribution characteristics of species, reproductive strategies, and life history
Reproductive success
It is measured by how many organisms are able to mature and reproduce, with each survivorship curve representing a balance between natural resource limitations and interspecific and intraspecific competition
Carrying capacity (K)
It refers to the number of individuals that can be supported sustainably in a given area
Population dispersal pattern
It is how individuals or species of animal become distributed in different spaces over certain periods of time
Clumped
Some areas within a habitat are dense with organisms, while other areas contain few members
Random
Occurs in habitats where environmental conditions and resources are consistent
Uniform
Space is maximized between individuals to minimize competition
Biotic potential
The maximum reproductive capacity of an organism under optimum environmental conditions
Environmental Resistance
Any factor that inhibits an increase in the number of organisms in the population
J-Curve
It represents a population growth occurs in a new environment when the population density of an organism increases rapidly in an exponential or logarithmic form, but then stops abruptly as environmental resistance or another factor suddenly impacts the population growth
S-Curve
It occurs when, in a new environment, the population density of an organism initially increases slowly but then stabilizes due to the finite amount of resources available
Limiting Factor
It can be any resource or environmental condition that limits the abundance, distribution, and/or growth of a population
Density-dependent limiting factors
These are factors whose effects on the size or growth of the population vary with the density of the population
Density-independent factors
These are factors that limit the size of a population, and their effects are not dependent on the number of individuals in the population
Rule of 70
It helps to explain the time periods involved in exponential population growth occurring at a constant rate
Doubling time
It is the amount of time it takes for a population to double in size
Age-structure diagrams
These are determined by birth rate, generation time, death rate, and sex ratios
Pyramid-shaped age-structure diagram
It indicates that the population has high birth rates and the majority of the population is in the reproductive age group
Bell shape age-structure diagram
It indicates that pre-reproductive and reproductive age groups are more nearly equal, with the post-reproductive group being smallest due to mortality
Urn-Shaped age-structure diagram
It indicates that the post-reproductive group is largest and the pre-reproductive group is smallest, a result of the birth rates falling below the death rate, and is characteristic of declining populations
Total fertility rate (TFR)
The average number of children that each woman will have during her lifetime
Earth Wisdom
Natural cycles that can serve as a model for human behavior
Frontier Worldview
Viewed undeveloped land as a hostile wilderness to be cleared and planted, then exploited for its resources as quickly as possible
Planetary Management
Beliefs that as the planets most important species, we are in charge of Earth
Earth Wisdom
Beliefs that nature exists for all Earths species and we are not in charge of Earth; resources are limited and should not be wasted
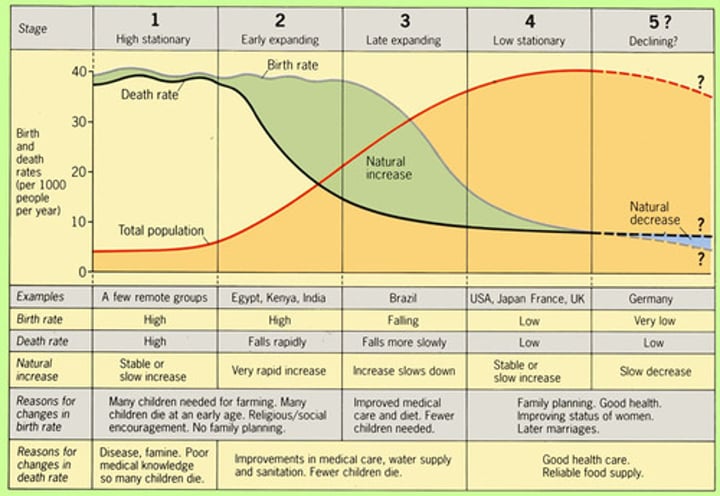
Demographic transition
It is the transition from high birth and death rates to lower birth and death rates as a country or region develops from a pre-industrial to an industrialized economic system
Stage 1
Pre-Industrial (High Stationary)
Stage 2
Transitional (Early Expanding)
Stage 3
Industrial (Late Expanding)
Stage 4
Post-Industrial (Low Stationary)
Stage 5
Sub-Replacement Fertility (Declining)
Stage 5: Sub-Replacement Fertility (Declining)
Some theorists believe a fifth stage is needed to represent countries with sub-replacement fertility.
Death rates exceed birth rates in most European and East Asian nations.
Unless mass immigration continues, population aging and decline will occur in this stage.
Stage 4: Post-Industrial (Low Stationary)
Population growth is zero when birth and death rates are equal.
The standard of living is higher, and birth and death rates are low.
In some countries, birth rates are lower than mortality rates, resulting in population losses.
Stage 3: Industrial (Late Expanding)
Urbanization reduces economic incentives for large families.
Urban families are increasingly discouraged from having large families as costs rise.
Female education and employment lower birth rates.
Leisure time and food are not priorities.
Stage 2: Transitional (Early Expanding)
This stage occurs after the start of industrialization.
Hygiene, medical advances, sanitation, cleaner water, vaccinations, and higher education lower the death rate, resulting in a significant population increase.
Population rises rapidly.
Stage 1: Pre-Industrial (High Stationary)
Poor agricultural practices, pestilence, and living conditions make food scarce and medical care is poor.
High birth rates replace high mortality, resulting in low population growth.
Sub-Saharan Africa has 54% of the world's AIDS-HIV cases but only 6% of the population.
Present to 2050 C.E.
Estimates are as high as 9.8 billion.
Earth Wisdom
1650 C.E. to present
Currently ~ 7.5 billion humans.
In 1650 C.E., the growth rate was ~ 0.1%.
Today it is ~ 1.2%.
Planetary Management
1300 C.E. to 1650 C.E.
~ 600 million humans.
Plagues reduced population growth rate.
Up to 25% mortality rates are attributed to the plagues that reached their peak in the mid-1600s.
0 C.E. to 1300 C.E.
~ 500 million humans.
Population rate increased during the Middle Ages because new habitats were discovered.
Factors that reduced population growth rate during this time were famines, wars, and disease
Frontier Worldview
5000 B.C.E. to 1 B.C.E.
~ 200 million humans.
Rate of population growth during this period was about 0.03 to 0.05%, compared with today’s growth rate of 1.3%.
Frontier Worldview
8000 B.C.E. to 5000 B.C.E.
~ 50 million humans.
Increases due to advances in agriculture, domestication of animals, and the end of a nomadic lifestyle.
Earth Wisdom
Before Agricultural Revolution
~ 1 million to 3 million humans.
Hunter-gatherer lifestyle.
Earth Wisdom
Birth Rate (%) = [(total births/total population)] × 100
Birth Rate Formula
CBR = [(b ÷ p) × 1,000]
Crude Birth Rate Formula
Death Rate (%) = [(total deaths/total population)]× 100
Death Rate Formula
CDR = [(d ÷ p) × 1,000]
Crude Death Rate Formula
Doubling Time = 70/% growth rate
Doubling Time Formula
Emigration = number leaving a population
Emigration Formula
Global Population Growth Rate (%) = [(CBR – CDR)]/10
Global Population Growth Rate Formula
Immigration = number entering a population
Immigration Formula
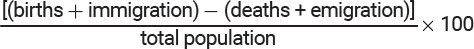
National Population Growth Rate (%) = [(CBR + immigration) – (CDR + emigration)]/10
National Population Growth Rate Formula
Percent Rate of Change = [(new # - old #)/old #] × 100
Percent Rate of Change Formula
Population Density = total population size/total area
Population Density Formula
Population Growth Rate Formula
dt= 70/r
To find how long it takes for a population to double in size we can use the following formula _________
Liebig’s law of the minimum
Based on _________, even if all other factors are favorable, the one that is least favorable will dictate the growth, abundance, or distribution of the population of a species.
Positive feedback loops
_________ stimulate change and are responsible for sudden or rapid changes within ecosystems.
Negative feedback loops
This often provide stability.
Limiting factors can cause a negative feedback loop because populations cannot exceed the ecosystem's carrying capacity.
carrying capacity
This point of stabilization is known as the _____ of the environment, and it denotes the point at which the upward growth curve begins to level out
density-dependent
This type of population growth is termed “_________” since the growth rate depends on the number of organisms in the population.
density-dependent
This type of population growth rate is known as “_______,” a regulation of the growth rate is not tied to the population density until the resources are exhausted and the population growth crashes.
Type I - Late Loss
Reproduction occurs fairly early in life, with most deaths occurring at the limit of biological life span.
Type I - Late Loss
Low mortality at birth with a high probability of surviving to advanced age.
Type I - Late Loss
Death rates decrease in younger years due to advances in prenatal care, nutrition, disease prevention, and cures, including immunization.
Type II - Constant Loss
Individuals in all age categories have fairly uniform death rates, with predation being the primary cause of death.
Type II - Constant Loss
Typical of organisms that reach adult stages quickly.
Type III - Early Loss
Typical of species that have great numbers of offspring and reproduce for most of their lifetime.
Type III - Early Loss
Death is prevalent for younger members of the species due to environmental loss and predation and declines with age.
r-Strategists
Not endangered
Have many offspring and tend to overproduce
Low parental care
Mature rapidly
r-Strategists
Population size limited by density-independent limiting factors, including climate, weather, natural disasters, and requirements for growth
Short-lived
Tend to be prey
Tend to be small
r-Strategists
Type III survivor curve
Wide fluctuations in population density
K-Strategists
Most endangered
Have few offspring
High parental care
Mature slowly
K-Strategists
Density-dependent limiting factors to population growth stem from intraspecific competition and include competition, predation, parasitism, and migration
Long-lived
Tend to be predator and prey
Tend to be larger
K-Strategists
Type I or II survivor curve
Population size stabilizes near the carrying capacity.
Generalists
Able to use a variety of environmental resources
Adaptable to a wide range of environments
Have a high level (range) of tolerance
Generalists
Have an advantage when environmental conditions change
Less likely to be extinct
Specialists
Use specific set of resources
Less adaptable due to specialized needs
Have a low level of tolerance
Specialists
Easily affected when environmental conditions change
More likely to become extinct
the five indirect drivers of change
Demographic, Economic, Sociopolitical, Science and Tech, Cultural and Religious
seven direct drivers of change
Changes in local land use and cover
Species introduction and removal
Technology adaptation and use
External inputs
Harvest and resource consumption
Climate change
Natural physical and biological drivers
Birth Rate
individuals born per 1,000 individuals/year
Death Rate
individuals who die per 1,000 individuals/year
Growth rate
(birthrate + immigration) - (death rate + emigration) expressed as a percentage of the total pop.
Sex ratio
relative number of males and females in a population
Sex ratio importance
# of females determines birth rate
Age distribution
number of individuals of each age in the population
Demographic transition
four categories of limiting factors
Raw material availability
Energy availability
Accumulation of waste products
Interactions among organisms
difference between intrinsic and extrinsic limiting factors
Intrinsic = inside population
Extrinsic = outside population
Intrinsic Limiting Factor Example
Low Birth rates
Emigration triggered by population density
Extrinsic Limiting Factor Example
Predation
Loss of food source
difference between density-dependent and density-independent limiting factors
density-dependent = triggered by population size
density-independent = happen to all sizes
Density-Dependent Example
Disease
food shortages
Density-Independent Example
natural disasters
human activities
Puget sound limiting factors for salmon
1. Decreasing O2 supply
2. Low food supply
3. Disease
4. Predators
5. Limited space
factors that make the carrying capacity for any species a constantly changing number
1. Successional changes
2. Climate variations
3. Disease epidemics
4. Natural disasters
5. Nutrient levels in aquatic ecosystems.
Stable Environment reproductive strategy
Few "expensive" offspring (K-strategists)
Unstable environment reproductive strategy
Many "inexpensive" offspring (r-strategists)
Survivorship curve