populations + succession
1/28
There's no tags or description
Looks like no tags are added yet.
Name | Mastery | Learn | Test | Matching | Spaced | Call with Kai |
|---|
No analytics yet
Send a link to your students to track their progress
29 Terms
define population
all the organisms of one species in one area at one time
define community
all the organisms of ALL species in one area at one time
define habitat
the place an organism lives
define niche
the role of an organism in its ecosystem
define ecosystem
the interaction between all the abiotic and biotic factors
what are the 2 ways in which a population can be estimated?
randomly placed quadrats/ quadrats placed along a belt transect (for slow moving/ non-motile organisms)
mark-release-capture method for motile organisms
when is random sampling used?
when you want to work out the average population of an area or compare the average of two areas
when is systematic sampling usually used?
When you want to investigate the change in a communities/population over a distance/area
Describe how you would randomly sample an area to estimate the population of stinging nettles in a field
Create a grid on the field (or on a map of the field)
Use a calculator to generate random numbers that are used as coordinates
Place the quadrate at the intersection of the coordinates
Estimate the abundance of nettles in the quadrat (e.g. using % cover)
Repeat many times so that the mean abundance calculated per quadrat is reliable
Multiple the number of plants per quadrat BY the number of times the quadrat fits into the total are of the field in order to work out the population in the whole field
Describe how you would systematically sample an area to investigate the effect of distance from a river on the population of a specific plant
Place a transect at 90 degrees to the river
Place a quadrat at regular intervals along the transect
Estimate the abundance of the plant in the quadrat (e.g. using % cover)
Repeat the process with many transects which are parallel to each other
Plot a graph of distance on the x-axis against population of plant on the y-axis
Use spearman rank correlation to see if there is a significant correlation between them
How can a quadrat be used to measure percentage cover?
Count the number of small squares that are half or more filled with the plant
Work out what % each square is of the whole quadrat
Then multiply the number of squares half or more filled by the % each square is worth
What are the limitations of using percentage cover as a measure of abundance?
It is quite subjective
What are the advantages of using percentage cover as a measure of abundance?
It is quick and easy to do.
You don’t have to be able to identify individual plants
How can a quadrat be used to measure frequency of a plant?
Count the number of plants present in the quadrat
What are the limitations of using frequency as a measure of abundance?
• It is time consuming
• It cannot be used if you cannot identify individual plants
What are the advantages of using frequency as a measure of abundance?
It is an accurate way of measuring abundance
Write the equation for mark-release-recapture
(Number of organisms caught in 1st sample x no of organisms caught in 2nd sample)
DIVIDED BY Number of organisms marked in 2nd sample
Describe how you would use mark-release-recapture to estimate the population of bees in a county in the UK.
Capture a sample of bees
Count them
Mark them in a way which does not affect their ability to survive (e.g. using a fluorescent powder which wouldn’t affect the rate of predation OR recapture)
Release the bees, allow them to disperse and mix back into the population
Capture a second sample
Count the total second sample
Count the number of marked bees in the second sample
Use the equation to estimate population size
Take large samples to improve reliability
What are the assumptions of the mark-release-recapture methodology?
No births and no deaths occur between the first and second sample
No emigration or immigration occur between the first and second sample
The first sample have time to mix fully into the population before taking a second sample
The mark doesn’t wear off and doesn’t affect the organisms ability to survive
How would a scientist decide how many repeats to carry out if they are doing random sampling to find out the population of a plant in a field?
• Calculate a running mean as they collected each sample
• Enough samples have been collected when the running mean becomes constant
How would a scientist decide how many repeats to carry out if they are using quadrats to randomly sample an area to find out the number of species present
Plot a graph with number of repeats (quadrats) on the x-axis and total number of species found on the y-axis
When the line levels off this means that new samples are not finding any new species, so stop collecting samples
How would a scientist decide how long to sample an area if they are random sampling to find out the number of species present in a number of areas
Sample for a known period of time and record how many species are found
Repeat for different periods of time
Select the optimum time beyond which further sampling doesn’t lead to any new species being found
What are abiotic and biotic factors? Give examples of each
• Abiotic factors are non living factors e.g. temperature, pH, oxygen concentration, wind level, humidity, light intensity etc etc
• Biotic factors are living factors e.g. food availability, competition, predation
what is intraspecific competition? what might organisms compete for?
Competition between organisms of the same species
Food, water, mates
what is interspecific competition? what might organisms compete for?
Competition between organisms of different species
E.g. Food, water, nesting sites
What is meant by the competitive exclusion principle?
• The fact that no two species can occupy exactly the same niche.
• If two species use the same niche then one species will always outcompete the other
one
Sketch a population growth curve (x-axis = time and y-axis = population size) showing the lag
phase, exponential growth phase, stationary phase and death phase.
Annotate the graph explaining what happens at each of the 4 key stages.

What is the carrying capacity in a population?
The carrying capacity is the maximum population size that an ecosystem can support
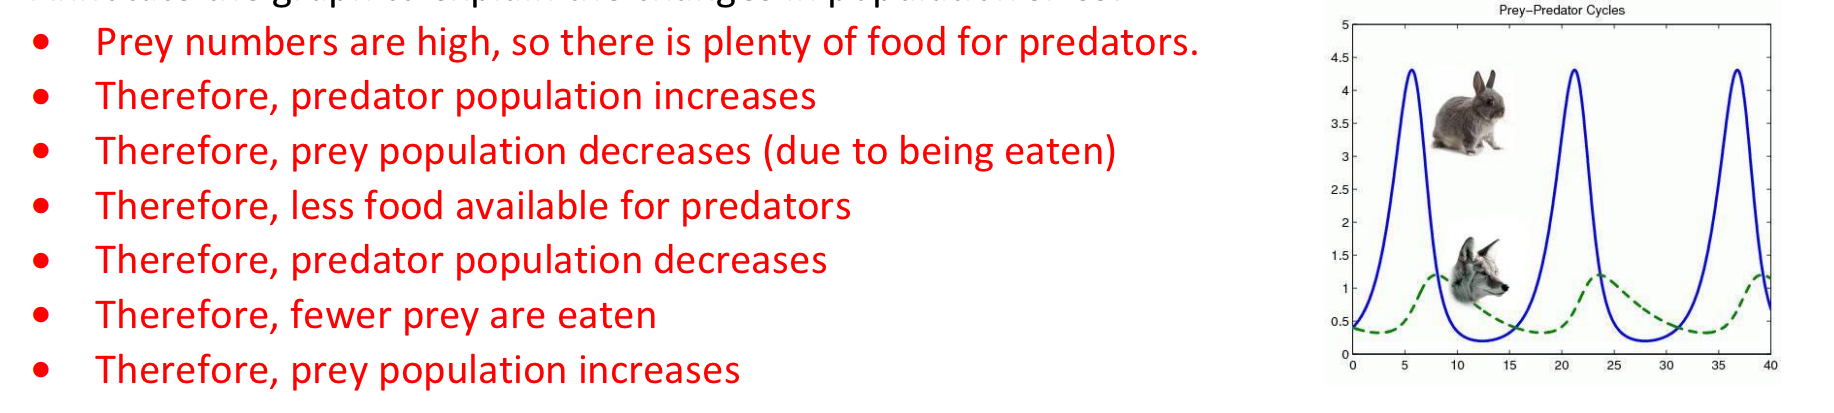
Sketch a graph to show how the sizes of a predator and prey population vary over time.
Your graph should show 3 complete cycles
Annotate the graph to explain the changes in population sizes: