research analysis quiz 3
1/47
There's no tags or description
Looks like no tags are added yet.
Name | Mastery | Learn | Test | Matching | Spaced |
|---|
No study sessions yet.
48 Terms
sampling error
difference between sample statistic and true population parameter
Σ
sigma, sum
μ
mu, population mean
x̄
sample mean
independent variable
variable that is manipulated or categorized in study to observe its effect on another variable (dependent)
mean of z distribution
0
how are z score and standard deviation related?
z score represents how many standard deviations a data point is away from a mean of a distribution
standard deviation and what is the equation
measure of the amount of variability or dispersion in a data set
indicates how spread out the values in a data set are around mean (average)
smaller = data points closer to mean

standard error
how much the sample mean or any other sample stat is expected to vary from true population mean
estimate of variability or precision of the sample mean
smaller = sample mean is more accurate estimate of population mean
order of hypothesis testing
1) state hypotheses
2) set decision criterion
3) collect sample data
4) calculate statistics
5) make a decision
type one error
statistical test incorrectly rejects a true null hypothesis
conclude there is an effect or relationship when there is none
false positive
type two error
fails to reject a false null hypothesis
conclude there is no effect or relationship when there is one
false negative
Z test
compare sample mean to known population mean
test if sample mean is significantly different from a known population mean
sample size larger than 30
normal distribution
population standard deviation is known
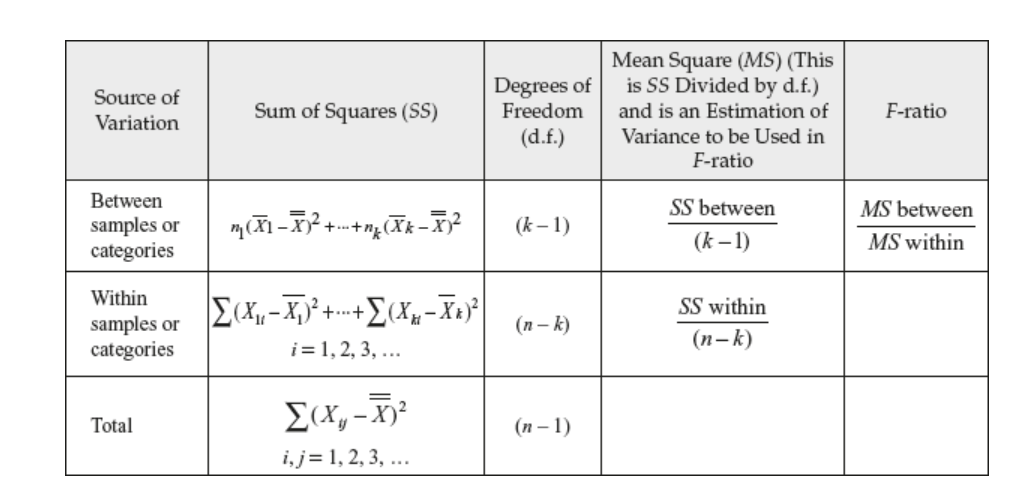
ANOVA
means of three or more groups to determine if at least one group mean is significantly different from others
test the hypothesis that all groups means are equal
data are independent, normal distributed within each group
homogeneity of variance
one way or two way
two way ANOVA
compares means across two factors allowing interaction effects
t test
compares means of one or two groups
similar to z test BUT
sample size is small (n<30)
normal distribution
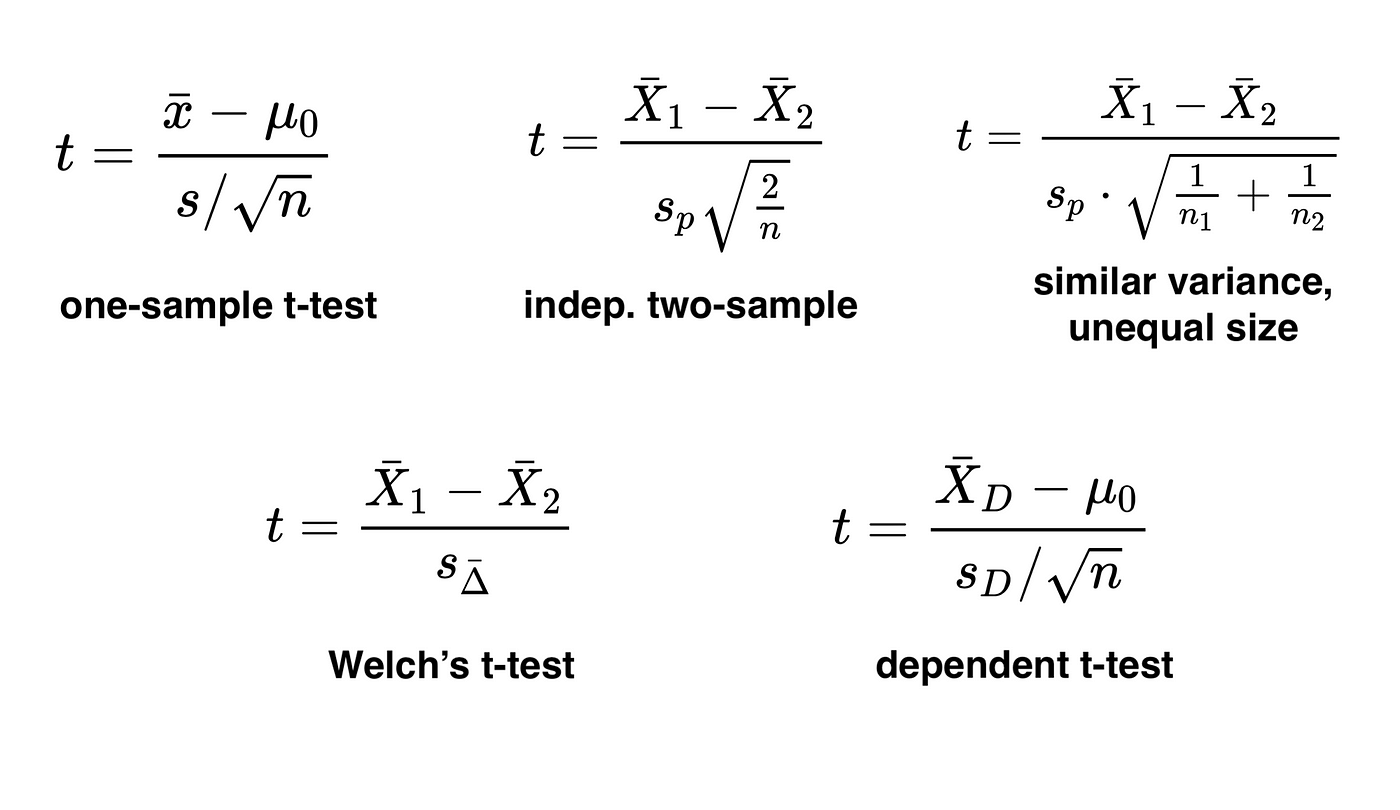
one sample t test, independent sample t test, paired sample t test
one sample t test
compare sample mean to known value often a population mean
one tailed t test (left)
lower tail
is sample mean significantly less than population mean?
alt hypothesis - sample mean less than population mean
null hypothesis - sample mean greater than or equal to population mean
one tailed t test (right)
upper tail
is sample mean significantly greater than population mean
alt hypothesis - sample mean is greater than pop mean
null hypothesis - sample mean less than or equal to pop mean
large sample effect
does not direct affect standard deviation of individual sample but better estimate of populations true standard deviation
lead to smaller standard errors, more likely to be closer to population mean
more normal in shape even if population distribution itself is not normal due to central limit theorem
sampling distribution gets narrower estimate more precise
paired t test
two related samples or observation that are paired in some way
before and after, matched samples, dependents, etc
individual (independent) t test
means of two independent or unrelated groups, no relationship with each other, normal distribution, homogeneity of variances
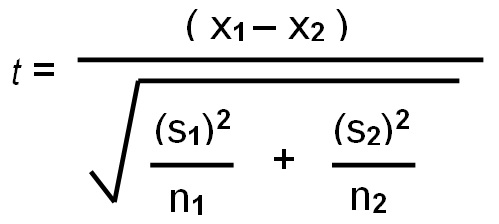
variances of the two groups are roughly equal not use welchs t test
effect size
used to quantify the magnitude of a different for relationship observed in a study
determine how strong or meaningful the effect is
Pearson’s r
correlation
strength and direction of linear relationship between two continuous variables
eta squared n2
for ANOVA
measure proportion of the total variance in dependent variable that is explained by independent variable
if n2 is small, it suggest other factors are more important than study method
omega squared (w2)
for ANOVA
assessing effect size in ANOVA more conservative than eta
total variance
include everything that could influence scores
between group variance
part of variance that is explained by study method
variability due to difference between means of groups
how much group mean difference from overall mean of entire sample
Measures how much the average weight loss for each diet (A, B, and C) differs from the overall average weight loss across all participants.
cohens d
mean difference
most commonly used to measure the effect size between two groups
measures the size of difference between two groups in standard deviation units
one way ANOVA vs one way t test
groups are independent of each other
test if there is significant difference between groups
t test - 2 groups
anova - 3 or more groups
why use an ANOVA?
compare multiple groups
avoid risk of type 1 error
determine whether there is a significant difference in group means while analyzing in the data
analyze more complex designs including interactions
what do we do after we find a significant effect in an ANOVA test?
usually follow up with a t test
examine effect size visualize results check assumptions
within group variance
variability within each group
how much individual data points within each group deviate from their respective group mean
Measures how much the individual participants' weight loss values within each diet group (A, B, or C) differ from their respective group means.
mean
measure of central tendency in a data set
average value of all data points
variance
spread or dispersion of data of far data points are from the mean
f ratio/statistic
used in ANOVA
compare variability between groups to variability within groups
whether the means of three groups or more are significantly different from each other
can never equal 0 unless there is no variability
closer it is to 1.0 less of an effect there is of the independent variable in the data
t value/t statistic
larger the sample size the closer t is to the z
is used in t test
determine whether the difference between two sample means is statistically significant
measures of the difference between observed sample stat and hypothesized population parameter
how many standard errors the sample mean is from population mean (one sample t test)
how many standard errors the difference between the means of two groups is from zero
what happens if our limits test fail in our t test?
means assumption of normality independence or homogeneity of variance is violated
can affect the validity of results
adjust test using welchs t test or non parametric tests
sampling distribution of the mean
take multiple random sample and calculate mean for each sample
plot them
the distribution it forms = this
approx equal to pop mean
sample size increase then it gets narrower estimate more precise
bonferroni correction
running one hypothesis test = 5% chance of type one error
running multiple tests, each test has 5% chance of false positive, probability of making at least one type 1 error increases
helps control this by adjusting significance level
reduces type 1 but increase type 2
full standard deviation vs standard deviation

full - population
other - sample
full variance vs variance

estimated standard error

standard error formula

sum of squares

z score

anova formula
t test formula