Exam 3: Intro to Statistics (Part 1)
1/55
There's no tags or description
Looks like no tags are added yet.
Name | Mastery | Learn | Test | Matching | Spaced | Call with Kai |
|---|
No study sessions yet.
56 Terms
We have two main categories of statistics, what are they?
- Descriptive & Inferential
What is Descriptive Statistics?
- It simply describes the data
What is Inferential Statistics?
- A lot of what you can do here is based on how your study is structured & how the data is "described"
This is associates with what category of statistics?
~ Generalize from samples to populations
~ Hypothesis testing
~ Make predictions
- Inferential Statistics
This associates with what category of statistics?
~ Organize
~ Summarize
~ Simplify
~ Describe and present data
- Descriptive Statistics
Descriptive Statistics measures the what?
- Central Tendency & Variability
Central Tendency involves what?
- The mean, median, mode, & range
What is the "Mean"?
- The average of the data set
Example:
- You have 1, 3, 4, 6, 6, 7, & 8
- Now you add all those values up and divide it by the total of values that you are given. So, we have a sum of 35, we now divide that sum by 7 and our "mean average is 5"
What is the Median?
- It is the middle number in your data set
Example:
1, 3, 4, 6, 6, 7, & 8
- The middle number is 6
What is the Mode?
- The most common number that is represented within the data
Example:
1, 3, 4, 6, 6, 7, & 8
- The number that is repeated more than once is 6, so the answer is 6
What is the Range?
- It is technically a measure of variability
- You essentially take the largest number from the data set and subtract it from the smallest number within the data set
Example
1, 3, 4, 6, 6, 7, 8
- So, I would subtract 8-1 and my answer would be 7
Give me a picture of the Normal Curve?
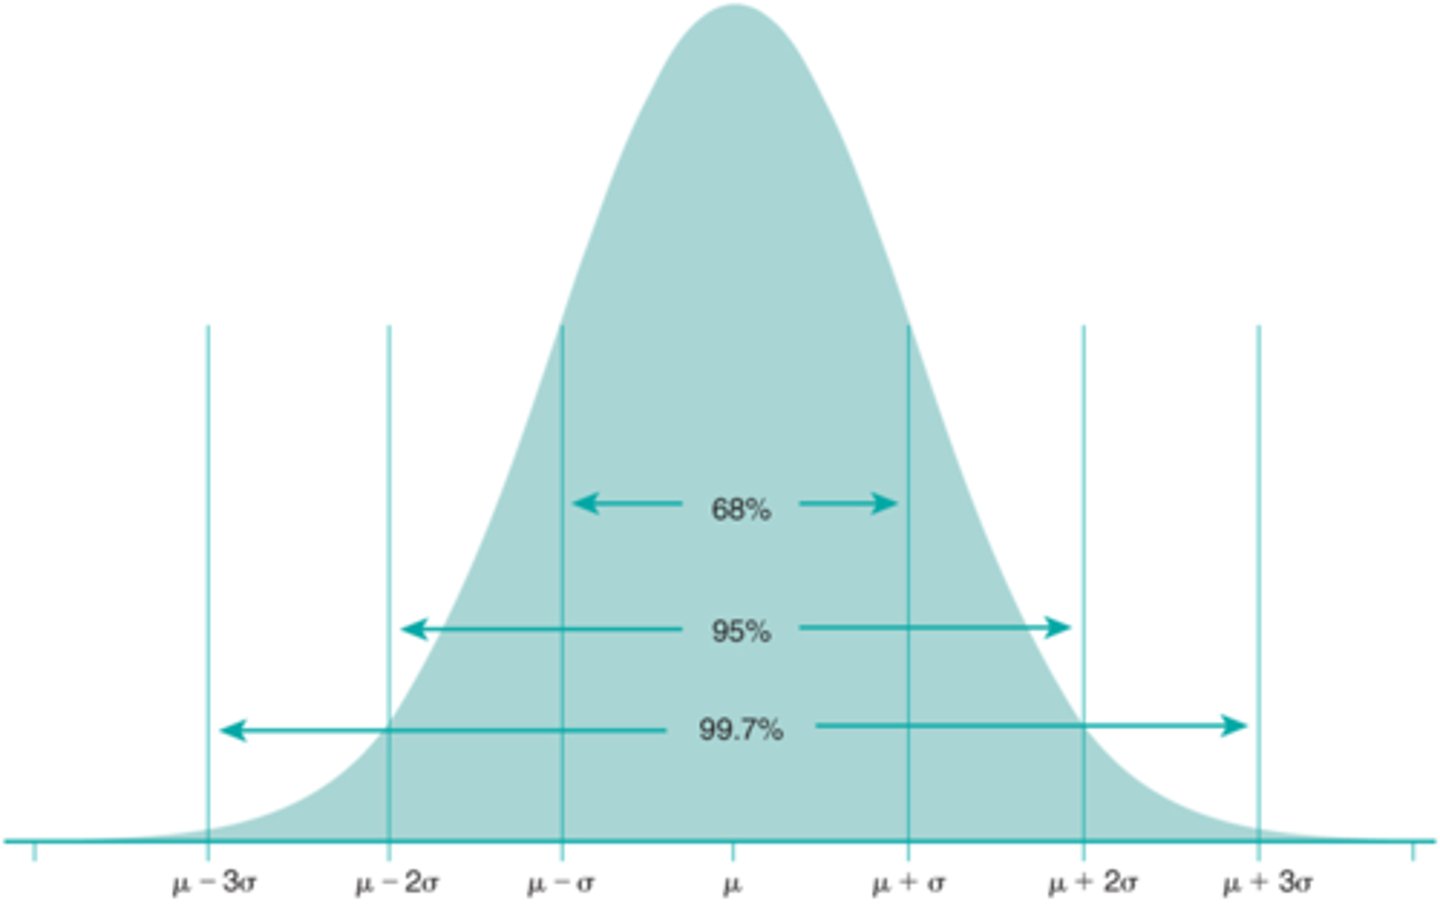
Describe the Normal Curve?
- The infamous bell curve
- Scores are normally distributed around the central value
- It is an important prerequisite to applying parametric statistics to your data
What does Standard Deviation do?
- Measures the dispersion of values in a data set in standardized proportions
Give an example of variability and standard deviation?
Avg: 60
Range: 53-66
SD: 2
68% of scores are between 58 and 62 (1 SD)
95% of scores are between 56 and 64 (2 SD)
99.7% of scores are between 54 and 66 (3 SD)
-------------
Avg: 60
Range 20-100
SD: 13
68% of scores are between 47 and 73 (1 SD)
95% of scores are between 34 and 86 (2 SD)
99.7% of scores are between 21 and 99 (3 SD)
What does a smaller standard deviation mean?
- The values are closer to the mean
What does a large standard deviation mean?
- The values are farther from the mean
What is Coefficient of Variation?
- Variability in a data set expressed as a proportion of the mean
- It is expressed as a percentage
- The lower the CV the more precise the data
- We see less variability around the mean
What is the formula for coefficient of variation?
- Standard deviation divided by the mean
What is a good value of the coefficient of variation?
.05 is a good number, anything different means that your data is getting kind of messy
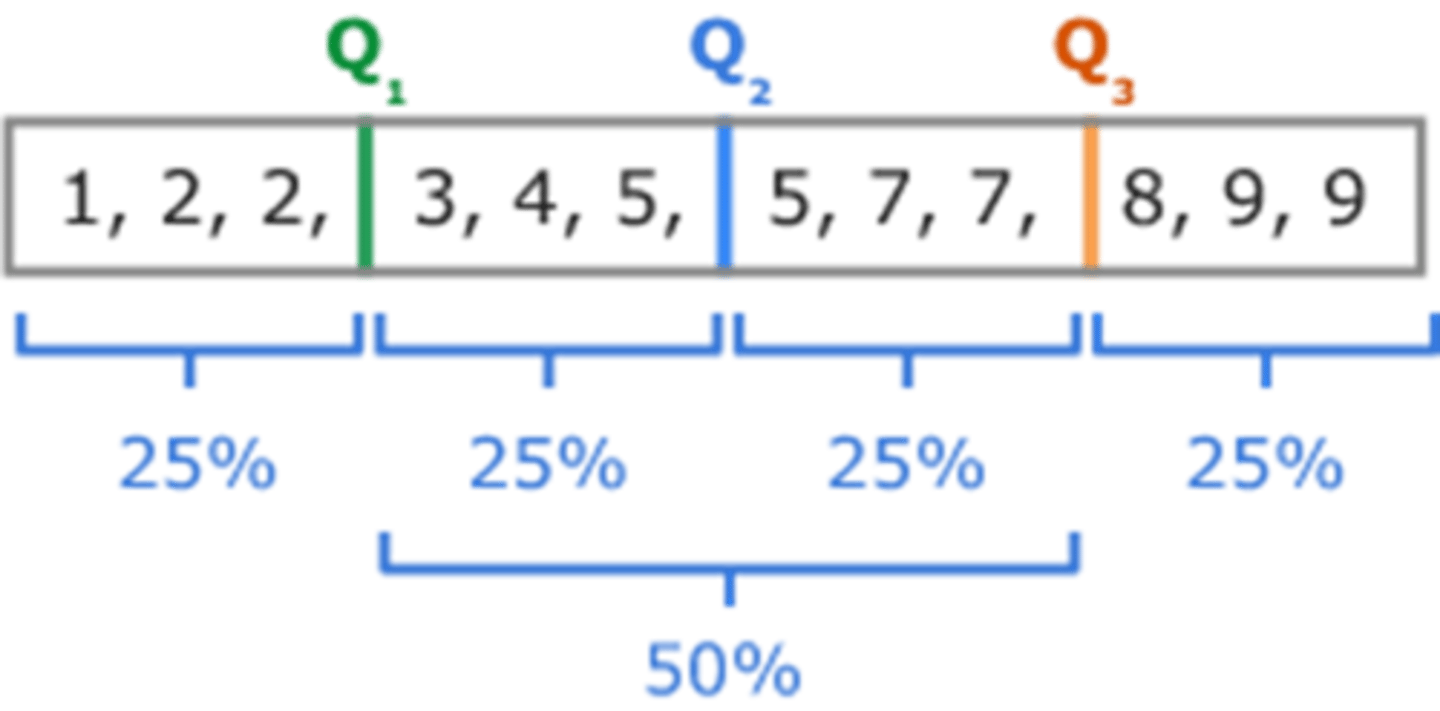
What are Interpercentile Ranges?
- Data divided into equal portions so for example in quarters, thirds, tenths, & hundredths
- They help determine where an individual score lies in relation to other scores (it can be referred to generically as percentiles)
Show me an example of Interpercentile Ranges?
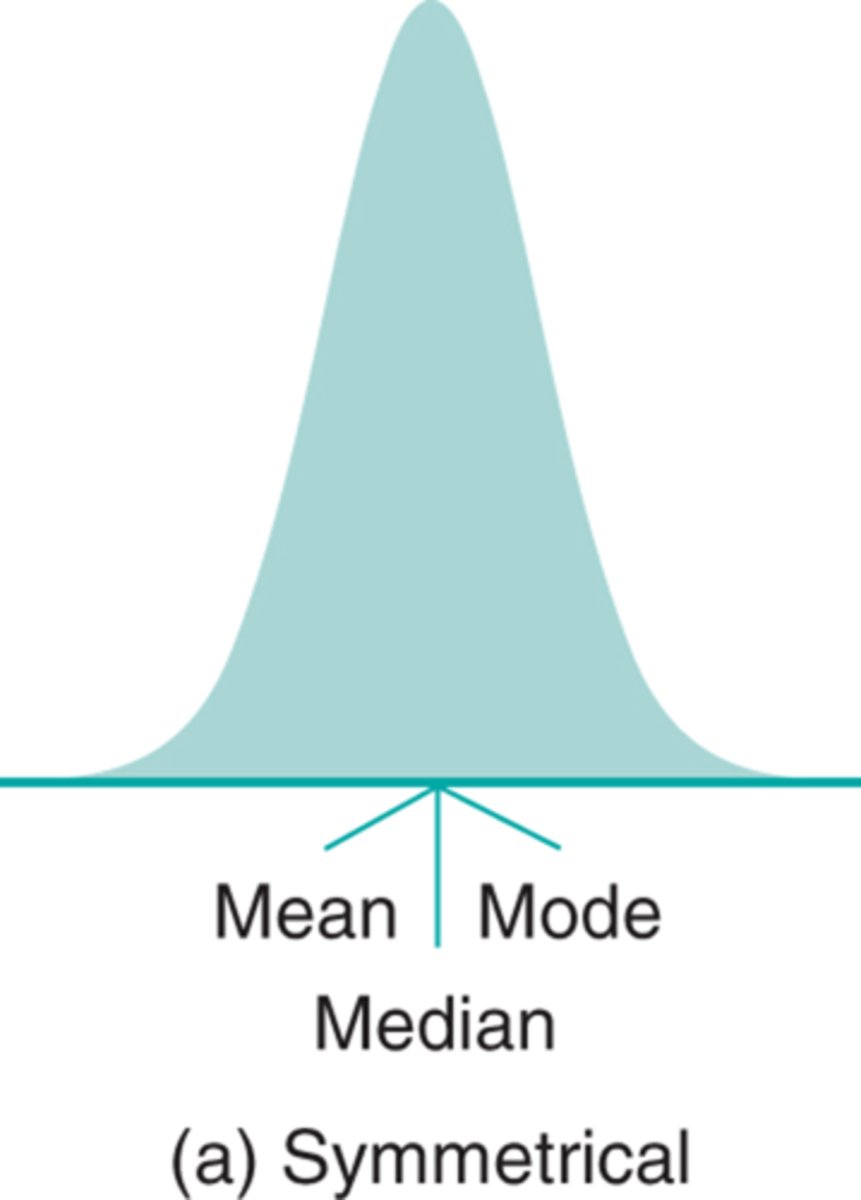
Skewed curves are usually due to what?
- Outliers
Show me a symmetrical curve?
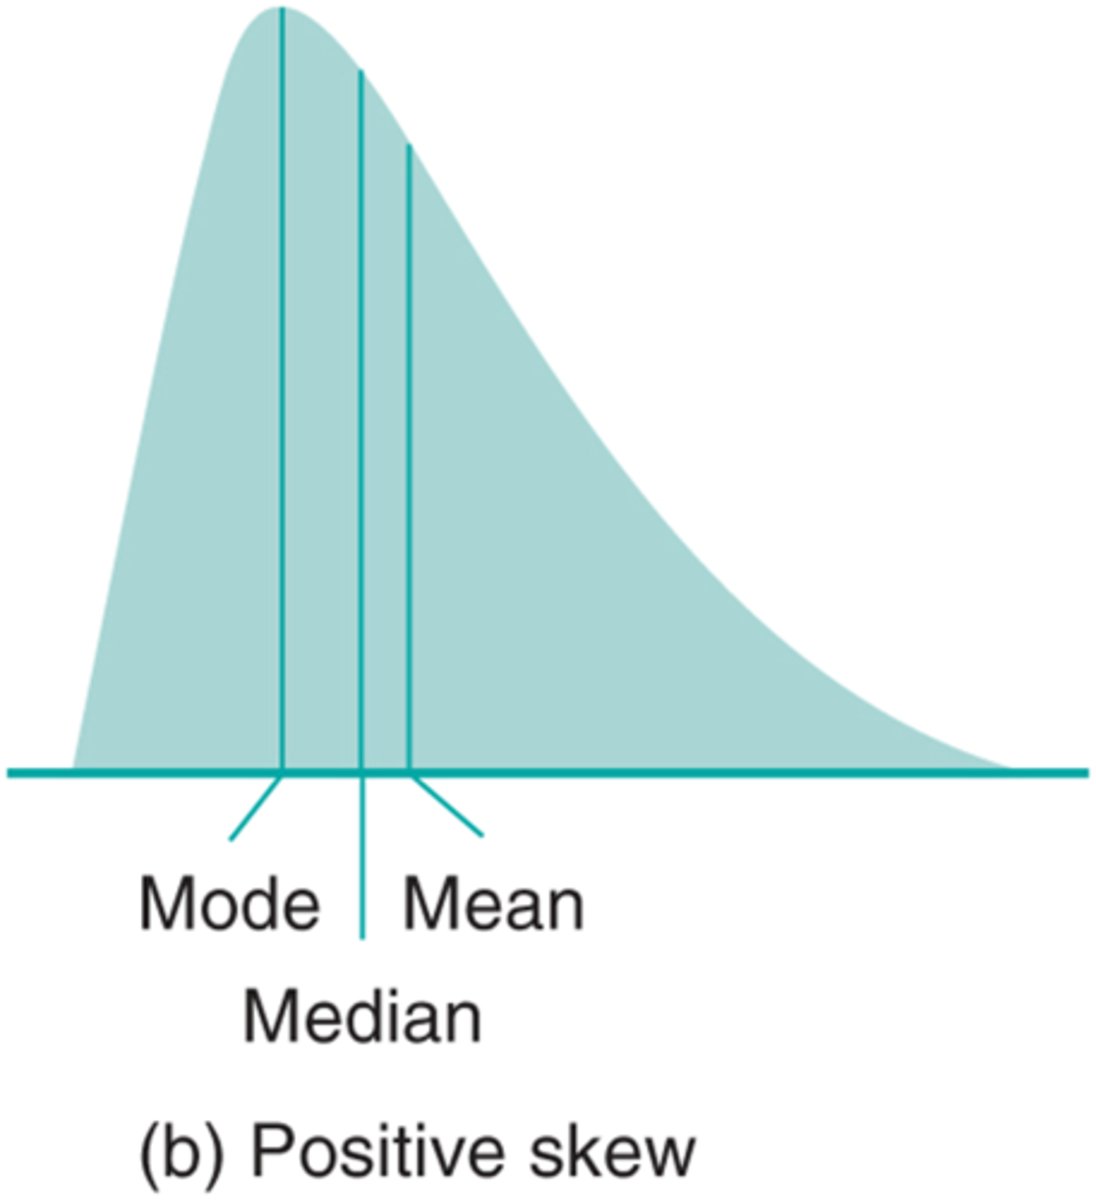
Show me a positive skewed curve?
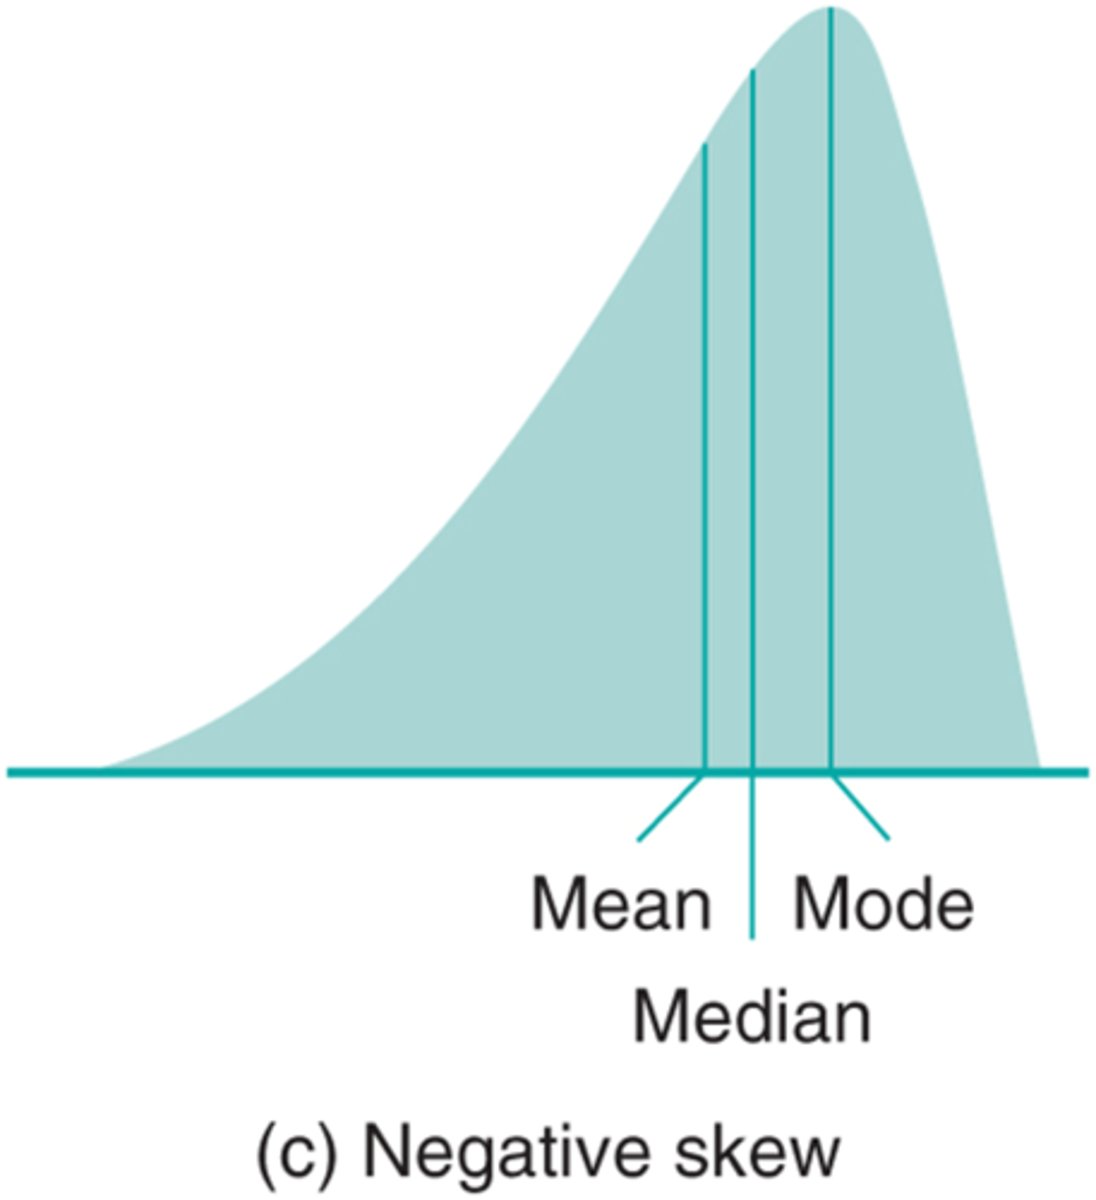
Show me a negative skewed curve?
What is the Effect Size?
- The difference of two mean values divided by the pooled standard deviation
0.2 is a minimal, moderate, or large effect?
- Minimal Effect
0.5 is a minimal, moderate, or large effect?
- Moderate Effect
0.8 is a minimal, moderate, or large effect?
- Large Effect
Give me an example of Effect Size?
Example:
- Two groups of patients with ankle fractures that had to be casted, but did not require ORIF. Cast is removed. 20 patients in each group.
~ Control group: No PT, just walked on it
~ Intervention group: Had a course of physical therapist treatment
~ Dependent variable is change in ROM (DF)
---------------
Control Group:
~ 10 degrees PF ROM
Intervention Group:
~ 10 degrees of DF ROM
Difference:
= 20 degrees
Standard Deviation:
= 5
- So, the difference in SDs = 4 (20 degrees is 4 sets of 5 degrees)
--------------
Now we do:
- Intervention group subtracted by controlled group average divided by pooled standard deviation
- We get 4/5, which gives us an effect size of 0.8
How does MCID and Effect Size come into play together?
- To reduce bias, and strengthen the data, researchers often report both MCID's and effect size
Give an example of MCID vs. Effect Size?
Example:
- A 20 degree change in ROM between groups.
You get an effect size of 0.8
You also get an MCID on the LEFS
-----------
- This makes a strong case for your conclusion that the interventions produced different results from the control
Inferential Statistics has two broad groups that it delas with, what are they?
- Parametric Stats
- Nonparametric Stats
What is the parametric of central tendency?
- Mean Values
What is the nonparametric of central tendency?
- Median Values
What type of distribution do we see within parametric statistics?
- Normal Distribution
What type of distribution do we see within nonparametric statistics?
- No normal, so it is skewed
What type of data do we see within parametric statistics?
- Interval
- Ratio
What type of data do we see within nonparametric statistics?
- Ordinal
- Nominal
Parametric statistics are generally used for what type of data?
- Ratio & Interval
Generally, your data within parametric statistics must be normally distributed or not normal (skewed)?
- Must have data that is normally distributed
What is Testing Relationships?
- Are 2 variables related
Describe Testing Relationships?
- Number of pack-years of cigarettes smoked and incidence of lung disease
- Is strength training correlated to muscle mass?
- Number of hours spent reading assignments versus major exam scores
What is Testing Differences?
- Is there a difference in 2 variables
Describe Testing Differences?
Presence of lung disease in:
- People who have never smoked
- People who have smoked for at least 10 pack years
Difference in muscle strength gain in:
- People who do circuit training
- People who do free weights
Grades of students who:
- Read assignments consistently
- Review power points only
Within parametric statistics with testing relationships, what are we trying to see?
- If there is a relationship between 2 variables
Examples:
You are outside on a dry, hot, & sunny summer weather
- This could cause to get a sunburn and it could cause some individuals to go get ice cream
True or False
Relationship between causation has no correlation with one another when testing for relationships?
- True
Example:
- Since it is so hot people are getting ice cream and this causes an increase in sunburns <--- just bc people are getting ice cream when its hot does not mean that people are going to get a sunburn
During parametric statistics while testing for relationships, variables need to be what and we need to have what type of distribution of data?
- Variables need to be interval or ratio
- Need to have a normal distribution of data
What is Pearson's Correlation?
- Is there a correlation between 2 variables
- Comparing one variable to another
What is Intraclass Correlation (ICC) or also known as Multiple Correlation?
- Is there a correlation between 3 or more variables
.00 -.25 shows us what as a coefficient?
- Has little or no relationship
.26 - .50 shows us what as a coefficient?
- Has a mild relationship
.51 - .75 shows us what as a coefficient?
- Has a moderate to good relationship
.76 - 1.0 shows us what as a coefficient?
- Has a good to strong relationship
Describe testing relationships: The World of Regression?
- Regression has some predictive values
- Regression analysis uses more complicated mathematical formulas to arrive at conclusions
- So, we see very utilitarian for prognostic or outcome studies