Econ 2105 HW 1
1/24
There's no tags or description
Looks like no tags are added yet.
Name | Mastery | Learn | Test | Matching | Spaced | Call with Kai |
|---|
No analytics yet
Send a link to your students to track their progress
25 Terms
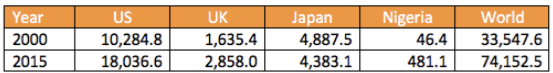
The GDP in current US$ for selected countries and the world are given below in $ billions (source: World Bank). Based on this information, which of the following statements is correct?
The GDP of Japan grew by 10.3% over the 15 years.
Of the four countries, Nigeria was the only country that had a higher growth rate than that of the world over the 15 years.
The UK GDP growth rate was higher than that of the US.
The world GDP grew by over 10% per year on average.
Of the four countries, Nigeria was the only country that had a higher growth rate than that of the world over the 15 years.
Which of the following are examples of capital goods?
Raw materials.
Buildings.
Intellectual property.
Patents.
Raw materials.
Buildings.
Intellectual property.
Patents.
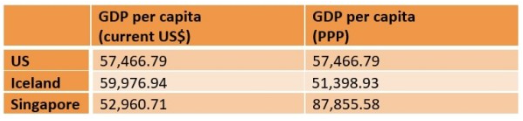
The following are the 2016 GDP per capita in current US$ and purchasing power parity (PPP) of the US, Iceland, and Singapore (taken from http://data.worldbank.org). Based on this information, which of the following statements are correct?
Using the PPP measure of GDP per capita reflects the real purchasing power of the country.
According to both measures, Iceland has the highest GDP per capita among the three countries.
Let SG$ X be the amount of Singapore dollars that can be bought for 1 US$ at the current market exchange rate. Then SG$ X would buy much more goods and services in Singapore than 1 US$ would do in the US.
GDP per capita at the current exchange rate gives a better comparison between the countries than the PPP measure of GDP per capita.
Using the PPP measure of GDP per capita reflects the real purchasing power of the country.
Let SG$ X be the amount of Singapore dollars that can be bought for 1 US$ at the current market exchange rate. Then SG$ X would buy much more goods and services in Singapore than 1 US$ would do in the US.
An individual's well-being can be partly measured by:
Her disposable income.
The quality of her social and physical environment, such as friendship and clean air.
Goods and services that are provided by the government, such as healthcare and education.
Goods and services that are produced within the household, such as meals and childcare.
Her disposable income.
The quality of her social and physical environment, such as friendship and clean air.
Goods and services that are provided by the government, such as healthcare and education.
Goods and services that are produced within the household, such as meals and childcare.
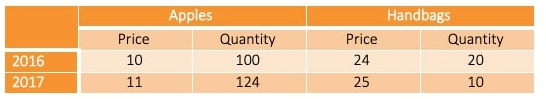
Eden, a country, produces just two output goods: apples and snakeskin handbags. The quantities produced and the prices of the two goods in 2016 and 2017 (in $) are given below. Based on this information, which of the following statements is correct?
Nominal GDP in 2016 was $1,614.
Real GDP grew between 2016 and 2017.
Nominal GDP growth rate between 2016 and 2017 was 9.1%.
Nominal GDP in 2017 was $1,480.
Nominal GDP growth rate between 2016 and 2017 was 9.1%.
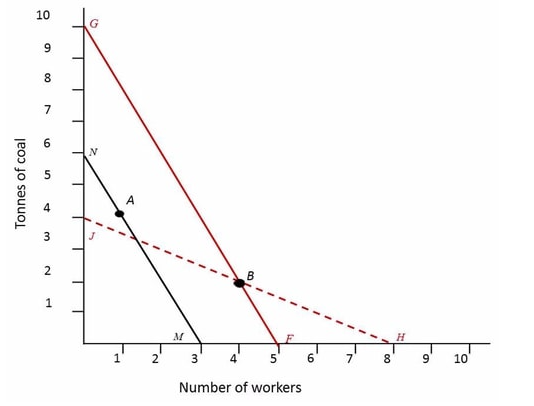
In the following diagram you are given two technologies, A and B, which can produce 100 metres of cloth. Technology A uses 1 worker and 4 tonnes of coal, while technology B uses 4 workers and 2 tonnes of coal. The diagram also depicts three examples of isocosts, NM, GF and JH. The wage cost and the price of coal are denoted by w and p, respectively. Which of the following statements is correct?
Isocost JH corresponds to the case where the w = $20 and p = $10.
Isocost NM is the only one of the three isocosts depicted which corresponds to the case where w = $20 and p = $10.
When w = $20 and p = $10, the cost of using technology A is $60.
The cost of using technology B is the same for both isocost JH and isocost GF.
When w = $20 and p = $10, the cost of using technology A is $60.
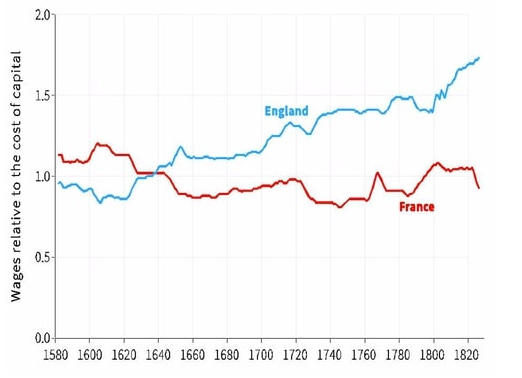
The following graph shows wages relative to the cost of capital in England and France from 1580 to 1830. Based on this information, which of the following statements is correct?
In the early 1800s, the nominal wage level was 50-70% higher in England than in France.
The rise in the relative wage level in England is solely attributed to the rise in the absolute wage level.
The rise in relative wage level in England would have encouraged innovations in more labour-intensive technologies.
On a graph with the number of workers on the horizontal axis and the amount of capital on the vertical axis, the graph for England represents a steepening of the isocost lines.
On a graph with the number of workers on the horizontal axis and the amount of capital on the vertical axis, the graph for England represents a steepening of the isocost lines.
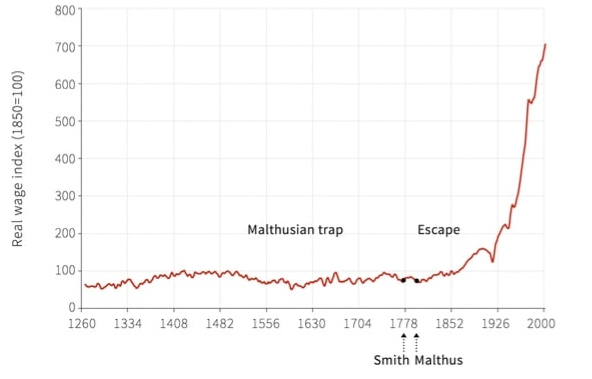
The following figure is an index (base 1850) of average real wages of skilled workers in London between 1264 and 2001. Based on this information, which of the following statements is correct?
Malthus was incorrect in his assessment of the historical data.
London was able to escape from the Malthusian trap by reducing its population growth rate.
Some of the rapid rise in wages depicted can be attributed to inflation.
The shape of the graph would be the same even if a different year was used as the base year.
The shape of the graph would be the same even if a different year was used as the base year.
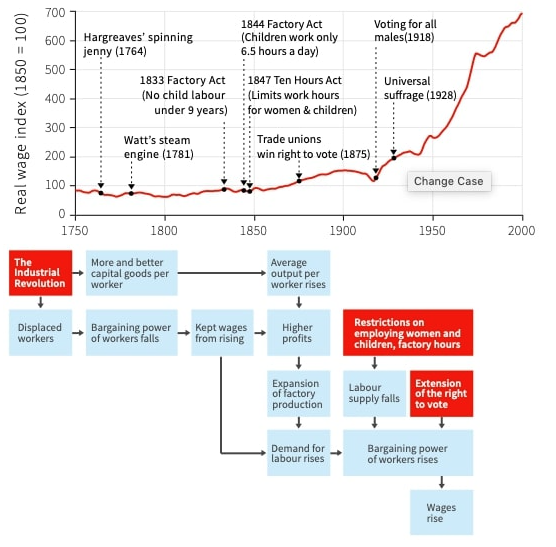
The following figures show the real wage index in England from 1750 to 2000, and the explanation of how England escaped the Malthusian trap. Based on this information, which of the following statements is correct?
The real wage did not rise in the 18th century due to stagnating labour productivity.
The Factory Acts of 1833 and 1844 and the Ten Hours Act of 1847 reduced the bargaining power of the workers.
Dips in the real wage index after the extension of voting rights in 1875, 1918, and 1928 imply that more voting rights eventually lead to lower real wages.
The graph demonstrates the importance of higher bargaining power in order for workers to benefit from higher labour productivity.
The graph demonstrates the importance of higher bargaining power in order for workers to benefit from higher labour productivity.
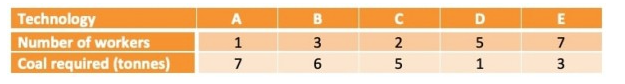
The following table gives different technologies that produce 100 metres of cloth. Based on this information, which of the following statements is correct?
You would never choose technology B.
Technology C is more energy-intensive than technology A.
Shifting from technology C to technology D is labour saving.
Technology D uses the least total number of workers and tonnes of coal. Therefore this is the technology you would choose.
You would never choose technology B.
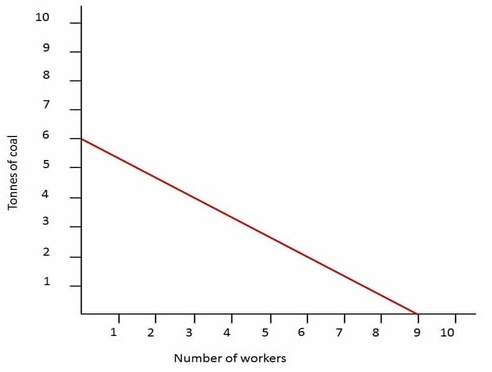
Production of cloth requires two inputs: L workers and R tonnes of coal. The following diagram depicts the isocost associated with production. You are also given that the wage (w) is $20 and the price (p) of coal is $30. Which of the following statements is correct?
The isocost suggests that the cost of using 6 workers and 2 tonnes of coal is the same as that of using 3 workers and 4 tonnes of coal.
The slope of the isocost is -1/3.
The cost associated with the isocost is $120.
All points above the isocost would cost more than $210.
The isocost suggests that the cost of using 6 workers and 2 tonnes of coal is the same as that of using 3 workers and 4 tonnes of coal.
You currently work for 40 hours a week at wage rate of GBP 12 an hour. Your free hours are defined as the number of hours not in work, which in this case is 24 hours x 7 days - 40 hours = 128 hours per week. Suppose that you are happy to keep your total weekly income constant. Then:
If your wage rate increases to GBP 16 an hour, then your free time will increase by 6%.
To have 12.5% more free time, your wage rate needs to increase by GBP 8.
Doubling the wage rate would decrease your working hours by a third.
A wage cut of 25% leaves you with only 100 hours of free time.
To have 12.5% more free time, your wage rate needs to increase by GBP 8.
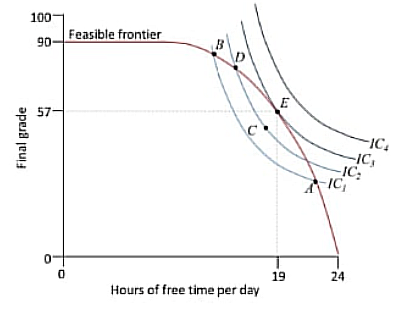
The figure shows a student's feasible frontier and her indifference curves for her final exam grade and the hours of free time per day. Based on this information, which of the following statements is correct?
The student prefers D to C, as D is on the feasible frontier.
A or B may be chosen over C despite being on a lower indifference curve, as the student would never choose a point below the feasible frontier.
Any points above IC3 are strictly preferred to the student's final choice but are unattainable.
The student should try to attain as high a grade as possible.
Any points above IC3 are strictly preferred to the student's final choice but are unattainable.
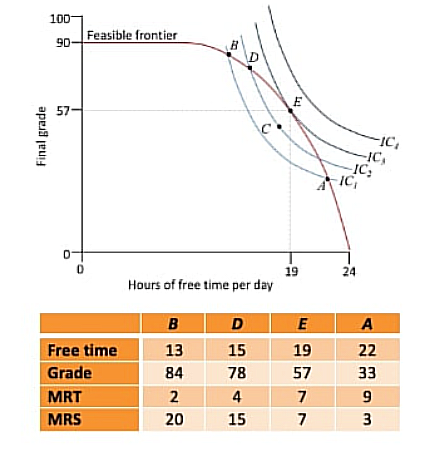
The figure shows a student's feasible frontier and her indifference curves for final exam marks and the hours of free time per day. The table also gives the marginal rate of substitution (MRS) and the marginal rate of transformation (MRT) for the points shown in the figure. Based on this information, which of the following statements is correct?
At A, one hour of free time is equivalent in value to 3 grade points. However, 1 extra hour of studying leads to 9 extra grade points. She should therefore study more.
At B, one hour of free time is equivalent in value to 2 grade points. However, 1 extra hour of studying leads to 20 extra grade points. She should therefore study more.
At D, the MRT of 4 means that if she gives up all of her free time, she can attain 60 extra grade points.
At E, the MRS matches the student's MRT. Therefore she should exchange one hour of free time with 7 extra grade points.
At A, one hour of free time is equivalent in value to 3 grade points. However, 1 extra hour of studying leads to 9 extra grade points. She should therefore study more.
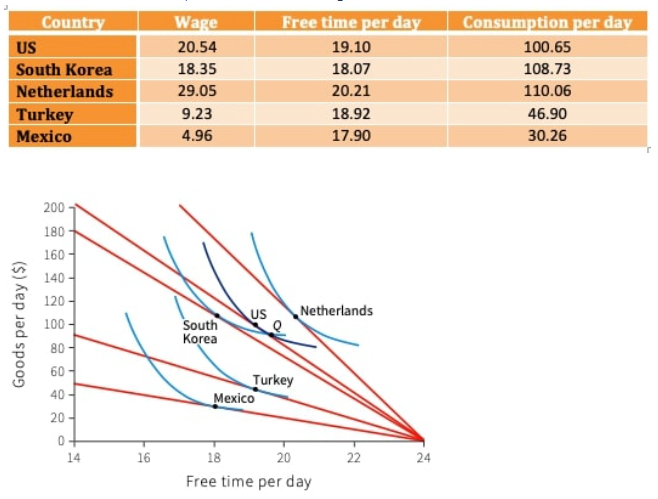
The following table shows the hours of free time and consumption per day across five different countries in 2013. The diagram below shows this data, along with hypothetical indifference curves. Based on this information, which of the following statements is correct?
The indifference curves can be estimated from the data in the table.
The evidence from the Netherlands shows that tripling the wage rate in Turkey would cause daily consumption to more than double.
The data suggests that the positive income effect of a rise in the wage rate on the hours of free time always dominates its negative substitution effect.
There is evidence that the US workers value free time more relative to consumption compared to South Korean workers.
There is evidence that the US workers value free time more relative to consumption compared to South Korean workers.
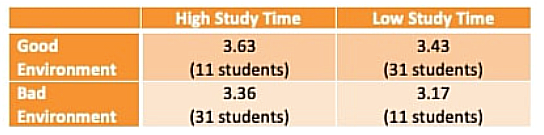
The table shows the study time, study environment and the resulting grade (average GPA) for 84 students. Based on this information, which of the following statements are correct?
Holding environment constant, high study time leads to a better grade.
The amount of time spent studying is important, while the environment has no effect on the results.
More students spend a longer time studying if their environment was bad compared to if their environment was good.
All students who spend a longer time studying attain a higher grade on average than those who study fewer hours, irrespective of their study environment.
Holding environment constant, high study time leads to a better grade.
More students spend a longer time studying if their environment was bad compared to if their environment was good.
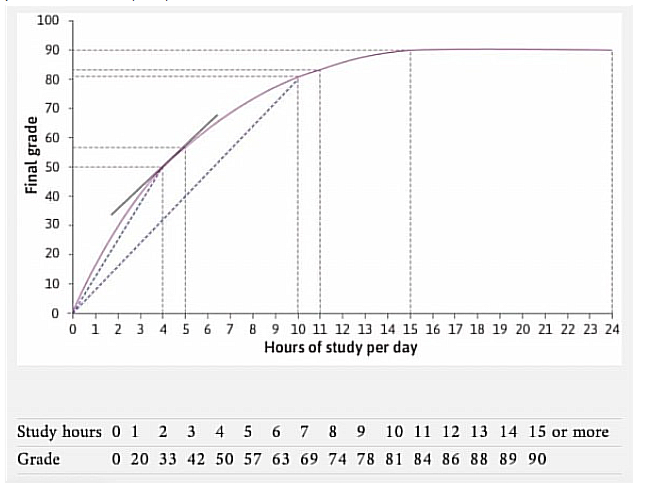
The figure shows a student's production function with the final grade (the output) related to the number of hours spent studying (the input). Which of the following statements regarding the average product of labour (APL) is correct?
The APL is decreasing beyond 15 hours of study.
The APL at 10 hours is 3.
The APL is the slope of the tangent line.
The APL at 0 hours is 20.
The APL is decreasing beyond 15 hours of study.
You are given the following table for a student's production function with the final grade (the output) related to the number of hours spent studying (the input). Which of the following options correctly fills in a missing number?
9
127
123
14
14
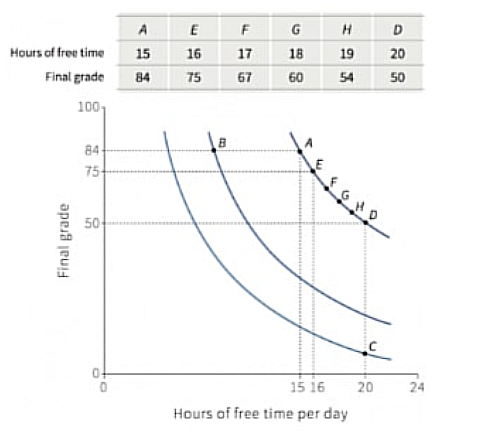
The figure shows the indifference curves of a student for the two 'goods', free time and final grade. Based on this information, which of the following statements is correct?
At A, the student is willing to give up 34 grade points for five extra hours of free time.
A is the student's most preferred choice as she would be attaining the highest grade.
The student strictly prefers a grade of 54 with 19 hours of free time to a grade of 67 with 18 hours of free time.
If at B the number of free hours is 10, then the student is 50% happier at A than at B.
At A, the student is willing to give up 34 grade points for five extra hours of free time.
Eden, a country, produces just two output goods: apples and snakeskin handbags. In 2014 the prices of apples and handbags were $10 and $24, respectively. In 2015, the prices increased to $12 and $25. The quantities produced of the two goods were 100 and 20, respectively, in both 2014 and 2015. From this information, we can conclude that:
The nominal GDP in 2014 is $1,480.
The real GDP is unchanged between 2014 and 2015.
The nominal GDP growth rate between 2014 and 2015 is 14.9%.
The economy of Eden grew between 2014 and 2015 in real terms.
The nominal GDP in 2014 is $1,480.
The real GDP is unchanged between 2014 and 2015.
The nominal GDP growth rate between 2014 and 2015 is 14.9%.
Which of the following statements are correct?
In economics, a model is a simplified representation (diagrammatical or physical) that helps us to understand what is going on by focusing attention on what is important.
Ceteris paribus is an assumption used in economic models in which the important variables that you are focusing on are kept constant.
An equilibriumis a self-perpetuating situation that does not change, even when a force for change is introduced from the outside that alters the basic data describing the situation.
An economic rent is the benefit you receive above what you would have earned from your reservation option.
In economics, a model is a simplified representation (diagrammatical or physical) that helps us to understand what is going on by focusing attention on what is important.
An economic rent is the benefit you receive above what you would have earned from your reservation option.
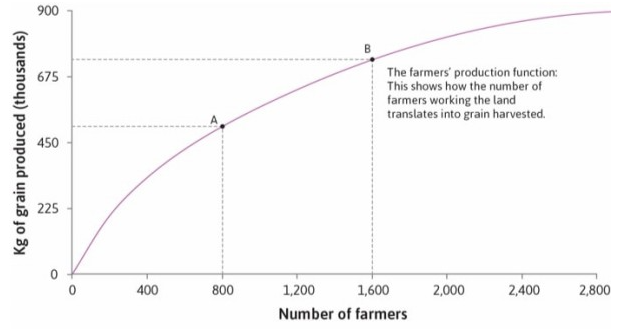
The following diagram depicts the production function of the farmers, where diminishing average product of labour is assumed. At A the average product of labour is 500,000/800 = 625 kg of grain per farmer. At B the average product of labour is 732,000/1,600 = 458 kg of grain per farmer. If you know that the grain output for 2,800 farmers is 894,000kg, then which of the following statements are correct?
When the labour input is 2,800, the average product of labour is 300 kg.
The slopes of the rays from the origin to the production function decrease along the curve, indicating that the average product of labour is decreasing.
If the production function curve is an upward-sloping straight line, then there is no diminishing average product of labour.
For this production function, it is possible that initially there are economies of scale (for example, when there are two farmers instead of one, the average output increases as they efficiently share the workload).
The slopes of the rays from the origin to the production function decrease along the curve, indicating that the average product of labour is decreasing.
If the production function curve is an upward-sloping straight line, then there is no diminishing average product of labour.
The average product of labour is diminishing when:
The marginal product of labour is diminishing.
The production function is concave.
The marginal product of labour is smaller than the average product of labour.
The marginal product of labour is negative.
The production function is concave.
The marginal product of labour is smaller than the average product of labour.
The marginal product of labour is negative.
The country of Shangri-La has only two inhabitants, Mr. High and Mr. Low. Mr. High's nominal income is twice as large as Mr. Low's. The personal price index of Mr. High from 2015 to 2016 is 2 (that is, the price index of the bundle of goods he consumes doubles), and from 2016 to 2017 it is 1/2. The personal price index of Mr. Low from 2015 to 2016 is 5, and from 2016 to 2017 it is 1/5. Which of the following statements are true:
The price index of Mr. High from 2015 to 2017 is 1.
The price index of Shangri-La from 2015 to 2016 is 3.
The price index of Shangri-La from 2015 to 2017 is 3.
The price index of Mr. High from 2015 to 2017 is 1.
The price index of Shangri-La from 2015 to 2016 is 3.
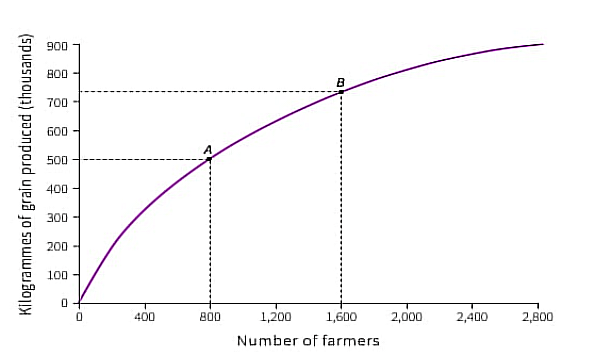
The following diagram depicts the production function of grain, where diminishing average product of labour is assumed. At A the average product of labour is 500,000/800 = 625 kg of grain per farmer. At B the average product of labour is 732,000/1,600 = 457.5 kg of grain per farmer. If you know that the grain output for 2,800 farmers is 896,000kg, then which of the following statements is/are correct?
In a year with exceptionally good weather conditions, the production function curve will be higher and parallel to the curve above.
If the production curve is an upward-sloping straight line, the average product of labour is constant.
When the labour input is 2,800, the average product of labour is 320 kg.
If the production curve is an upward-sloping straight line, the average product of labour is constant.
When the labour input is 2,800, the average product of labour is 320 kg.