IB Psychology SL1 | Unit 1 Quiz Terms to know
1/30
Earn XP
Description and Tags
Name | Mastery | Learn | Test | Matching | Spaced | Call with Kai |
|---|
No analytics yet
Send a link to your students to track their progress
31 Terms
Empirical Evidence
Information gathered through observations or experiments that can be measured or tested.
Construct
A concept that isn’t directly visible, like intelligence or happiness, but can be measured through related behaviors.
Null Hypothesis
A statement that says there is no effect or relationship between the variables being studied.
Operationalize
Turning an abstract idea into something measurable. For example, turning “stress” into a score on a stress test.
Standardized procedure
Using the same method for all participants to make sure the experiment is consistent.
Random allocation to conditions
Putting participants into groups by chance, so every person has an equal chance of being in any group.
True experiment
An experiment where the researcher controls everything, including who is in which group and what changes are made.
Field experiment
An experiment done in a natural setting, but the researcher still changes something to study the effect.
Quasi experiment
A study similar to an experiment, but participants aren’t randomly assigned to groups.
Natural experiment
A study where the change being studied happens naturally, without the researcher controlling it.
Sampling
Choosing a group of people to represent the larger population in a study.
Credibility
How believable or trustworthy the findings of a study are.
Generalizability
Whether the results of a study can apply to other people, places, or situations outside the study.
Confounding Variables
Other variables that unintentionally affect the outcome of an experiment.
Independent Samples design
A study design where different people are used in each group or condition.
Repeated Measures design
A study design where the same people are used in all conditions of the experiment.
Counterbalancing
A method to balance the order of tasks in an experiment to reduce any unfair effects of doing one task before another.
Validity
Whether a study measures what it’s supposed to measure.
Reliability
The consistency of results—whether the same study or test gives the same results over time.
Ecological Validity
Whether the findings of a study can be applied to real-life situations.
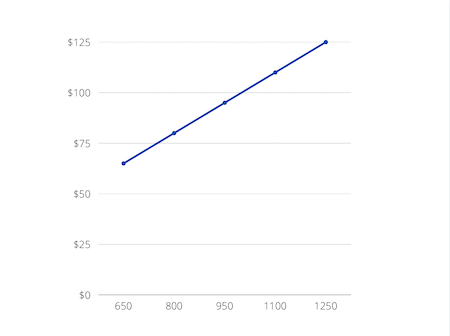
Positive correlation (what it looks like on a scatter plot)
When two variables increase together. On a graph, it looks like an upward slope.
Negative correlation (what it looks like on a scatter plot)
When one variable increases while the other decreases. On a graph, it looks like a downward slope.

Demand Characteristics
When participants guess what the study is about and change their behavior to fit those expectations.
Random Sample
A sample where every person in the population has an equal chance of being picked.
Stratified Sample
A sample that divides the population into subgroups, and people are randomly picked from each group.
Opportunity Sample
A sample made up of people who are easily available to the researcher.
Self Selected Sample
A sample where people volunteer to participate in the study.
Purposive Sample
A sample chosen based on specific traits that the researcher is interested in.
Snowball Sample
A sample where participants help find other participants, often used to study hard-to-reach groups.
Independent variable
The variable that the researcher changes to see how it affects something else.
Dependent variable
The outcome or effect that is measured in an experiment to see if it changes because of the independent variable.