Ch. 9: Climate Change & Global Warming
1/28
Earn XP
Description and Tags
Name | Mastery | Learn | Test | Matching | Spaced |
|---|
No study sessions yet.
29 Terms
Ice that formed thousands of years ago is often found to contain tiny bubbles of gas. This gas came from __________.
the atmosphere
when ice forms, it traps and preserves little bubbles of air.
If we take a sample of ice from 10 meters beneath the surface and find that it is 1,000 years old, where would we need to look for ice that is about 10,000 years old?
much deeper, about 100 meters below the surface
if ice formed on a regular basis, we would expect to find ice 10 times older about 10 times the depth
Which one of the following types of scientists would most likely be interested in the information we can learn from ice cores from Antarctica?
climatologists interested in climate change
climatologists would be interested in examining the changes in the proportions of gases such as carbon dioxide that affect the global climate
Which of the following questions is best addressed by studying ice samples from Antarctica?
How have the atmospheric levels of carbon dioxide changed in the last 100,000 years?
scientist can measure the concentration of carbon dioxide in bubbles from many different years and use this information to calculate patterns and trends.
Over the past 400,000 years, variations in global temperatures most closely paralleled changes in _____.
atmospheric levels of carbon dioxide
Global warming over the past 200 years is most closely associated with _____.
the industrial revolution
The most abundant greenhouse gas, which is not considered to be adding to global warming, is _____.
water vapor
Which of the following contribute the most to global warming?
carbon dioxide, methane, and nitrous oxide
The accuracy of computer forecasts of global climate change is measured by _____.
backcasting to see if the models accurately describe the weather and climate in the past
Which of the following is a cause of natural climate change?
volcanic eruptions
The greatest source of greenhouse gases in industrialized countries is _____.
power stations
In Brazil, what is the primary cause for increase in CO2 in the atmosphere?
deforestation
Impacts of global warming include all of the following except ________.
decrease in mortality because winter is warmer
Photovoltaic cells are ________.
devices that directly convert sunlight to electrical currents
Biofuels are ________.
FUELS THAT ARE DERIVED FROM PLANT MATERIAL
What is the current regulatory standard for gasoline mileage of automobiles in the U.S.?
27.5 miles per gallon
What is global warming?
the increase in atmospheric temperature since the late 1800s
what is the greenhouse effect?
the absorption of radiation by greenhouse gases and trapping of that heat
what is the global circulation model?
the use of basic physical principles to forecast future climate change
what is global warming potential?
the measure of an individual molecule’s long-term impact on atmospheric temperature
what are greenhosue gases?
gases that efficiently capture heat
Which of these would NOT contribute to a global increase in temperature?
planting trees
trees remove more carbon dioxide from the atmosphere than they release into the atmosphere. By removing carbon dioxide, they reduce the greenhouse effect, and this would contribute to a reduction in global temperature.
Switching from fossil fuels to _____ energy would significantly decrease the release of carbon dioxide into the atmosphere.
solar, nuclear, and geothermal
all of these energy sources would decrease the release of carbon dioxide into the atmosphere. However, the use of nuclear reactors is associates with other problems

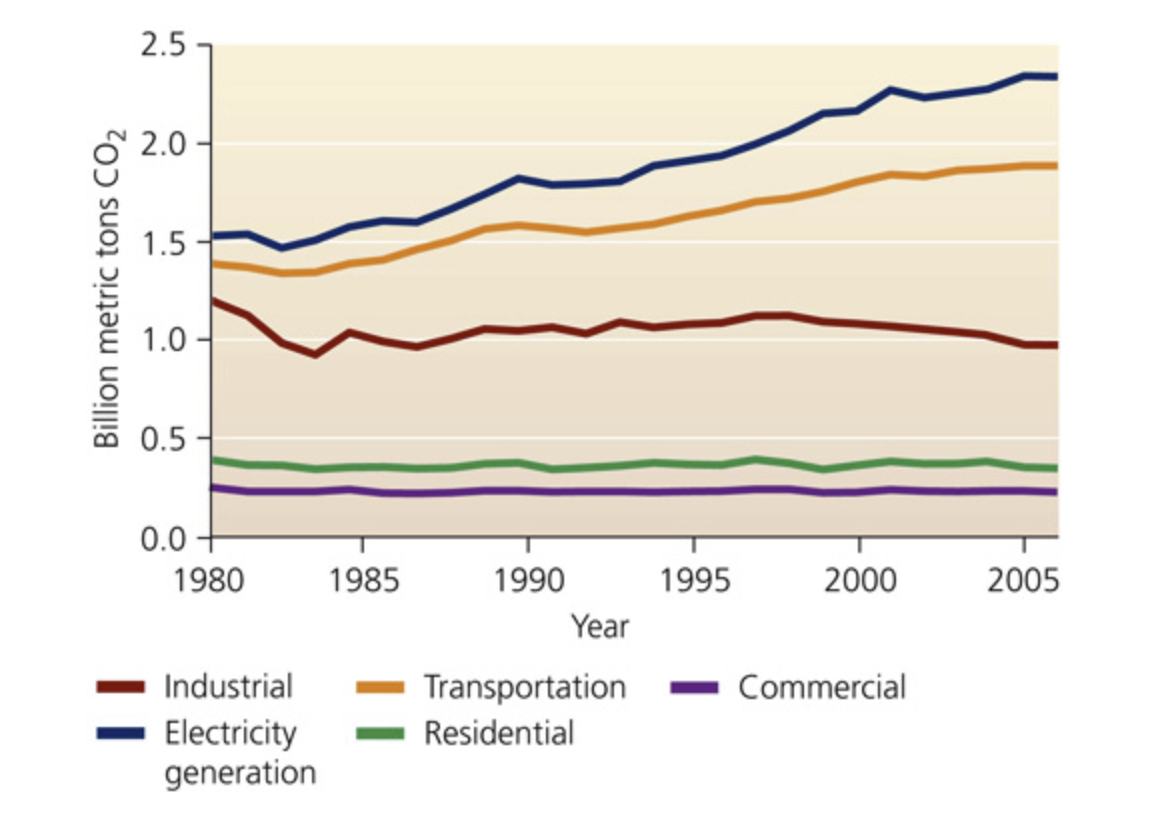
We burn fossil fuels to generate electricity, to power vehicles for transportation, and as primary energy sources (non-electricity uses, mostly for heating) in homes, businesses, and industry. For each of these uses, the accompanying graph shows trends in the emission of carbon dioxide from fossil fuel combustion in the United States.
(Figure 1)
What was the overall change in CO2 emissions for electricity generation from 1980 to 2005?
0.9 billion metric tons
there were 2.4 billion metric tons in 2005 versus 1.5 billion metric tons of CO2 in 1980, a change of 0.9 billion metric tons
What was the percent change in CO2 emissions for transportation from 1980 to 2005?
36%
the emissions for transportation were 1.9 billion metric tons in 2005 and 1.4 in 1980, for a difference of 0.5 billion metric tons and and increase of 36%
If U.S. population increased 32% from 1980 to 2005, how would you describe the change in per capita CO2 emissions for electricity generation?
As population increased, per capita CO2 emissions increased twice as fast.
emission for electricity generation increases by 60% while population increased 32%, so per capita emissions were increasing twice as fast as the population
Which of the following emission reduction strategies would result in the greatest overall decrease in CO2?
A 10% decrease in both electricity generation and transportation emissions
Correct. A 10% decrease in both electricity generation and transportation emissions would lead to a 0.43 billion metric ton decrease (0.24 + 0.19), which is the largest CO2 decrease of the four scenarios.
Now compare the change in GDP to the change in CO2 emissions from electricity generation. If GDP more than doubled from 1980 to 2005, what is the ratio of changes in CO2 emissions to changes in GDP for that period of time?
Less than 1:1, showing a slight CO2 decrease per unit of economic activity
Doubling the GDP is an increase of 100%, and the electricity-generation emissions increased 60%, so the ratio of emissions increase to GDP increase is less than 1:1.