managerial accounting exam 1
1/145
There's no tags or description
Looks like no tags are added yet.
Name | Mastery | Learn | Test | Matching | Spaced | Call with Kai |
|---|
No analytics yet
Send a link to your students to track their progress
146 Terms
financial books: audience?
investors, creditors
financial books: objective?
communicate profit, cash flows, and financial position
financial books: rules?
U.S GAAP, IFRS
financial books: rule setter?
in the U.S: SEC/FASB
financial books: example?
annual report
management books: audience?
management
management books: objective?
facilitate management decisions
management books: rules?
none
management books: rule setter?
management
management books: example?
budgets, product profitability
service companies
provide services; do not carry inventory
merchandise companies
buy and resell inventory to customers
manufacturing companies
buy raw material which they convert to a finished product and offer for sale to customers
managerial accounting
provision of accounting information for a company’s internal users of information (managers at all levels)
financial accounting
focuses on EXTERNAL users of financial info (owners, creditors, tax authorities and regulators)
financial accounting
emphasizes past activities (uses historical info)
financial accounting
emphasizes objectivity, precision, and verifiability
financial accounting
emphasizes company wide reports
financial accounting
MUST follow GAAP/IFRS (required formats: financial statements, required timing for reports)
financial accounting
MANDATORY for external reports
managerial accounting
reports to managers INTERNAL To the organization (to assist with planning, control and decision making)
managerial accounting
emphasizes decisions affecting the future
managerial accounting
emphasizes relevance
managerial accounting
emphasizes relevance
managerial accounting
emphasize timeliness — no required timing for reports; provide to managers as needed
managerial accounting
emphasize segment reports (product lines, geographic territories or departments)
managerial accounting
need not follow GAAP/IFRS — NOT mandatory
goal of managerial accounting
helps managers carry out their basic functions
planning
establishing goals and objectives and identifying ways to achieve them (example: preparing budgets)
controlling
monitoring and ensuring the proper implementation of plans (example: performance evaluation)
decision making
selecting the best course of action among competing alternatives (which product lines to offer, what price to charge? who is our target market? how should we execute?)
skills that managers need
big data management skills
an ethical perspective
strategic management skills
enterprise risk management skills
a corporate social responsibility perspective
process management skills
leadership skills
cost object
anything for which cost data are desired, including products, customers, jobs, organizational subunits, etc.
ex: product line, geographic region
cost object
to determine if a cost is indirect or direct, you must identify..
direct cost
costs that can be easily and conveniently traced to a specificed cost object
this cost is CAUSED by the cost object
ex: customer order - materials used to produce the order
indirect cost (“common cost”)
costs that cannot be easily and conveniently traced to a specified cost object (may be allocated)
ex: a CEO’s salary to multiple different divisions or prodcut lines
product cost
includes all costs required to purchase or manufacture inventories
product cost: for a retailer
includes cost of purchasing inventory
product cost: for a manufacturer
includes all costs required to manufacture inventories
3 broad categories of PRODUCT cost (aka manufacturing costs)
DM, DL, OH (direct material, direct labor, manufacturing overhead)
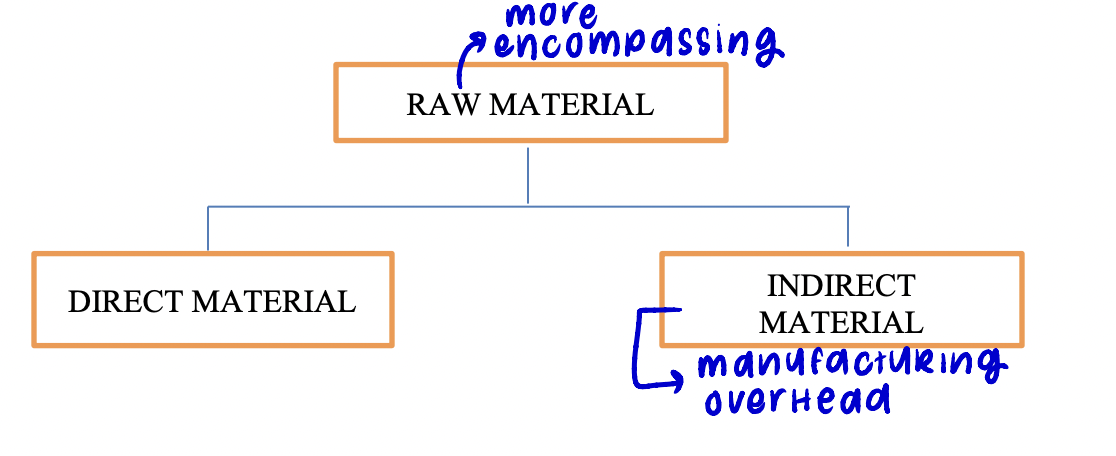
direct material
raw material that becomes an integral part of the finished product and whose costs can be conveniently traced to it
can be natural resources or parts purchased from another company
ex: t-shirt manufacturer: fabric, cotton
raw material
refers to any materials that go into the final product and includes both DIRECT and INDIRECT materials
direct labor
labor costs that can be easily traced to individual units of product (aka “touch labor”)
ex: t shirt manufacturer: swing machine operators, “assembly line”
factory labor includes..
direct and indirect labor
manufacturing overhead
includes all manufacturing costs EXCEPT direct materials and direct labor; these costs can NOT be easily traced to specific units produced (also called indirect manufacturing cost, factory overhead, and factory burden)
manufacturing overhead
includes INDIRECT MATERIAL used in production - materials that are relatively insignificant to the product, not worth tracing to each unit so are treated as part of manufacturing overhead
ex of INDIRECT MATERIAL: t shirt manufacturing: dye, needles, thimbles, thread
manufacturing overhead
includes INDIRECT LABOR - factory labor that is difficult to trace to each unit so it is included as part of manufacturing overhead
ex of INDIRECT LABOR: factory maintenance, factory supervisors, factory janitors
other examples of manufacturing overhead
maintenance and repairs on production equipment, heat and light, property taxes, depreciation, insurance, on manufacturing facilities (that are related to operating the factory)
treatment of product costs
assign to inventory as incurred; expense through COGS when inventory is sold (i.e, in accordance with the matching principle)
period costs (“nonmanufacturing costs” or “selling + administrative costs”)
includes selling costs, administrative costs
selling cost (period cost)
includes all costs necessary to secure customer orders and get the finished product into the hands of the customer
ex: shipping to the customer, price tags, advertising, sales salaries
administrative cost (period cost)
includes all executive, organizational, and clerical costs associated with the general management of an organization
ex: clerical wages, CEO’s salary, VP’s salaries
other selling, general & administrative expenses
such as rent, insurance, depreciation, property taxes, etc. on selling and administrative facilities (R+D costs)
treatment of perid costs
EXPENSED in the period incurred (or allocated among periods benefitted for costs such as prepaid rent, supplies or depreciation)
cost structure
refers to the relative proportion of each type of cost in an organization
cost behavior
refers to how a cost will react to changes in the level of activity — understanding cost behavior facilitates planning and controlling
activity base (cost driver)
measure of what causes variable costs to change (such as units produced, units sold, labor hours, number of customers, etc)
relevant range
operating range over which a firm finds it practical to operate in the short run (more practical)
it is the range of activity within which the assumptions made about cost behavior are valid
the relevant range of activity pertains to fixed cost as well as variable costs
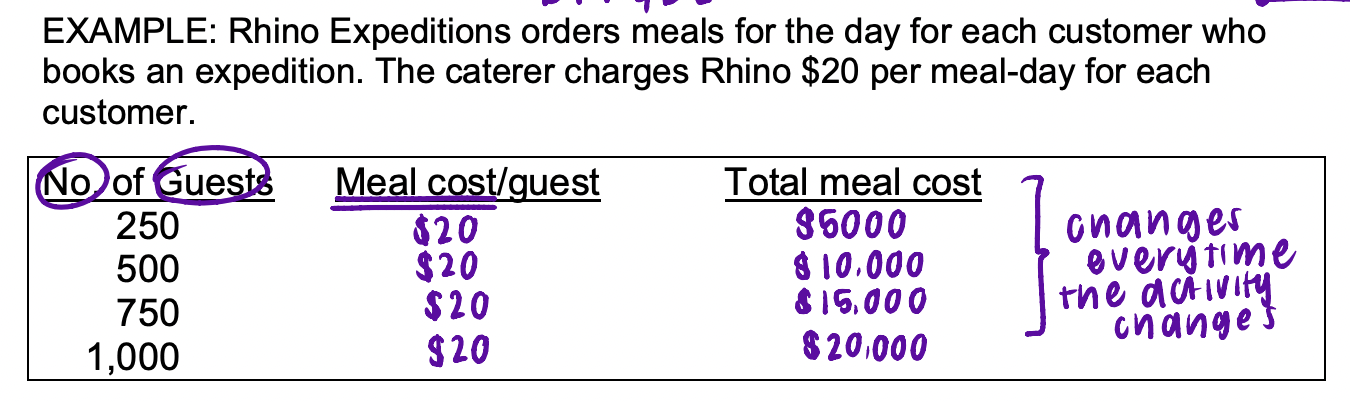
variable cost (VC)
a cost that varies, in total, directly and proportionally to changes in the level of activity
IN TOTAL: varies in direct proportion to activity
PER UNIT: remains constant
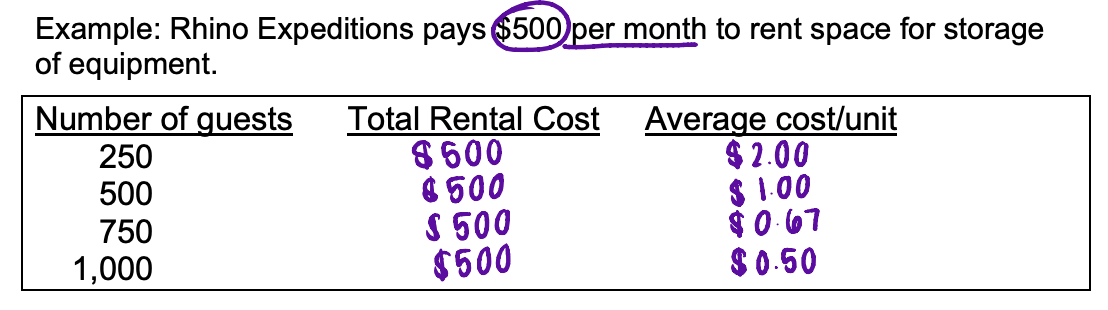
fixed cost
a cost that remains constant, in total, regardless of changes in the level of activity
total fixed cost REMAINS constant as activity changes
the fixed cost PER UNIT varies inversely with changes in activity
committed fixed costs
represent investments with a multi-year planning horizon that cannot be easily adjusted in the short term
ex: CEO’s salary, production manager, rent insurance, etc (facilities)
discretionary fixed costs
usually arise from annual decisions by management and they can be easily reduced in the short term
ex: R + D, advertising, training programs
mixed costs
a cost that contains both variable and fixed elements (also called “semi-variable costs”)
mixed cost
the fixed portion is constant (in total) regardless of the level of activity and the variable portion will vary in direct proportion to activity
equation: y = mx + b
total cost = [VC/unit of activity * activity] + FC
![<p>the fixed portion is constant (in total) regardless of the level of activity and the variable portion will vary in direct proportion to activity</p><p>equation: y = mx + b</p><p>total cost = [VC/unit of activity * activity] + FC</p>](https://knowt-user-attachments.s3.amazonaws.com/714bd2ed-3d04-43b8-9e0a-7c14488d20a9.png)
the traditional approach
separates product costs from selling and administrative expenses as required for external reporting purposes
traditional format
Sales
Less: COGS (product costs)
= Gross Margin
Less: Selling & Administrative Expenses (period costs/operating expenses)
Net Operating Income (NOI)
two ways to compute COGS
(1) number of units sold * unit cost
(2) COGS = beginning inventory + purchases - ending inventory
problem with the traditional format
required to be used for external reporting purposes
method does not distinguish between variable and fixed costs
contribution margin approach
separates costs into FIXED and VARIABLE categories and computes a contribution margin, emphasizes cost behavior which is important to managers
contribution appraoch is used as..
an internal planning and decision making tool (aids cost-volume profit analysis, performance evaluation, and budgeting)
contribution margin format
Sales
Less: Variable Costs (Product & Period)
= Contribution Margin
Less: Fixed Costs (Product & Period)
= Net Operating Income
financial statement analysis
a set of tools used to make the general purpose financial statements more useful to varied users of financial information
3 basic tools of analysis
1) horizontal analysis
2) vertical analysis
3) ratio analysis
limitations of financial statement analysis
for meaningful analysis, common-size data and the ratios for a company should be compared with a standard:
past history of the company: comparing the value of a ratio over time allows trends to be assessed
similar company
industrial averages
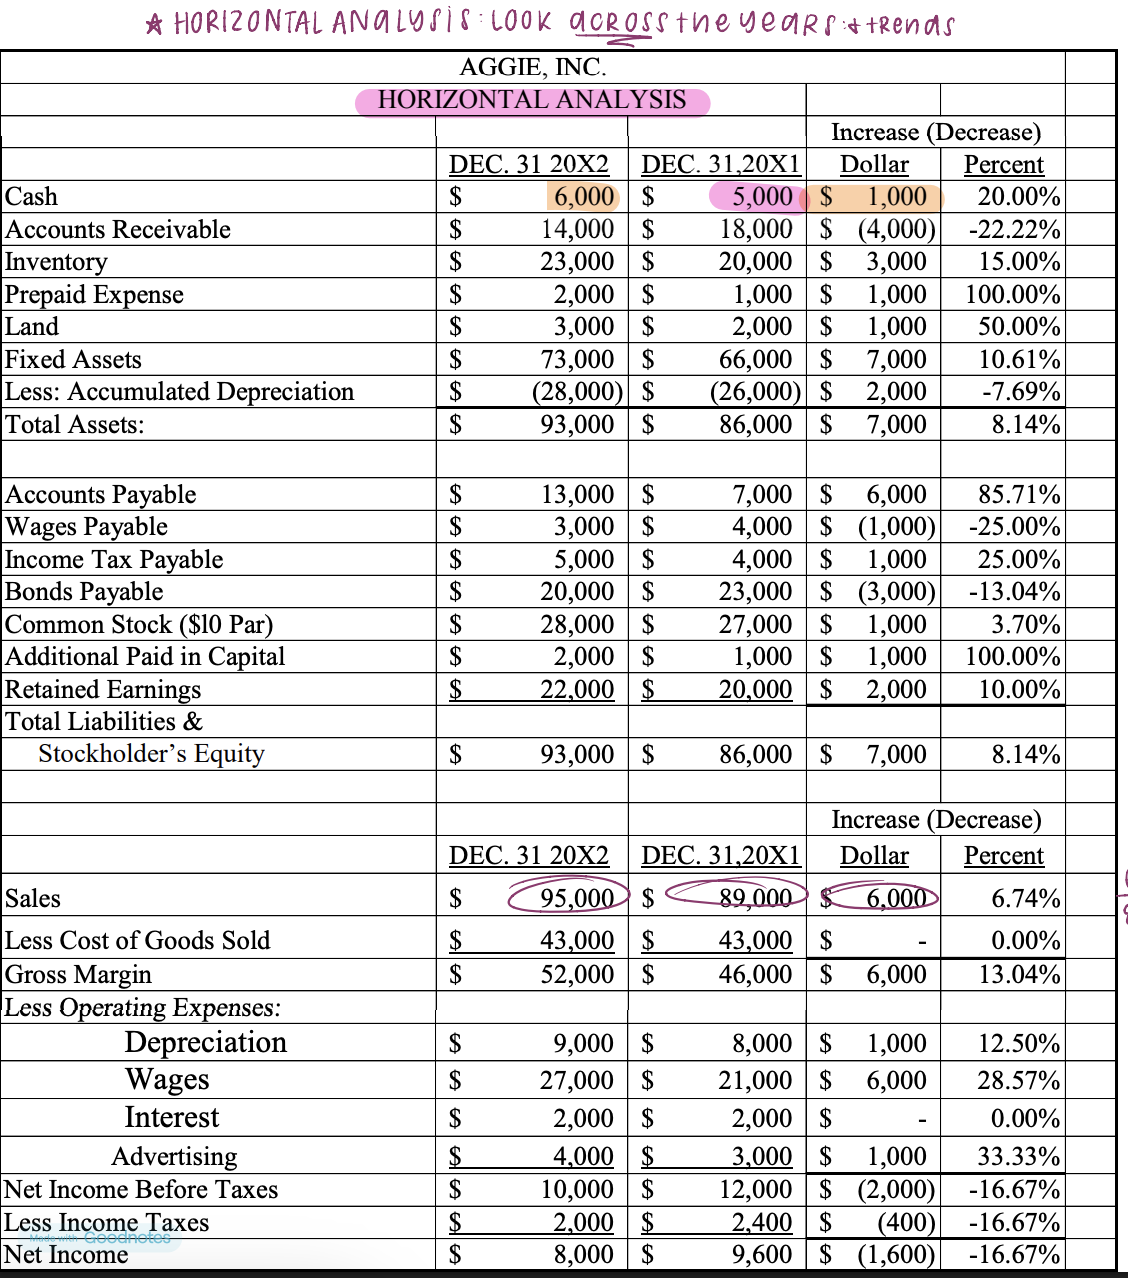
horizontal analysis (dollar & percentage changes)
focuses on the dollar and/or percentage changes in accounts on the income statement and/or balance sheet from year to year
facilitates identifying trends over time
can be shown as a percentage of the base year of percentage change
horizontal analysis
looks across the years and trends
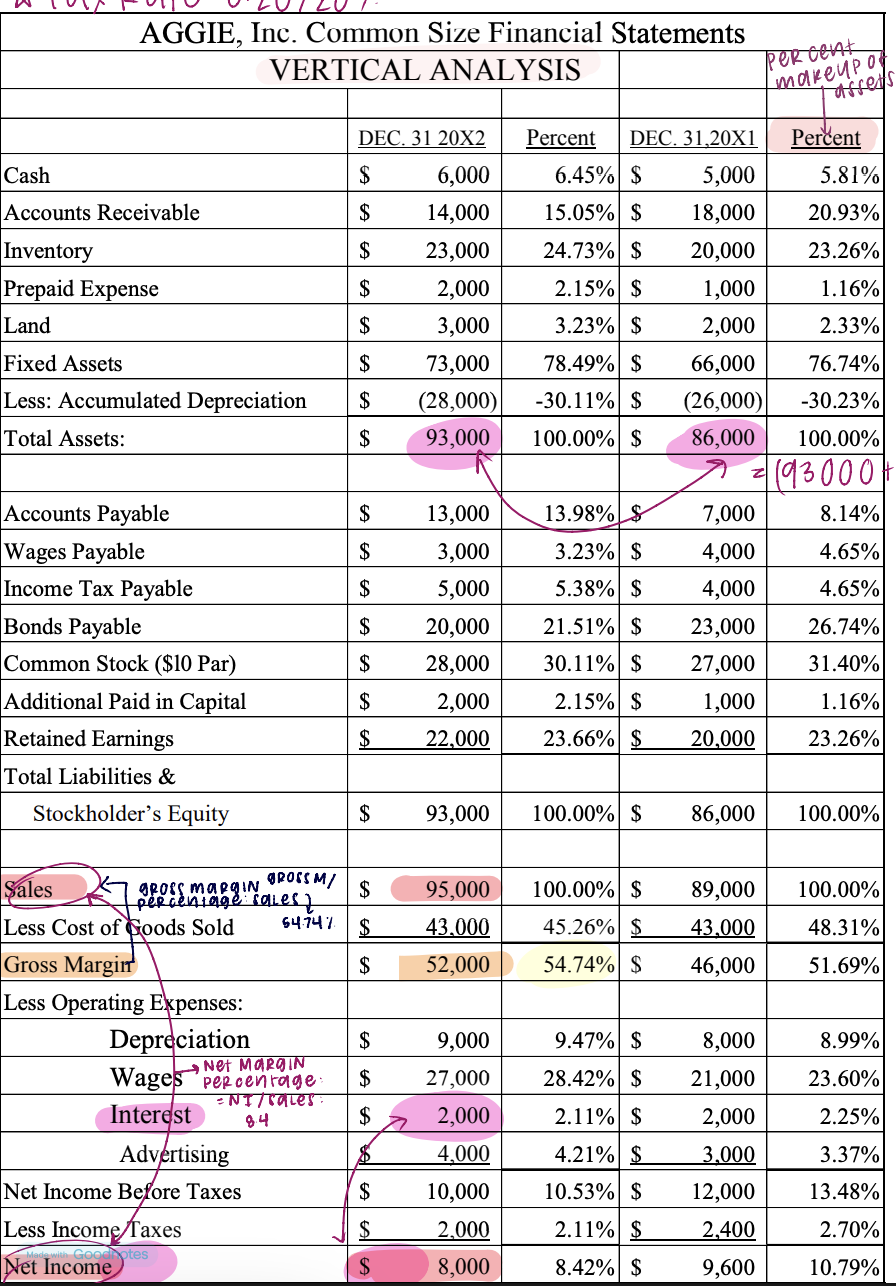
vertical analysis
used to evaluate the relationships within a single financial statement, compares to prior years/other companies
exxpresses each item within financial statement as a percent of a selected item on the statement
vertical analysis formula: BALANCE SHEET
expressed as a percentage of total assets.
formula: account balance / total assets
vertical analysis formul
expressed as percentages of net sales
formula: account balance / net sales
ratio analysis
ratios express the mathematical relationship between two or more financial variables
ratios can be used by managers to assess:
1) liquidity
2) profitability
3) debt management
4) asset management
5) market performance
ratio analysis — assessing liquidity
liquidity ratios provide a measure of a company’s ability to meet current obligations in a timely manner (working capital, current ratio, acid-test quick ratio)
working capital
a widely used general measure for evaluating: do we have enough CA to pay for our CL?
= CA - CL
current ratio
a widely used general measure for evaluating a company’s ability to pay short term liabilities with current assets
= CA / CL (better to use when companies are different sizes)
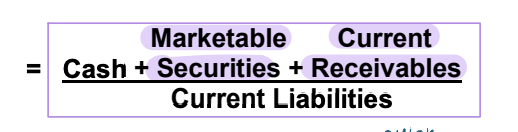
acid-test (quick) ratio
also measures ability to pay short term debt but excludes less liquid current assets
ratio analysis — assessing profitability
provide a measure of the earnings and/or earnings potential of the company (gross margin percentage, net margin percentage, return on total assets, return on equity)
gross margin percentage
provides a measure of the percentage of sales that remain after the cost of inventory is covered
= gross margin / sales
net margin percentage
provides a measure of the percentage of sales that remain after ALL expenses are covered
= net income / sales
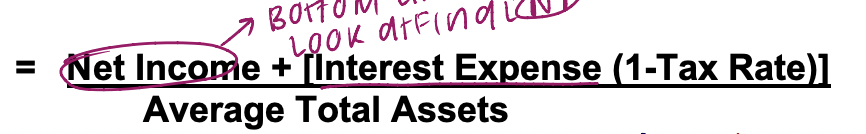
return on total assets
measures the ability of the firm to earn a return on its assets - that is, provides a measure of how efficiently assets are used
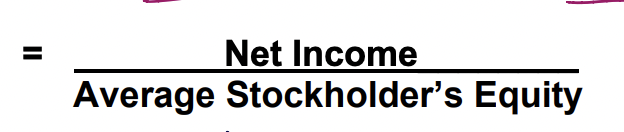
return on equity
measures the ability of the company to earn a return on the stockholder’s investment (how did the company owners’ invest to generate income?)
ratio analysis — assessing asset management
asset management ratios assess how well a company has effectively and efficiently utilized its assets (accts receivable turnover, average collection period, inventory turnover, average sale period)
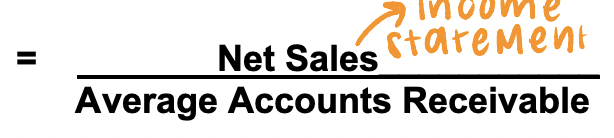
accounts receivable turnover
used to assess the liquidity of the receivables; measures the number of times, on average, receivables are collected during the period
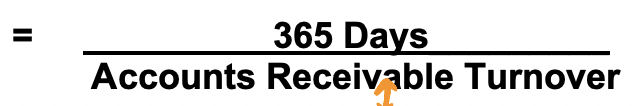
average collection period
a popular variant of the receivables turnover ratio that converts it into an average number of days it takes to collect an account receivable
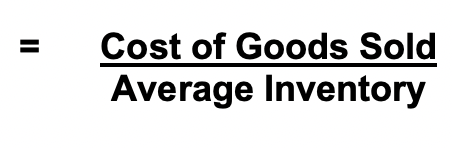
inventory turnover
measures the number of times, on average, the inventory is sold during the period - it indicates the liquidity of the inventory
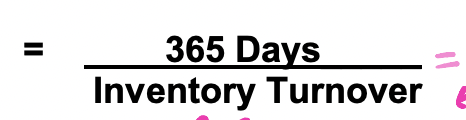
average sale period (in days)
a variant of the inventory turnover ratio - copmutes the average days taken to sell the average inventory balance one time
operating cycle
measures the elapsed time from when inventory is received from suppliers to when cash is received from customers

total asset turnover
measures how efficiently a company’s assets are being used to generate sales
financial leverage
results from the difference in the rate of return a company earns on its assets and the rate of return it must pay its creditors (after-tax)
financial leverage is positive if..
the return on assets exceeds return paid to creditors (i.e, higher than the cost of obtaining capital
financial leverage is negative if
the return on assets is less than the return paid to creditors (i.e, is less than the cost of obtaining capital)