Cultural Geography Test 1
1/50
There's no tags or description
Looks like no tags are added yet.
Name | Mastery | Learn | Test | Matching | Spaced | Call with Kai |
|---|
No analytics yet
Send a link to your students to track their progress
51 Terms
Ptolemy
Cartographer, his maps were used all over the world and were very popular.
T and O Maps
Spiritual maps, not meant for navigation. Shows the path to salvation
Portolan charts
Navigational maps mostly showing regions of the sea.
al Idrisi
Islamic map-maker, updated the Middle East region on Ptolemy’s map
Zheng He
Explorer from China, journeyed all across the Indian Ocean
European explorers
Dias - Around Africa in 1488
Columbus - North America
Da Gama - India
Magellan - Around the World
Cook - Pacific
Environmental determinism
Idea that the environment determines the culture, popular idea in the 1800s
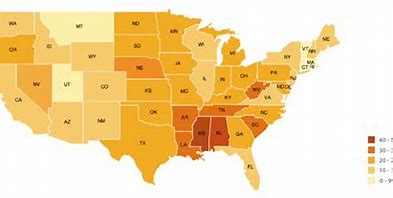
Choropleth Maps
Shades or colors to represent values
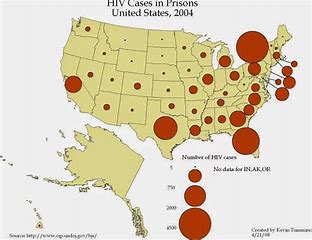
Graduated-circle maps
Various sized circles to show values
Isoline Maps
Lines that connect points to the same value

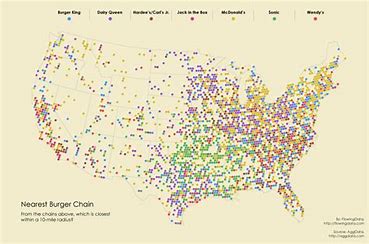
Dot density maps
Uses dots to represent a specified value in a certain area
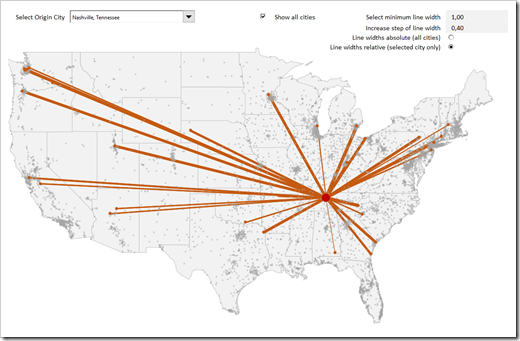
Flow line maps
Uses lines of varying thickness to show direction and quantity
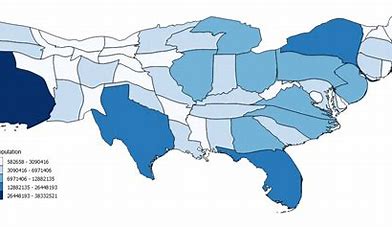
Cartogram maps
Distorts the area of features based on the value of a variable
Types of Regions
formal, functional, perceptual
Formal regions
Identified by mapping one or more human or physical features
Functional regions
They are delineated by a central place or node
Perceptual regions
Also called vernacular regions, based on subjective criteria of individuals
Tobler’s Law
States that things closer together are more alike than things that are farther apart
Types of spatial diffusion
Relocation diffusion and expansion diffusion
Relocation diffusion
Occurs when people move to a new location and take their ideas and possessions with them. The number of people doesn’t change, but where they are used changes.
Expansion Diffusion
Broken down into contagious and hierarchical diffusion.
Contagious Diffusion
when a characteristic spreads from person to person on the basis of proximity.
Hierarchical Diffusion
when something spreads from a person of power and influence
Current world population
8.1 billion
Global population clusters
South Asia, East Asia
Crude birth rate
The amount of people born in an area per 1000
Crude death rate
The amount of people that die in an area per 1000
Population growth rate
Percentage of how fast a population is growing
Total fertility rate
The number of babies being born on average
Infant mortality rates
Amount of babies dying before age 5
Life expectancy
The average expected lifetime
Replacement rate
2.1
Demographic Transition Stages
Stage 1: Low growth
Stage 2: High growth
Stage 3: Moderate growth
Stage 4: Low growth
Stage 5: Low or Zero population growth (ZPG)
Graying of the world population
The average age across the globe is increasing as we are getting older.
Dependency ratios
The number of people who are working vs. the number of people who are not
Demographic dividend
Occurs when a country with previously high birth and death rates transitions to one with low birth and death rates.
Problems with too many young people
Not enough jobs for everyone to work
Problems with too many old people
Not enough people working
Pro-natal policies
Incentives to have children
Disincentives to not having children
Anti-natal policies
One child per couple
Contraception, abortion, and sterilizations free
Ravenstein’s Laws
Most migrants only move a short distance, long distance migrants move to big cities, more women migrate, migration is mostly economic
US immigration over time
Major wave between 1815 and 1851, Ellis Islan opened 1892, most from Eastern and Southern Europe.
Immigration in Europe
Out of 446.7 million, 23.8 million were non-EU citizens
Refugees
Non refoulment. They had many rights including the ability to work, housing, education, public relief and assistance, and freedom of religion
Push and Pull factors
Push factors are to push you out and pull factors draw you in
Race
Divided into distinct groups based on inherited physical and behavioral differences
Ethnicity
Refers to people with the same national, racial, or cultural origins
US census changes
Started out as just white or black. Now, there are many choices that provide a lot more depth.
Do all countries gather census data?
No
Location Quotient
Value above or below 1. Proportion of ethnic group in census tract divided by the total population of the area.
Redlining
Neighborhoods outlined based on how good or bad. Loans are given according to redlining.