Consumer & Producer Surplus
1/8
There's no tags or description
Looks like no tags are added yet.
Name | Mastery | Learn | Test | Matching | Spaced | Call with Kai |
|---|
No analytics yet
Send a link to your students to track their progress
9 Terms
What is consumer surplus?
The difference between the amount the consumer is willing to pay for a product and the price they have actually paid.
What is producer surplus?
The difference between the amount that the producer is willing to sell a product for and the price they actually do.
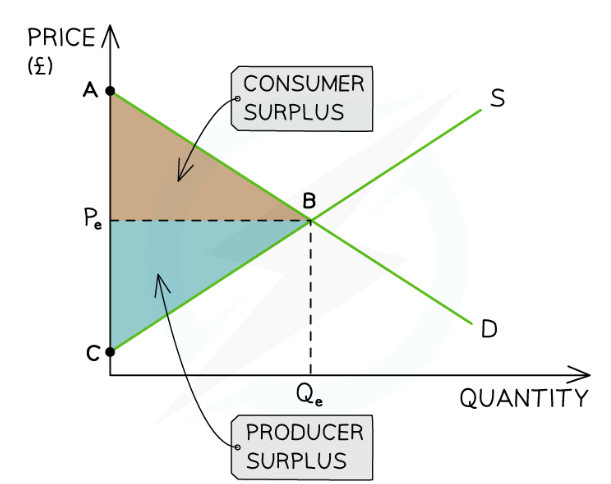
What diagram shows consumer and producer surplus?
The area between the equilibrium price and the demand curve represents the consumer surplus in the market (ABPe)
The consumer surplus lies underneath the demand curve
The area between the equilibrium price and the supply curve represents the producer surplus in the market (CBPe)
Producer surplus lies above the supply curve
When the market is at equilibrium the producer and consumer surplus are maximised
Consumer surplus + producer surplus = social/community surplus
Any disequilibrium reduces the social surplus
How can market changes affect consumer and producer surplus?
Any change to a non-price determinants of supply or demand will cause a shift in the relevant curve
This shift will change the consumer and producer surplus in the market
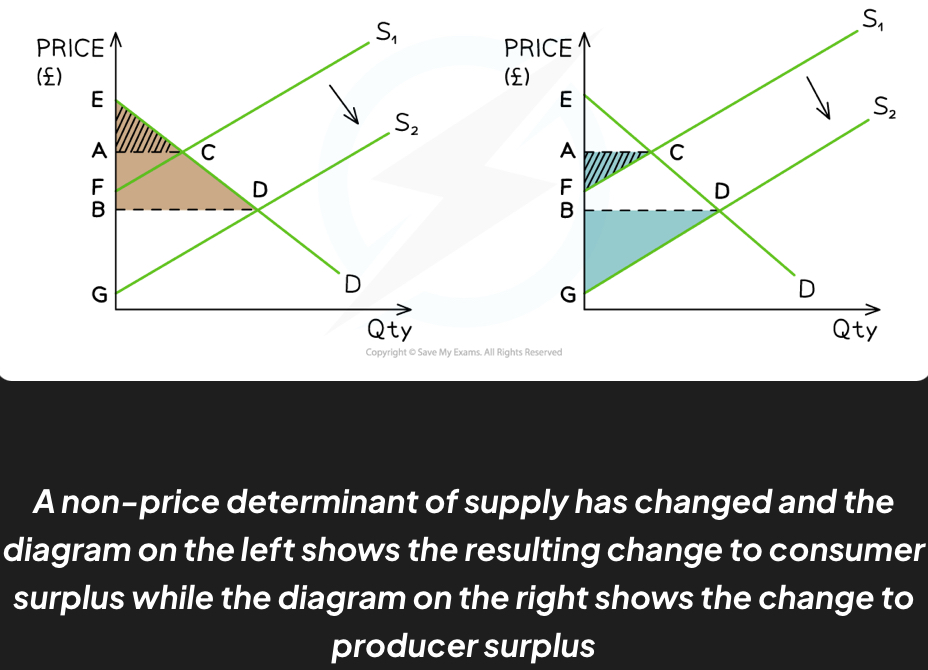
What diagram shows the effect of an increase in supply on consumer and producer surplus?
Prior to the change in supply
Consumer surplus was equivalent to ACE and producer surplus was equivalent to ACF
Social surplus was equivalent to ECF
After the change, supply increased from S1→S2
Consumer surplus is now equivalent to BED and producer surplus is equivalent to BDG
Social surplus is equivalent to DEG
Both the consumer surplus and producer surplus have increased as a result of the increased supply in the market
What diagram shows the effect of an increase in demand on consumer and producer surplus?
Prior to the change in demand
Producer surplus was equivalent to ACE and consumer surplus was equivalent to ACF
Social surplus was equivalent to ECF
After the change, demand increased from D1→D2
Producer surplus is now equivalent to BED and consumer surplus is now equivalent to BDG
Social surplus is equivalent to DEG
Both the producer surplus and consumer surplus have increased as a result of the increased demand in the market
How can consumer and producer surplus be calculated from a diagram?
(b x h) / 2
The following steps should be applied to each calculation
Identify the current equilibrium price
Draw a horizontal line from it to the Y axis
Ensure that both the demand and supply curves pass through the Y axis so as to complete the two surplus triangles
Using the formula, calculate the producer surplusfrom the triangle which lies below the equilibrium price (area above the supply curve)
Using the formula, calculate the consumer surplusfrom the triangle which lies above the equilibrium price (area beneath the demand curve)
What is allocative efficiency?
Occurs at the level of output where the marginal benefit = marginal cost
At this point, resources are allocated in such a way that consumers and producers get the maximum possible benefit
No one can be made better off without making someone else worse off
There is no excess demand or supply
What is productive efficiency?
Occurs at the level of output where average costs are minimised
There is no wastage of scarce resources and a high level of factor productivity