Stats Exam 1
1/61
Earn XP
Description and Tags
Name | Mastery | Learn | Test | Matching | Spaced | Call with Kai |
|---|
No study sessions yet.
62 Terms
Numeric/Quantitative
Consists of numbers representing counts or measurements. These data types can be further classified into discrete and continuous variables.
Continuous
When the data can have infinitely many numeric values, where the collection of values is not countable, and can include fractions or decimals.
Discrete
When the data values are numeric and the number of values are countable/finite.
These values often represent whole numbers, such as counts of items or occurrences.
What is an example of a Discrete data measurement
Number of bananas in a bowl
Categorical/Qualitative
Data that consists of names or labels such as Gender, Traits and Names of places on Earth
(They can’t be numbers representing counts or measurements)
Nominal
A type of categorical data that represents different categories or groups without any intrinsic ordering, such as gender, race, or the names of countries.
Ordinal
A type of categorical data that represents categories with a specific order or ranking, such as levels of education or satisfaction ratings.
An example of a Ordinal Data point is
A satisfaction rating, such as on a scale from 1 to 5.
Population
The entire group of individuals or items that we want to draw conclusions about in a statistical study. (can be infinite or finite)
Sample
A subset of the population selected for analysis in a statistical study, used to make inferences about the larger group.
Sample Size
The number of observations or data points included in a sample, essential for achieving accurate and reliable statistical analysis.
Who is the population and the sample in this reading
A research study in 2025 titled “Banana bowl problem solved” talks about the maximum number of bananas a 10 inch diameter bowl could hold. Researchers tested 1000 different bowls filled with various different bananas to find the optimal packing size
The Population is the maximum number of bananas. The Sample is the 1000 bowls
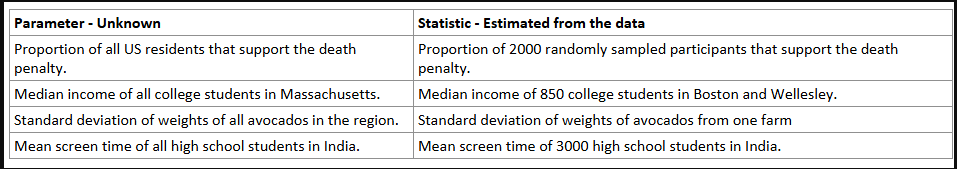
Parameter
A numerical quantity that describes a characteristic of the population.
- This typically talks about everyone, all, or a known fact that doesn’t come from a sample (EX: there are 50 state capitols in the US)
- An example of this would be a proportion of all US residents who support the death penalty
Statistic
A numerical quantity that describes a characteristic of a sample
- This talks about a survey, study, or sample
- An example of this would be talking about a proportion of something, not all
Difference between a Parameter and a Statistic
A Parameter is more general with how it sites its info (talks about ALL)
A Statistic is more precise and concrete with it’s estimation (talks about a GROUP of ALL)
An example of the difference is this
Variable
Any characteristics, number or quantity that can be measured or counted.
(In a data set these are the Columns)
Data
Numerical or qualitative descriptions of the objects that we want to study
Experimental unit/Case
Object or thing that is being tested on/ having data collected
These are generally the Rows in a data test
Simple Random Sampling
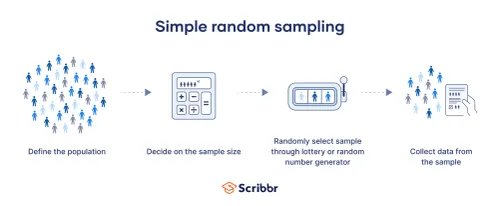
A type of sampling that consists of a random amount of individuals that have an equal chance of being selected
- Lottery method
- RNG
Stratified Sampling
A type of sampling that involves dividing a population into similar subgroups (called strata) then randomly selecting samples from each stratum
Cluster Sampling
A type of sampling where a population is divided into groups, then a random selection of these groups are chosen and all get sampled
Systematic Sampling
A type of sampling where the sample members from a population are chosen via selection in a fixed interval
- Example: Select every fourth dog on a park (This is called the sampling interval, calculated by dividing the population size from the desired sample size)
What is the difference between a Experimental Study and a Observational Study?
In a Experimental Study, the researcher manipulates a certain factor or treatment
In a Observational Study, the researcher can only watch without making their sample do things they want
What are the cons of an Observational Study?
Randomization
Experimental units are assigned to random treatments by chance
This is good because it reduces confounding and bias
Difference between being in a Control group and not
The major difference comes in who receives the treatment
Those not in the Control group receive the treatment, while those who are do
Placebo
A treatment that lacks the active ingredient of the treatment being tested
This is used to see the reaction of those who took it vs those who didn’t
Blinding
Participants are not told which treatment they are receiving
This helps reduce bias
Explanatory Variable
The variable that is changed or manipulated by the researcher to observe its effect on an outcome variable.
- It is also known as the independent variable.
- Example: In a study on the effect of fertilizer amount on plant growth, the amount of fertilizer is the explanatory variable.
Confounding Variable
A variable in a study that is related to other variables, affecting the relationship between those variables
- Example: Ice cream sales are associated with drowning
Confounding Variable problems
False reasons for why something is happening
Summer heat = more ice cream sales and drowning is valid
Ice cream sales = more drowning is not valid because Ice cream sales going up doesn’t mean drowning will be more relevant
Lurking Variable
A variable that is not the explanatory or response variable but has a relationship with both
- Example: A scientist studies the effects of a diet and exercise on a person’s blood pressure. The lurking variable that can affect blood pressure are whether a person smokes or is stressed
Selection bias
When some groups are left out of the processes in choosing the sample
Nonresponse
When an individual for a sample isn’t contacted or refuses to participate
Response bias
A systematic pattern of incorrect responses
An example of this Wording of a question (How Amazing was your stay?)
Response Variable
The variable that is measured or observed and is expected to change in response to the manipulation of the explanatory variable.
- It is also known as the dependent variable.
- In a study on the effect of fertilizer amount on plant growth, the plant growth is the response variable.
Block Design
A technique used in experimental designs to reduce the impact of variability by grouping similar cases together
Variation
The primary reason for using blocking when designing an experiment to reduce
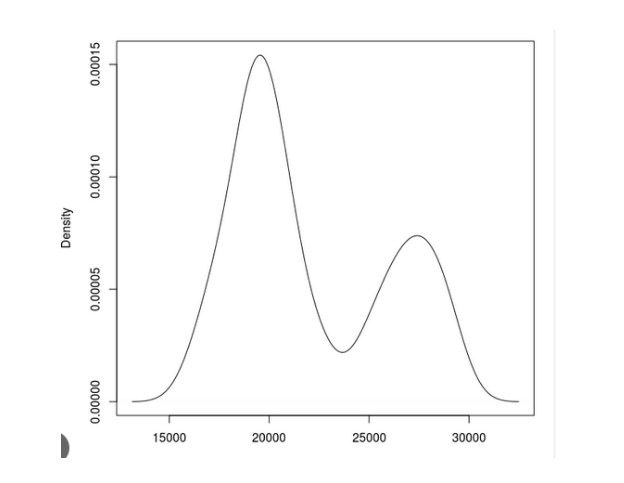
Bimodal
Describes a distribution of values that has two individual centers of population
Mean
The average value of all the data
Calculated by adding all the data then dividing it by the number of data points
Median
The midpoint of the distribution
(n+1)/2
How to find the Median
If the number of data is odd
1. The median is the center of the ordered list
2. It will be a whole number3. (n+1)/2 is the position of it
If the number of data is even
The median is the average of the two center observations of the ordered list
Will likely not be a whole number
Between n/2 and (n+1)/2 is where it’s located
Quartile
From Min to Max
Min is the minimum value
Q1 is 25% of the data, position is located on the data by calculating (1/4) * (n+1)
Q2 is 50% of the data, also known as the median
Q3 is 75% of the data, position is located on the data by calculating (3/4) * (n+1)
Max is the maximum value
Interquartile range (IQR)
The spread of half your data
Calculated by Q3 - Q1
When to use Mean and Standard Deviation for data
Only for reasonably symmetric distributions that have NO OUTLIERS
When to use Median and Interquartile range for data
When describing a SKEWED distribution or one WITH OUTLIERS
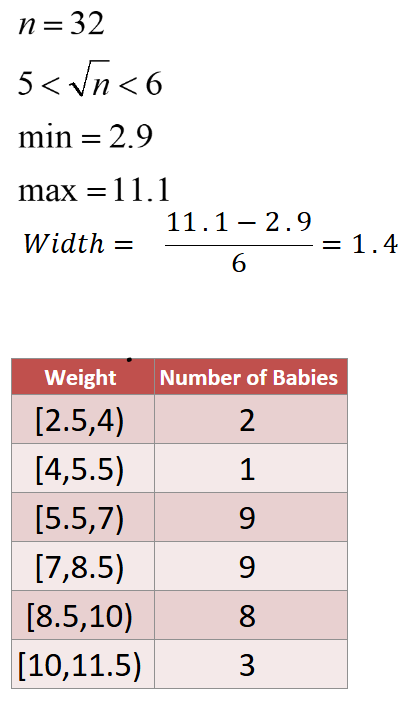
Frequency Table
Creates intervals of values of equal width that cover the all the data along with corresponding frequency in the interval
Class Width
Used in Frequency Tables
Found by calculating (Max - Min)/ n
Make sure to round up or down accordingly to make data cleaner
Histogram
Used to show the distribution of a Quantitative variable by using bars whose height represents the number of individuals
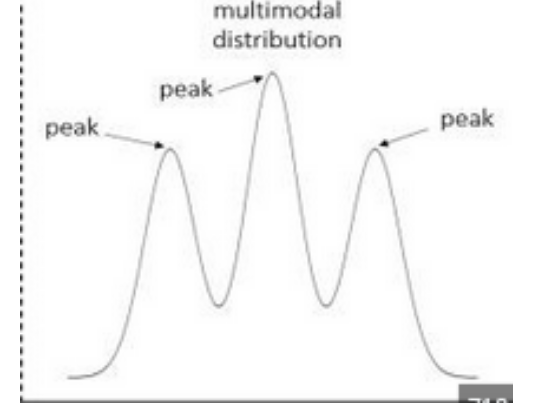
Multimodal
A set of data that has more than 2 values that occur with similar frequency
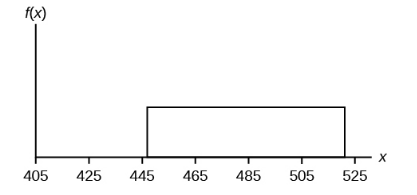
Uniform
A type of probability distribution in which all the outcomes are equally likely
What graphs to use for Quantitative Variables
Frequency Tables/Distribution
Histograms
Boxplots
Stem and Leaf Plots
Dot Plots
What graphs to use for Qualitative Variables
Frequency Tables/Distributions
Bar Graphs
Pie Charts (Don’t actually use)
Frequency
The number of times each category shows up in a data set (for a table)
Relative Frequency
The fraction of times each category shows up in the data set (for a table)
Cumulative Frequency
The total number of observation up to and including that class
Effectively Relative Frequency but you add the previous values to it
Using Mean and Median to find skewed distributions
In a Skewed distribution,
the Mean is usually Farther out in the tail than the Median
Mean out, Median in
Me go out, Med go in
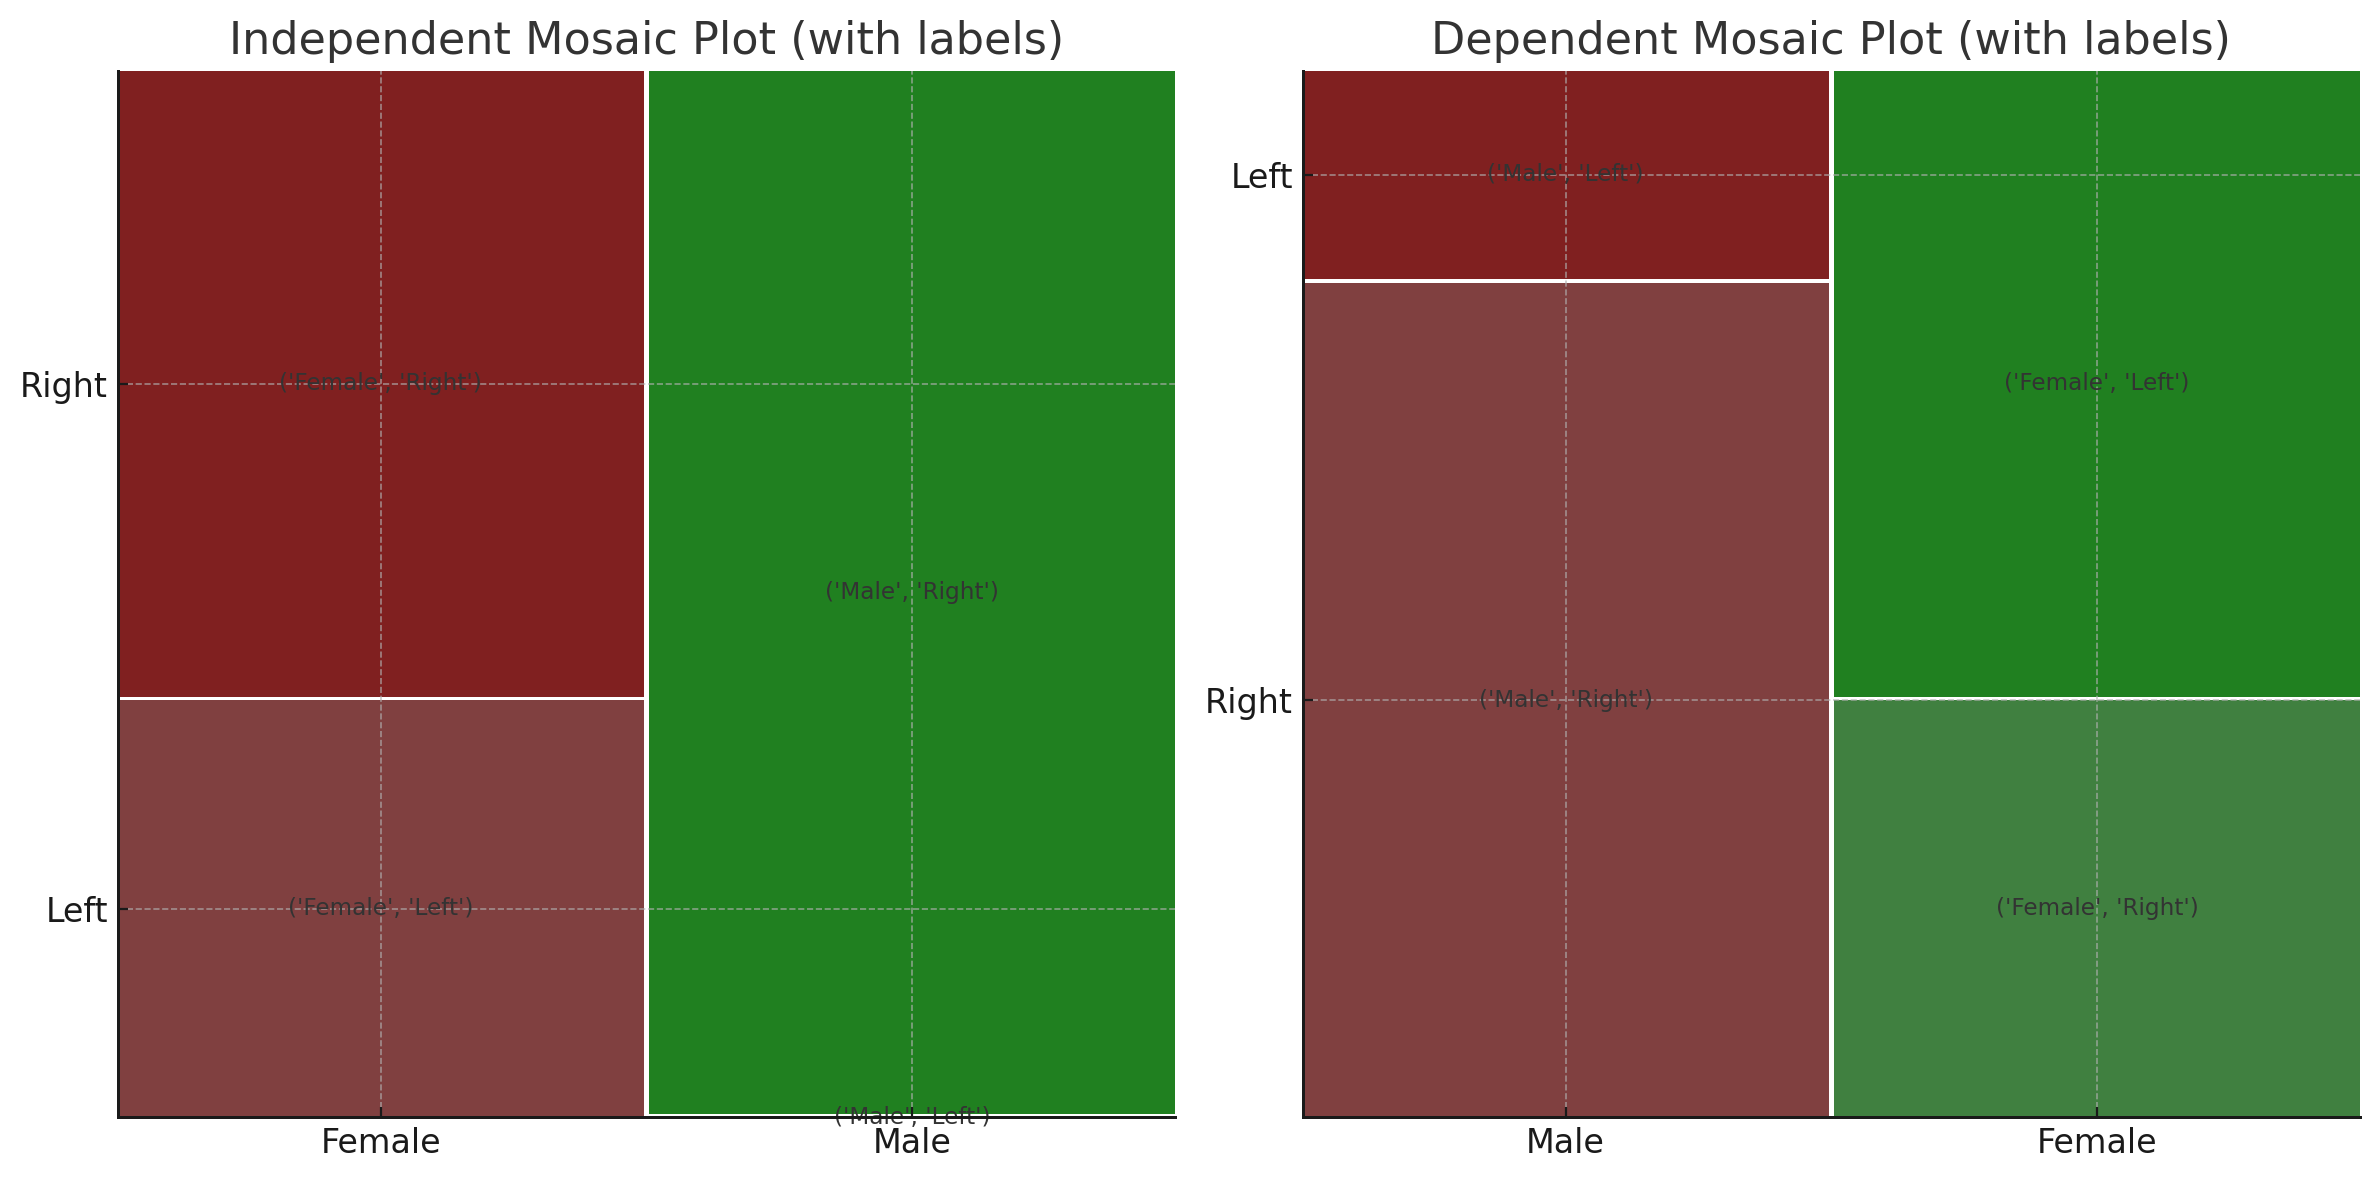
Independent vs Dependent in Mosaic Plots
Independent
When the data lines up well, it’s independent
Dependent
When the data is varied, then it’s dependent
Upper bound
Q3 + 1.5(IQR)
Lower bound
Q1 - 1.5(IQR)
Rule of thumb Upper bound
mean + 2(std dev)
Rule of thumb Lower bound
mean - 2(std dev)