AP Macro Graphs and their Properties
1/39
There's no tags or description
Looks like no tags are added yet.
Name | Mastery | Learn | Test | Matching | Spaced |
|---|
No study sessions yet.
40 Terms
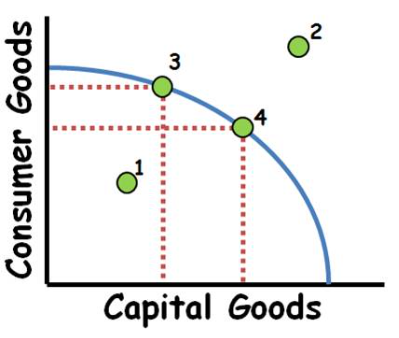
Production Possibilities Frontier/Curve
A graphical representation that illustrates the maximum attainable combinations of two goods or services that can be produced with available resources and technology. It shows trade-offs and opportunity costs.
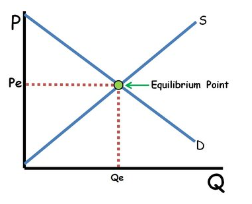
Demand and Supply
The economic model that describes how the quantity of goods demanded by consumers and the quantity supplied by producers determine the market price and quantity of goods sold.
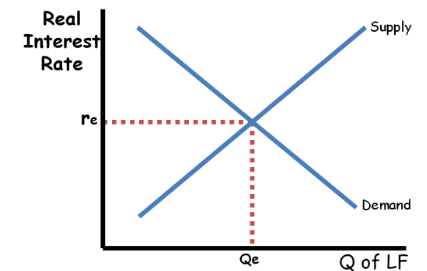
Loanable Funds Market
The market where borrowers seek funds and lenders supply funds, influencing interest rates and overall investment in the economy.
Money Market (Scarce Reserves System)
A segment of the financial market where short-term borrowing and lending of funds occurs, typically involving instruments like Treasury bills, commercial paper, and certificates of deposit. It plays a key role in managing liquidity and interest rates in the economy.

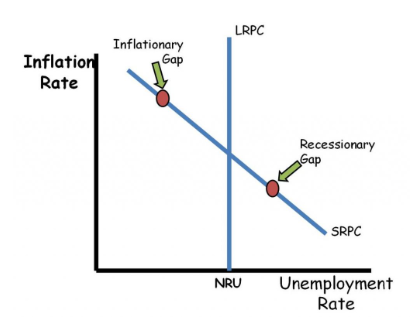
Phillips Curve
A graphical representation of the inverse relationship between unemployment and inflation, suggesting that lower unemployment leads to higher inflation.
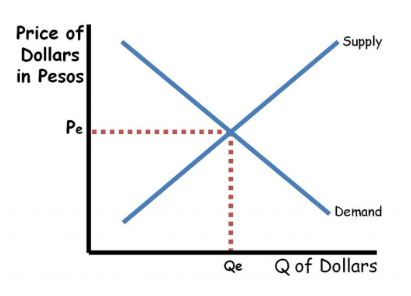
Foreign Exchange Market
The market where currencies are traded against each other, determining exchange rates and facilitating international trade and investment.
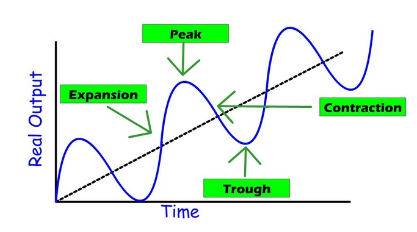
Business Cycle
The natural rise and fall of economic growth that occurs over time, characterized by periods of expansion and contraction in GDP.
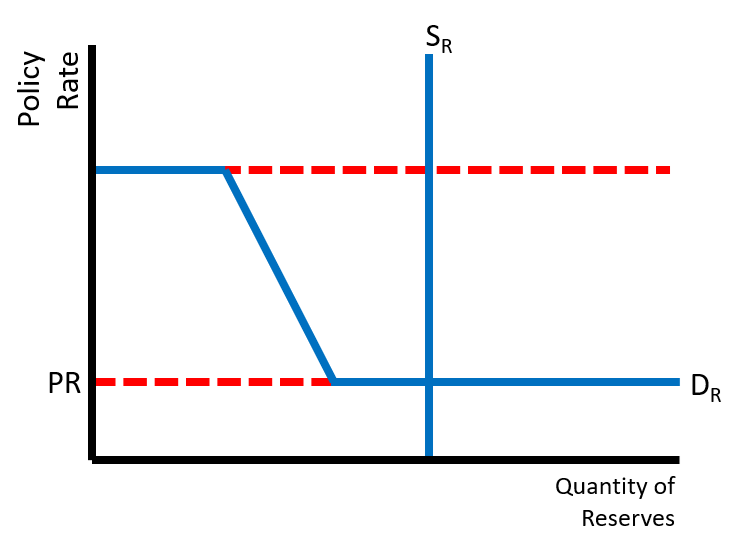
Reserves Market (Ample Reserves System)
A system in which banks hold a substantial amount of reserves, leading to stability in the money supply and interest rates. It allows for efficient liquidity management and enhances the central bank's ability to control monetary policy.
Aggregate Production Function
A mathematical representation that shows the relationship between the total output of goods and services and the quantity of labor and capital used in production.
