ecology exam 2
1/159
There's no tags or description
Looks like no tags are added yet.
Name | Mastery | Learn | Test | Matching | Spaced | Call with Kai |
|---|
No analytics yet
Send a link to your students to track their progress
160 Terms
main points of Desbiez et. al niche partitioning reading
Gause (1934) Paramecium prey & Didnium predators
predators and prey cannot coexist according to the LV model and density-dependent population stability
varied test tube size, timing of release, number of individuals, and the result was always that once the predator is added it starts eating the prey (paramecium), the prey dips down and goes extinct and then the predator eventually starves and goes extinct itself
main points of lima predator-prey reading
lotka-volterra predator prey model examples
adzuki bean weevil- weevil lay their eggs on beans, larvae will burry themselves into beans and the parisitoid Heterospilus will consume th eadult wevils,
lykx and snowshoe hare show cyclic relationship
measles outbreaks in europe also have cyclic relationship before advent of vaccines
sea otter (estes 1979)
predator impact and prey abundance
were hunted to near extinction, 10-30 remained, shellfish increased (sea otter prey), and kelp decreased (shellfish prey). sea otters were protected, about 3,000 now, and shellfish became scarce and kelp abundant
community
a group of species that occur at the same time and place and the interactions that bind them
pair-wise interactions
interactions based on harmed (-), benefited (+), or unaffected (0)
predation
(+, -) pairwise interaction that also includes herbivory and parasitism. occurs when one organism (+) kills and eats another organism (-) for food
herbivory
(+,-), occurs when an organism (herbivore) feeds on plants or animals
parasitism
(+,-), occurs when one organism benefits and the host is harmed
competition
(-,-) interaction that occurs when organisms of the same or diffrent species use an essential resource that is in short supply (ex- limiting resource)
impacts life-history traits
mutualism
(+,+) symbiotic relationship when both organisms benefit
commensalism
(+, 0) symbiotic relationship when one organism benefits and the other is unaffected
amensalism
(-,0) relationship when one organism is harmed and the other is unaffected, assymetric competition
life-history trait
traits related to (lx, bx, e, i, R0, r, k). body size, fecundity, longevity, vigor, sex ratio, age at first reproduction
symmetric competition
(-,-) both organisms are harmed equally by using the same limited resource
asymmetric competition
(-,0) one species is harmed more than the other while competing for the same limiting resource
Gause’s principle (competitive exclusion principle)
species utilizing the same limiting resource cannot coexist
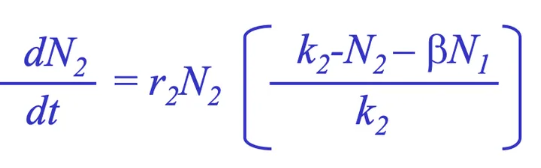
Lotka-Volterra competition model
used to predict the fate of populations in the presence of an interspecific competitor
Lotka-Volterra Competition Model Equation
dN/dt = realized population growth rate of species
r1N1= exponential growth
k1-N1/k1= intraspecific competition
aN2= interspecific competition
Lotka-Volterra competition model graph components
x-axis: time
y-axis: population size (N)
logistic line
k (carrying capacity)
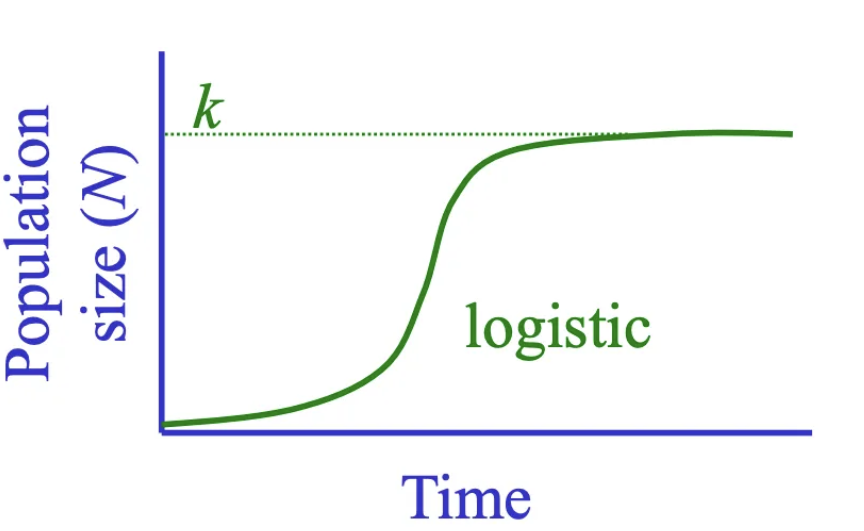
logistic model
the unexcluded species will grow to carrying capacity on a Lotka-Volterra cmopetition model when one species is excluded out of the two
intraspecific competition function
(k1-N1)/k1
represents the fraction of resources still available to individuals of a species as its population grows. scales growth as N (population size) approaches K (carrying capacity).
competition function
(k1-N1-N2)/k1
what percent of resources is left after competition is factored in. contains intra and interspecific competition
competition coefficiant alpha (a)
conversion factor that converts species 2 into equivalent units of species 1 to show how much species 2 affects growth of species 1
if a > 1: species 2 has a stronger negative effect on species 1 than it does on itself
interspecific > intraspecific competition
ex- a12=2: one individual of species 2 has double the competitive effect on species 1 compared to its own species
competition coefficiant beta (B)
conversion factor that converts species 1 into equivalent units of species 2
if B< 1: species 1 has stronger negative effect on itself than species 2
intraspecific > interspecific competition
ex- B = 0.3: one individual of species 1 has 30% of the competitive impact on species 2 as one of its own individuals
corollary
species can coexist if they utilize a limiting resource in a different way (occupy different niches)
niche
relationship of species to all aspects of the abiotic environment
fundamental niche
the activity range over all possible (n) dimensions for abiotic factors
each abiotic variable represents 1 dimension
ex- a barnacle species might be able to live across an entire intertidal zone
niche dimension
an abiotic factor (n) that defines an organisms ecological niche
ex- temperature, habitat type, zon
realized niche
the portion of the fundamental niche that is occupied by a species in the presence of biotic factors
complete qualification is nearly impossible, always varying w age, time, space
ex-competition with another barnacle species and predation from snails restricts it to only the upper zone
what effect can predators, competitors, and mutualists have on the realized nich
predators- negative, diminsh the niche
competitors- negative effect, diminsh the niche
mutualists- positive effects, expand the niche
activity range (=tolerance range)
the span of environmental conditions within which an organism can survive, grow, and remain active
niche breadth (=niche width)
how wide/narrow a species’ niche is along one or more niche dimensions. width/range of resource utilization curve of a species
niche overlap
two or more species use the same resources/environmental conditions along one or more niche dimensions, gause’s competitive exclusioin principle is expected to occur
niche partitioning
the division of a limiting resource by two or more species that share it
competitive release
a species expands its niche (uses more resources or habitats) after a competitor is removed or reduced, allowing its realized niche to approach its fundamental niche.
paradox of competitive exclusion
many closely related species co-occur together and have nearly identical niches. happens due to- species not competing, fluctating environments, evlolve not to compete
character divergence (=character displacment)
evolutionary change in a trait (=character) associated with resource use that reduces the effects of competition
studies of character divergence must
prove species differ in resource use, resource use related to particular trait (=character), trait has genetic basis and can evolve, lack of overlap in resource use today is due to competition in the past
ghost of competition past
lack of competition today could be due to competition in the past
coevolution
process where two or more species reciprocally influence each others evolution through selective pressures, often in predator-prey / host-parasite
allopatry
populations of the same species live in separate geographic areas. occurs when populations are geographically isolated, preventing competition between them.
In isolation, species may undergo competitive release, often evolving changes in niche breadth as they adapt to their separate environments
sympatry
occurs when populations or species live in the same geographic area, so they can interact and potentially compete. species coexist in the same area, which can restrict niche breadth due to competition.
If niches overlap, competitive interactions may occur, limiting resource use compared to populations that experience competitive release in isolation
three things competition affects
species distribution, abundance, evolution
Why do introduced species appear to be so damaging to native species
the species haven’t coevolved with the native species so they overlap broadly with the niches of th einvasive species and they either go extinct or do evolution to reduce negative effects of competition
how to experimentally test whether competition is occurring between species
remove a competitor and see what happens (fitness improved, competitive release, expanded niche) or add a species (negative fitness effect on species, niche partitioning, evolve reduced competition)
trophic level
position an organism occupies in the food chain such as producer, consumer, etc, depending on how it gets energy
nonlethal predator effects
presence of predators can cause behavioral, morphological, or physical changes in prey that often come at fitness cost. response that reduces predation risk
ex- lima 1998, rodents avoid foraging in open habitats, insects develop wings faster, faster development time in tadpoles
chemical defense
adaptation to reduce predation: poision ivy, milkweeds, bombardier beetles, specific frogs
adaptations to reduce predation
chemical defenses, warning coloration, immunological defense, crypsis (camoflauge), mimicry, behavioral defenses, group living, aggregation in time
warning coloration
adaptation to reduce predation: coral snake, brightly colored poison dart frog
Batesian mimicry
a palatable or harmless species mimics an unpalatable or harmful model
ex- 40 species of Heliconius butterflies feed on toxic plants in the genus Passiflora, central American coral snakes
Müllerian mimicry
two or more unpalatable (tastes bad) species resemble each other
ex- louisiana stinging wasps
crypsis
adaptation to reduce predation: camoflauge
ex- grasshopper, giant leaf insect, walking stick, treehopper
group living
predator confusion, group vigilance, group defence. adaptation to reduce predation
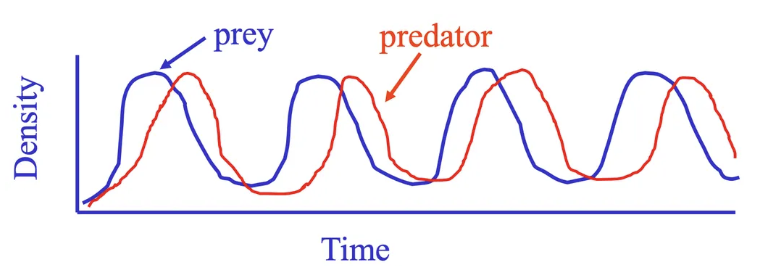
Lotka-Volterra predator-prey model
predict how abundances will fluctuate overtime and assess wheether predators and prey can coexist in a stable equilibrium.
x-axis: time
y-axis: density
Lotka Voltera Predator Prey model
prey equation (P)
exponential growth: dP/dt=rP
rP→ realized population growth rate of the prey
measure of prey population growth rate on per capita basis
encounter rate
frequency at which two species (predator and prey) come into contact within a given time period
P x C
P= prey
C= predator
efficiency of predation (a’)
probability that the prey will be killed and eaten when encountered
if a' = 1 : predator always kills and eats prey following attack
if a’ < 1 : some prey escape the attack
exponential growth (LV predation model)
prey population grows exponentially in the absence of predators, described by the dP/dt = rP. predators limit this growth through predation, modeled by a’PC
r is the intrinsic growth rate. a’ is the predation rate, P=prey C=predators
if C=0 (no predators), the model simplifies to the exponential growth model
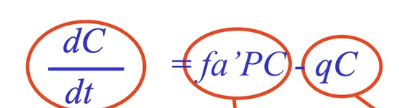
predator equation
realized growth rate of predator population = predators are added ot the population through births - predators are removed from the population through deaths
dC/dt= births-deathsf= efficiency of prey conversion to offspring
q= death rate/individual

Lotka-Voltera predator-prey equation
realized populaiton growth rate of prey = exponential growth of prey - prey losses due to predation
limit cycles
regular, repeating fluctuations in predator and prey populations over time. in the Lotka-Volterra model, predator and prey populations can oscilate into cycles around an equilibrium, with neither going extinct.
driven by interactions between prey availibility and predator numbers
neutral stability
occurs when a population system, like the Lotka-Volterra predator-prey model cycles endlessly around an equilibrium without returning it or diverging away. populations continue with constant amplitude, meaning small disturbances neither grow or shrink over time
disturbance
temporary change in environmental conditions that disrupts population size or community structure. can alter predator-prey dynamics, resource availibilty, ecosystem stability
ex- storms, fires, human activity
equilibrium
the density at which populaiton remains in the absence of disturbance
a stable population will return to this state following a disturbance.
stability
when predator and prey populations return to equilibrium after disturbance. basic lotka-volterra model shows neutral- populations cycle endlessly around equilibrium without converging
real ecosystems include density dependence or carrying capacity (k) which makes them stable (dampened cycles) or unstable (cycles grow)
density-dependent reproduction
birth rate changes with populaiton density. as population density increases, resources become limited leading to lower reproductive rates. helps regulate population size and stabilize growth over time
density-dependent growth
an organisms growth rate decreases as population density increases. happens because individuals compete for limited resources and helps to regulate populaiton size and prevents exponential growth
density-dependent emigration
occurs when individuals are more likely to leave a population as its density increases. high populaiton density can lead to competition for resources, crowding, stress. helps reduce population pressure and stabilize density
density-dependent mortality
death rate increases as poulation density increases. factors like disease, competition, and predation become stronger at higher densities causing more deaths. negative feedback mechanism that helps regulate population size
regulation
processes that keep a population size within certain limits over time. occurs when birth and death rates change with population density
dampened oscillations
predator and prey population cycles decrease in amplitude over time and stabilize at equilibrium. occurs when density-dependent factors reduce fluctuations
predator functional response
relationship between prey density and number of predators eaten/predator/time.
number of prey eaten per predator per day (y) increases as prey density increases (x)
3 types- type 1, type 2, type 3
x axis: prey density
y axis: number of prey eaten per predator per day
predation model conclusions
predict unstable interactions, neutral cycles will inevitably have a disturbance leading to exctinctiion, contrary to natural situatinos where coexistence is the norm
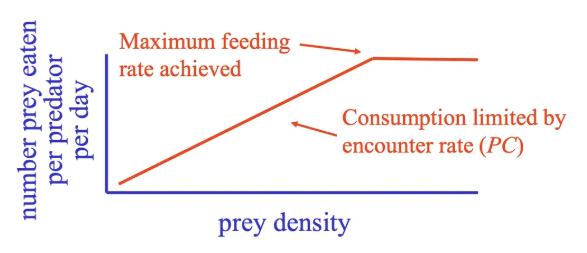
type I predator functional response
consumption limited by encounter rate PC (line), maximum feeding rate is acheived when line begins to level off
tells us that the rate of consumption is constant, used in LV model, very few examples of this in nature
number of prey eaten per predator per day (y) increases as prey density increases (x),
type I predator functional response
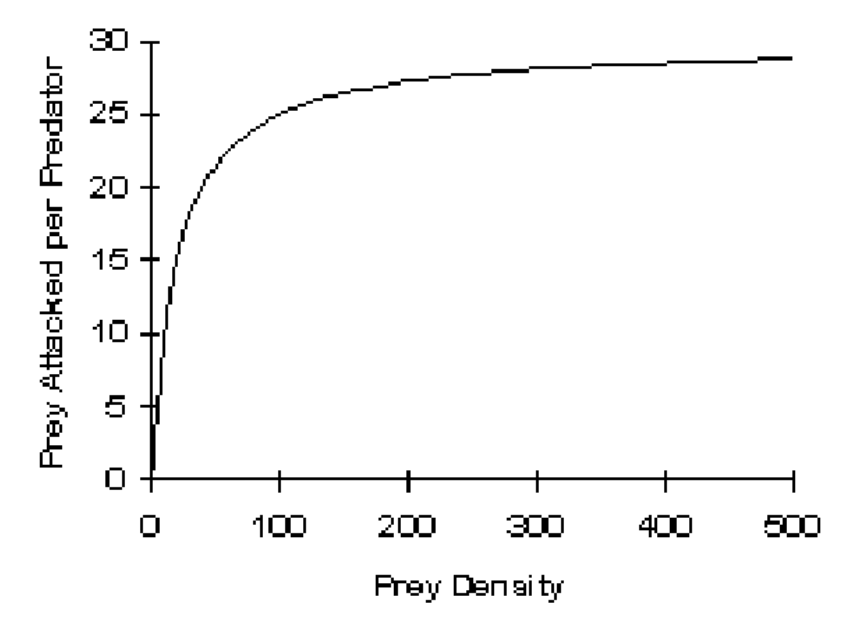
type II predator functional response
curve plateaus much quicker, predators slow down eating prey (rate of consumption is decelerating). plateau is caused by statiation, handling time (time taken to capture and subdue prey once encountered). observed in many animals (ex- moose and plants, squirles and pecans)
number of prey eaten per predator per day (y) increases as prey density increases (x).
type II predator functional response
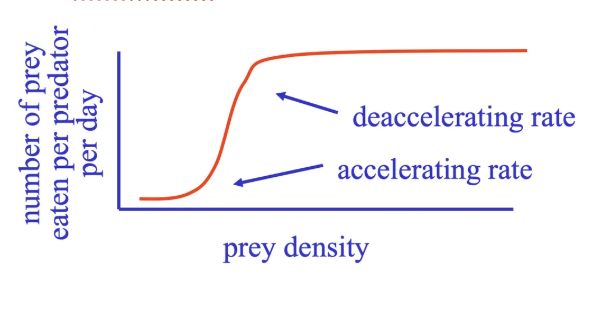
type III predator functional response
rapidly accelerating rate of consumption, then decelerating rate. acceleration in rate of consumption indicates increasing predator efficiency due to learning.
number of prey eaten per predator per day (y) increases as prey density increases (x). (ex- lemmings and long-tailed skuas, aphids and ladybird beetles, higher insects and vertebrates)
type III predator functional response
statiation
occurs when predators have eaten as much as they can, so additional prey are not consumed even if prey density is high. limits maximum predation rate and is a keey factor in functional response, causing the
handling time constraints
the time a predator spends capturing, killing, and consuming a single prey item. limits the maximum rate of prey consumption. key factor in type II and type III functional responses, causing predation rates to level off at high prey densities
learning
an adaptive change in behavior that results from experience. animals elarn and become more efficient
predator aggregation response
occurs when predators concentrate in areas with high prey density. this increases local predation rates and can intensify prey population control, stabilizing prey populations by reducing numbers where prey is abundant
when prey density is low: predators dont aggregate and are inefficient at prey capture, growth in prey population
when prey density is high: predators aggregate and learn to be more efficient, prey population declines
predator interference
interference competition among predators that leads to reduced predation
ex- predator injury, disruption of foraging, predator emigration
when predator density is high: predator interference is high and prey do not get over exploited
prey refuge
location that confers protection from predators. doesnt cause density-dependence in prey and promotes coexistence by allowing some prey to escape predation and prevent extinction.
how is coexistence of predators and prey possible
stabilizing behaviors, refugia for prey, and habitat heterogeneity
habitat heterogeneity
variability in the environment resulting in suitable and unsuitable habitat patches. does not cause density dependence in the prey population. can reduce predator efficiency and stabilize predator-prey interactions by preventing overexploitation of prey
how to determine competition importance
remove competitior A → competitior B should do better (density, b, r, increase & d decreases)
how to determine predation importance
remove predator A → prey should do better (density, b, r increase & d decreases)
disperal
movment of individuals from one area or population to another. can reduce local competition, colonize new habitats, stabilize populations, helping maintain genetic diversity and resilience.
immigration
movement of individuals into a population from another area. can increase population size, add genetic diversity, and help sustain populations
fugitive existence
strategy where a species avoids competition or predation by colonizing temporary or disturbed habitats. the species constantly disperses to new areas rather than competing in stable habitats, allowing them to survive despite being poor competitors.
metapopulation
a group of spatially separated populations of the same species that interact through dispersal.
intraspecific competition
competition between individuals of the same species for limited resources. often leads to density-dependent effects on population dynamicsc
interspecific competition
competition between individuals of the different species for limited resources. often leads to competitive exclusion and niche differentiation
intrinsic rate of increase
(r) maximum per capita growth rate of a population under ideal conditioins with unlimited resources. reflects how fast a population can grow when birth rates are high and death rates are low
dN/dt = rN