econ 1202 quiz study guide
1/25
Earn XP
Description and Tags
Name | Mastery | Learn | Test | Matching | Spaced |
|---|
No study sessions yet.
26 Terms
nominal GDP formula
the average price of goods MULTIPLIED BY the number of goods produced
real GDP equation
nominal GDP / deflator x 100
Interpret:
Deflator in 2018: 114
Prices rose 14% from the base year through 2018
Interpret:
Deflator in 2019: 100
Prices did not change from the base year through 2019
Interpret:
Deflator in 2022 = 95
Prices FELL by 5% from 2012 through 2022
Define nominal GDP
current value of newly produced final goods and services
Assume Deflator in 2020 = 110. Give economic meaning to this value
Prices rose 10% from the base year through 2020
Assume Nominal GDP in 2020 = $4,000. The deflator is 110.
Calculate the value of real GDP in 2020 and give economic meaning to this value.
Real GDP = 4000 / 110 × 100 = $3636.36
$3636 tells us the value of 2020 output measured with base year prices
Explain what it means if inflation in 2018 = 7%
Prices of goods rose 7% from Jan 1 2018 to Dec 31 2018
Identify and explain the three types of unemployment.
Frictional unemployment, Structural unemployment, Cyclical Unemployment
Assume:
Nominal GDP in 2018 = $5000
Deflator in 2018 = 120
Nominal GDP in 2018 = $9000
Deflator in 2019 = 135
Interpret the deflator in 2018 and 2019 and find real GDP in 2018 and 2019
prices rose 20% from the base year through 2018 (120-100)
prices rose 35% from the base year through 2019 (135-100)
Real GDP in 2018 = 5000/120 × 100 = $4167
Real GDP in 2019 = 9000/135 × 100 = $6667
Interpret:
CPI in 2017 = 111
the average price of consumer goods rose 11% from the base year through 2017
Interpret:
PPI in 2021 = 118
The average price of producer goods rose 18% from the base year through 2021
Define inflation
measures the average price of consumer goods
unemployment rate formula
unemployed / labor force x 100
labor force participation rate (formula)
Labor force / working age population x 100
Find the unemployment rate and labor force participation rate given..
employed = 80
unemployed = 10
working age population = 150
unemployment rate = 10 / 80 + 10 × 100 = 11.1%
labor force participation rate = 90 / 150 × 100 = 60%
Explain frictional unemployment
There’s jobs available for people with “A” skills, and there are unemployed people with those same “A” skills
Explain Structural unemployment
There’s jobs available for people with “B” skills and they’re unemployed people with “A” skills
Explain cyclical unemployment
an economic downturn creates unemployment throughout the economy
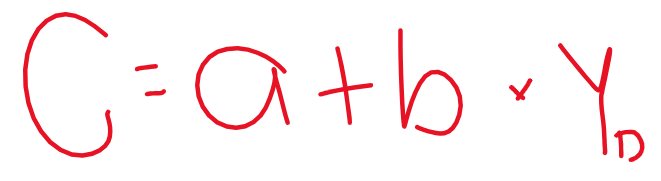
consumption function
c = a + b * Yd
identify the C variable to the consumption function
C = total dollar amount of household consumption spending
Identify the A variable to the consumption function
autonomous consumption spending. money spent that is not derived from current earned income. money that is spent on gifts, savings, borowing
Identify b in the consumption function
MPC, how much we spend of each additional dollar of Yd
If the value of “b” changes, the consumption function gets…
steeper or flatter. C moves UP or DOWN
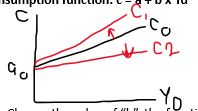
If the value of '“a” changes, it is due to changes in…
household wealth, ease + cheapness of borrowing, income expectations, we spend more or less out of savings, borrowing, wealth