Ecology week 3 - graphs.
1/12
There's no tags or description
Looks like no tags are added yet.
Name | Mastery | Learn | Test | Matching | Spaced | Call with Kai |
|---|
No analytics yet
Send a link to your students to track their progress
13 Terms
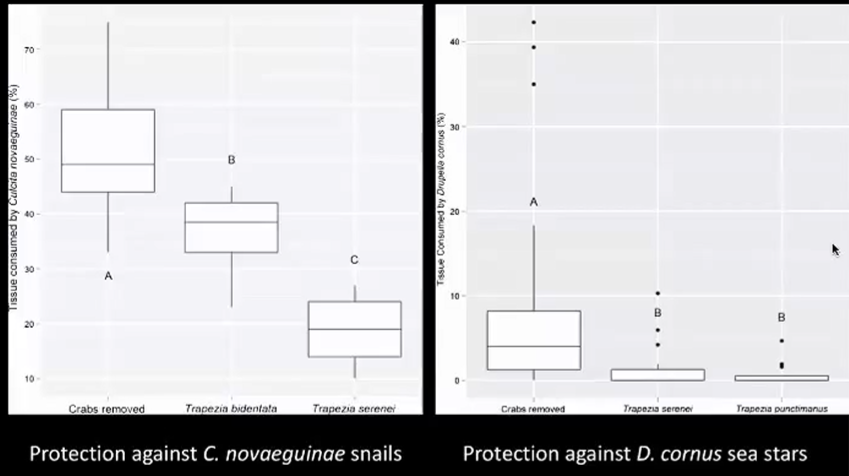
Graph shows
Graphs demonstrate firstly that crabs are effective defenses against both sea stars and snails with significant difference in tissue consumption when they are absent. Secondly, shows that sea stars are more effective as predators than sea snails as they consume a greater amount of tissue in absence of crabs. Thirdly shows a significant difference between the effectiveness of different crab species when protecting against sea stars but equally effective when protecting against snails.

Explain this graph
Demonstrates that ant attended colonies of aphids are more likely to survive than un-attended colonies.
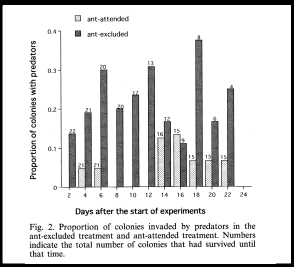
Explain this graph
Shows that ant attended colonies are less frequently invaded by predators than unattended.

Explain this graph
Graph shows that aphids are significantly smaller when attended by ants, and produced fewer embryos. Also smaller + less embryos in august compared to july.
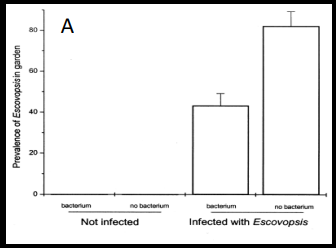
Explain this graph
Shows that there is significantly less of the escovopis pathogen in colonies where worker ants carry the bacteria

Explain this graph
Shows that the mass of fungi in the presence of escopovis infection is higher when worker ants carry the bacteria
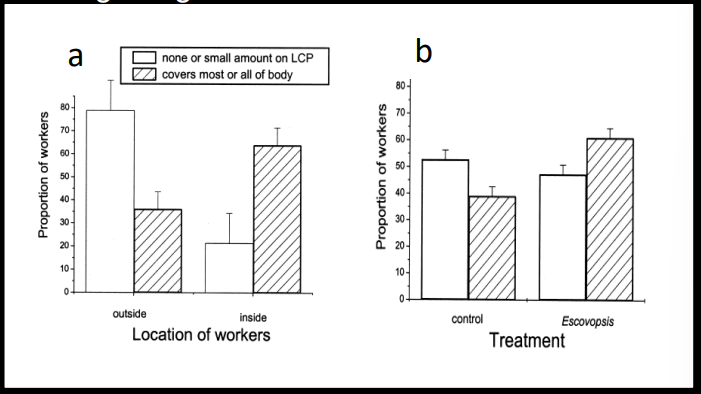
Explain this graph
A: inside workers carry more bacterium than outside workers, B: bacterial load increases significantly in indoor workers in response to infection
Explain this graph
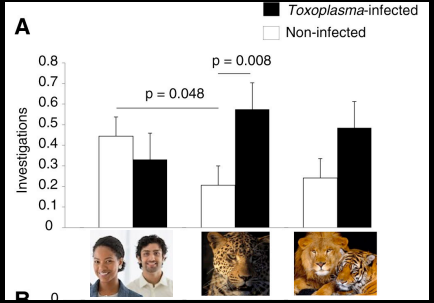
Toxoplasma infected chimpansees are significantly more attracted to cat species urine than uninfected chimpanzees. It is shown to be specific to cat species as they are significantly less atracted to human species urine.
Explain this graph
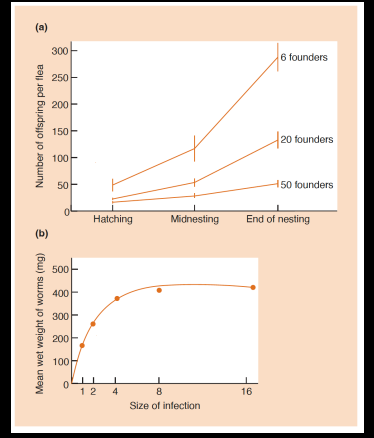
Graph A demonstrates how the number of offspring per individual decreases as density of parasites increases. low density population with 6 founders has between 250-300 offspring whereas a high density population with up to 50 founders have less than 50 offspring. Graph B shows that the mean weight of parasitic worms decreases as the infection size and parasite population density increases. Both of these demonstrate intraspecific competition.
Explain this graph
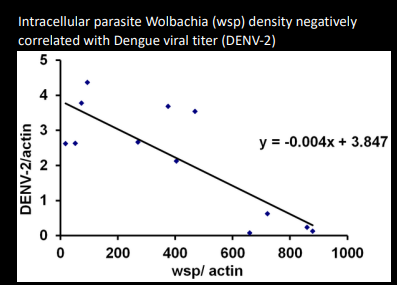
This graph shows how the density of dengue parasites decreases as the density of wolbachia bacteria increases, demonstrating how in interspecific competition, wolbachia outcompetes dengue
Explain this graph
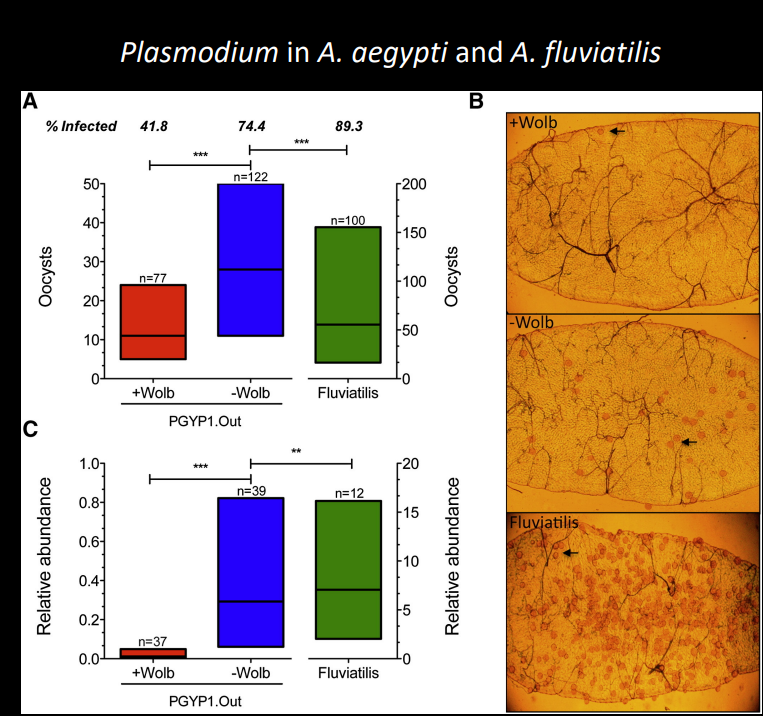
Graph shows that the percentage of mosquitos infected with plasmodium decreases when wolbachia is also present. Graph c shows that the relative abundance of plasmodium in infected individuals is greatly lower in those infeted with wolbachia than those without. These both suggest that wolbachia is outcompeting plasmodium.
Explain this graph
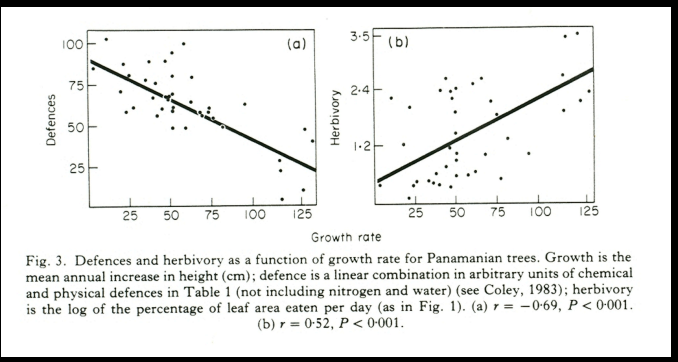
This graph supports the resource availability hypothesis which suggests that fast growing plants invest less energy into host defenses. The graph on the left supports this as it shows a correlation between increased growth rate and decreased host defenses, the graph on the right explains why this was selected for as it shows fast growing plants are less fruequently predated upon, indicating there is reduced necessity + selection pressure for fast growing plants to evolve defenses.
Explain this graph
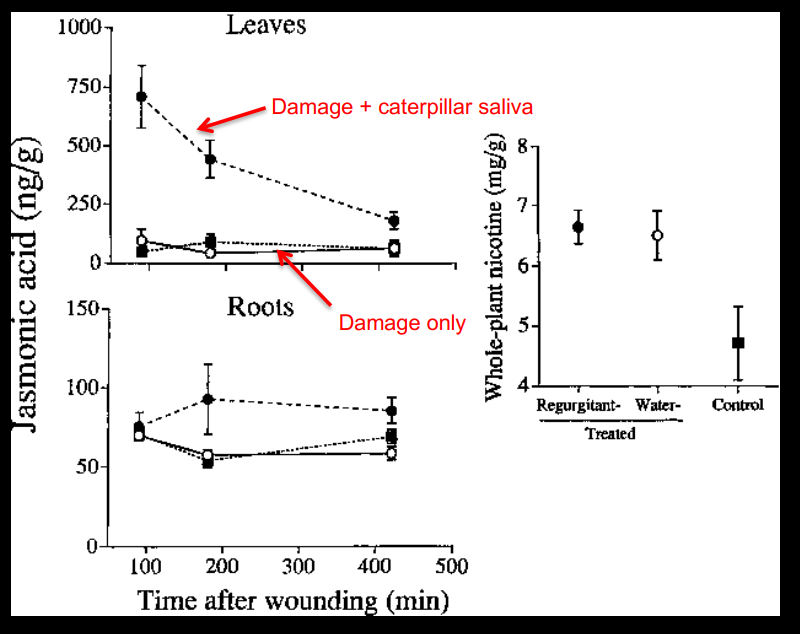
This graph demonstrates inducible defenses in tobacco plants. The top graph shows that jasmonic acid concentration is higher in plant leaves exposed to damage and caterpillar saliva than those solely exposed to damage, indicating that the production of acid is induced by detection of caterpillar saliva.