Economic HL - Semester 2 Term 3 - 3.1, 3.2, 3.3 - (none)
1/185
There's no tags or description
Looks like no tags are added yet.
Name | Mastery | Learn | Test | Matching | Spaced | Call with Kai |
|---|
No analytics yet
Send a link to your students to track their progress
186 Terms
What’s Macroeconomics?
Looking at the economic of the world (at the whole/ bigger picture)
Is the ‘Circular Flow of Income’ realistic?
It is not realistic, as we are missing out on the possible consequences or alternative spending, and stakeholders: Leakages (Banks, Taxes, Imports), Injections (Government & Investment), and Spending (Exports).
What do households do, with the income they’ve gained from factor payments?
They spend their money on goods and services produced by firms. Hence the income flow is numerically the same value as the expenditure flow and the output flow.
Why is ‘Income = Output = Expenditure’?
Households own all factors of production, and when firms use it, households will then earn income.
Through this income they will produce goods and services; so this will be the same amount as the output (Income = Output = Expenditure).
This is possible for open, and closed circular economy
What’s GDP (Gross Domestic Product)?
It is the total value of goods and services produced by firms within the geographical borders of a country in a period, regardless of who owns the FOP.
What’s GNI (Gross National Income)?
The total income received by the residents of a country is equal to the value of all final goods and services, produced by the FOP that are supplied by the country’s residents, regardless of where the factors are located.
What’s the formula for ‘Income Method’?
Rent + wages + interest + profit
What’s the formula for “Expenditure Method”?
C + I +G (X-M)
What’s the purpose of ‘Output Method’?
To measure the value of all final goods and services produced by firms in a country.
The alphabets in the GDP formula and its meaning
GDP = C + G + I (X-M)
C = Consumption Expenditure
G = Government Expenditure
I = Investment Expenditure
X = Spent on Exports
M = Spent on Imports
How to calculate GNI?
GDP + Income from abroad - Income sent abroad, (or + net income from abroad)
Nominal Value
Measured in terms of current price, which does not account for price changes.
Real Value
The measure of value that takes into account change in price over time (price is at the base year)
What are the differences between real value, and nominal value?
Real Value:
It ignores inflation
Gives a better view of how much economy is growing
It uses old prices
Real value: Output Increases
Nominal Value:
It counts inflation
Nominal value: Output & value increase.
GDP Deflator
Price index of everything produced in a nation, in a period of time.
Formula for GDP Deflator
Nominal GDP/ real GDP x 100
Real GDP per capita
Value of all final goods and services at constant price divided by the population.
Business cycle
A type of model that shows how the GDP fluctuates over time (GDP in the short term fluctuates up and down).
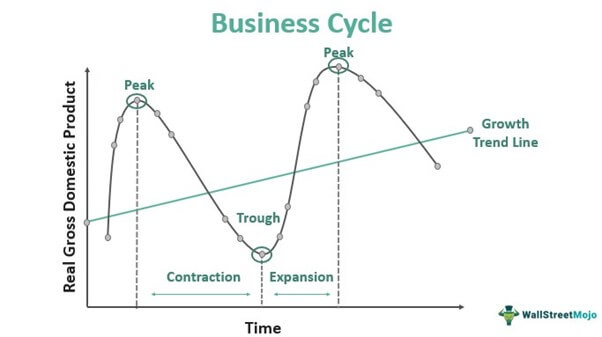
Properties of a business model
Peak — represents the maximum real GDP in a cycle.
Expansion — When there is a positive growth in the GDP.
Contraction — A period when economic activity is declining.
Trough — It occurs when the recession, or contraction phase, bottoms out and starts to rebound into an expansion phase — and the business cycle starts all over again (lowest point).
Price levels differ between countries, therefore?
A high income in a high-cost country will have a lower purchasing power than if it was earned in a low cost country.
What’s purchasing power?
Quantity of goods that can be bought with money
Therefore currency conversion that account for different purchasing power is needed:
Purchasing Power Parities (PPPs) methods
Fluctuations in real GDP would lead to?
Fluctuations in employment
Economy’s actual GDP = potential GDP
The economy is at full employment level or it is equal to the natural unemployment rate
When real GDP < Potential Level
The economy is greater than the full employment
When Real GDP > Potential level
The actual unemployment is below the NRU (National Register Of Unemployed)
Why should we study ‘Business Cycle’?
Reducing the intensity of expansion and contraction, making gaps as small as possible → stabilize the economy.
Increase the steepness of the line representing potential output by achieving more rapid economic growth over long period of time.
Limitations of real GDP per capita
It does not accurately measure the ‘true’ value of output produced in an economy.
Economic well-being is closely related to factors that GDP/ GNI are not accounted for.
Why GPD/ GNI inaccurately measure the true value of output (5)
Does not include non-market outputs
Does not include parallel markets/ underground markets
Does not take into account quality improvement in goods and service
Does not take into account negative externality and depletion of natural resources
Differing domestic price level
GDP and GNI inaccurately measure economic well-being (05)
Make no distinction in the composition of the output.
Cannot reflect achievement in education, health, and life expectancy.
Provide no information on the distribution of income and output
Do not take into account increased leisure
Do not take into account the quality of life factors
Alternative measure of well-being
OECD better life index
Happiness Index
Happy planet Index
What does OECD stand for?
Organization of Economic Cooperation and Development
OECD Better Life Index purpose, & advantage
Provide a forum to discuss common problems, policy, and encourage economic well-being.
Advantage: to provide the better presentation of well-being → for the basis of policies intended to improve the quality of life.
Aim/ Focus of Happiness Index
Gathering specific and technological knowledge to encourage policies for sustainable development, and to address the world's interdepend economic, social and environmental challenges.
What is Happiness Index based on? (6)
Real GDP per capita
Social Support
Health life expectancy
Freedom to make life choices
Generosity
Perceptions of corruption
How does the Happiness Index rate countries?
From 1-10
limitation of the Happiness Index
Some data and variable used doesn’t represent happiness, because it is difficult to measure or quantify.
What does the Happy Planet Index measure?
It measures the sustainable well-being
Happy Planet Index (HPI) Formula
(Life expectancy x well-being x inequality of income)/ ecological footprint
Life Expectancy
Average number of year a person is expect to live
How does the Happy Planet Index measure well-being?
Inequality of outcomes
It’s the inequality between people in regards to life expectancy and well-being.
Whats the Ecological footprint?
Effect on the environment of each individual/ society
what’s the limitation of the Happy Planet Index?
Ecological footprint are based on controversial concept
What’s Aggregate Demand?
Value of total demand for all goods and services in that all buyers in the economy want to buy at different price levels/ Total output for all goods and services.
What does the x-axis represent in Aggregate (Total) Demand?
Real GDP (Y)
What does the y-axis represent in Aggregate (Total) Demand?
Price Level (Pl)
What does the line going downwards represent in Aggregate (Total) Demand?
Aggregate Demand (AD)
What does Aggregate Demand (AD) represent?
Everyone’s demand, and it consists of all components of Aggregate Expenditure.
Whats the formula for Aggregate Demand (AD)?
C+G+I+ (X-M)
What does the words in the formula of Aggregate Demand represent/ mean?
I → Demand for Businesses/ Firms
C → Demand for Consumers
G → Demand for Government
X → Demand for foreigners for exports
M → Demand for foreigners for Imports
X-M → Net profits
What causes Aggregate Demand (AD) to shift?
Rightwards shift → AD increases for any price level, a large amount of real GDP is demanded → AD1 to AD2.
Leftward shift →From AD1 to AD3, means that AD decreases: for any price level, a smaller amount of real GDP is demanded.
6 factors that cause changes in consumption spending (C)
Interest rate
Consumer confidence
Change in wealth
Personal income taxes
Change in the level of household indebtedness
Expectation of future price level
6 factors that causes change in investment spending (I)
Business Confidence
Interest rate (monetary policy)
Improvement in technology
Business taxes (fiscal policy)
Change in the level of corporate indebtedness
Legal/ institutional changes
2 factors that can cause a change in government spending
Change in political priority — Before and after the election.
Change in economic priority — Deliberate efforts to influence AD (fiscal policy)
3 Factors that cause a change in foreigners spending
Change in national income abroad
Change in exchange rate
Change in level of trade protection
What’s Aggregate Supply?
Total quantity of goods and services produced in an economy (real GDP) over a particular period of time of different price level.
What’s short run?
Time-period where factor prices (eg. wages) are fixed and dont change when the average price level changes.
What’s long run?
Time period in which factor prices (eg. wages) are flexible, and adjust to change in the average price level change.
Why is the Aggregate Supply curve upwards?
Based on firms profitability
When there is increase in price level, the output price increase, with unchanging resource price (short run), firms’s profit increase.
Because it is more profitable, the qty produced increases.
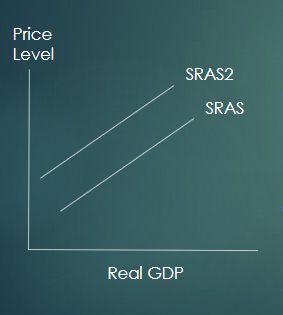
5 factors causes the shift in the SRAS
Change in wages
Changes in non-labour resources
Changes in indirect taxes
Changes in subsidies offered to businesses
Supply shocks
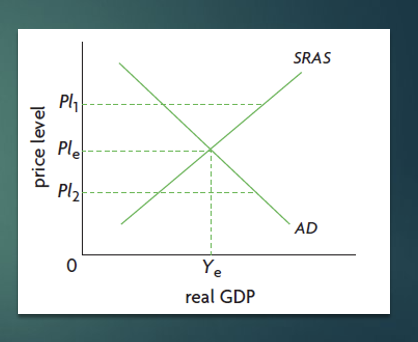
Short run macroeconomics equilibrium
Equilibrium is given by the point of intersection of the AD and SRAS curves.
Determines the price level, the level of real GDP and the level of employment.
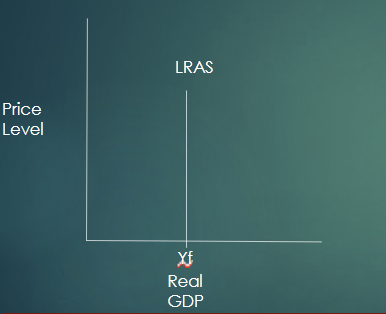
Why is the Long-run aggregate supply (LRAS) (Monetarist) vertical?
Wages and other resource prices are now changing to match output price changes. Therefore profit will be constant so there will be no incentive to increase or decrease output.
What’t the meaning of Xf?
Full employment level of output = potential output produced is in full capacity, does not equal to zero unemployment.
What’s the LRAS?
full employment level of real GDP
What does the LRAS mean?
In the long run change in AD results only in changes in price level while quantity of real GDP stays the same.
The economy is in long-run equilibrium when the AD curve and the SRAS curve intersect at any point on the LRAS.
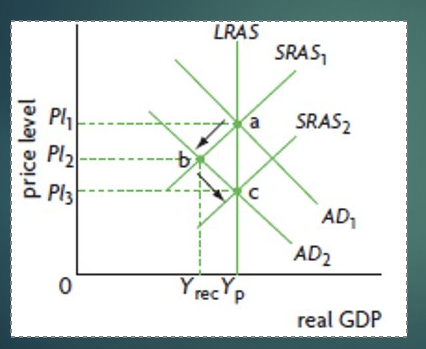
Automatic self correction
Assumption of wage and resource price flexibility in the long run has allowed the economy to automatically comeback to its potential output/ LRAS equilibrium.
Persistence of deflationary
The assumption of wage and resource price flexibility in the long run has allowed the economy to automatically comeback to its potential output/ LRAS equilibrium.
The flaw of Monetarist, based on Keynesian
If price is rigid, during recessionary gap, instead of meeting in point b, thew new price level and real gdp will be in point d.
If there;s a fall in price and the equilibrium will be in point b, it will stuck there unless the SRAS move, otherwise the economy will be stuck on the long run.
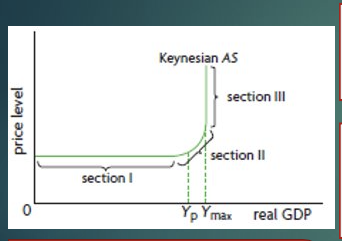
The Aggregate Supply (Keynesian)
Horizontal phase: Wages and price do not move downward. Real GDP low price level constant as real GDP increase because there’s still spare capacity. They can produce more output without increase wage.
Upward sloping phase: Real GDP increase accompany by increase in price level. No longer spare capacity, therefore wages and other resources price increases.
Yp shows the potential output level, reach full employment level of GDP and natural rate of unemployment.
Vertical phase: Real GDP reaches a level which can not increase anymore because firms are using the maximum amount of labor and resources in the economy (Ymax).
Therefore efforts on increase output only result in greater increase in the price level.
What argument does the Keynesian AS model come with?
Wages and resource price is inflexible, bc of minimal wage, employer resistance due to morale.
What causes the shift in long run aggregate supply?
Increase in quantity of FOP
Increase in quality of FOP
Improvement in technology
Increase in efficiency
Institutional change
Reduction in the natural rate of unemployment
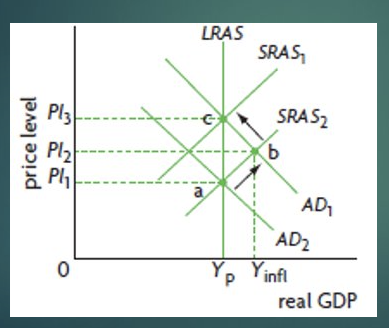
Whats the difference between monetarist and keynesian?
In the long-run, AD only influences the price level, not GDP.
Increase in AD in the long-run are inflationary (cause an inflation).
In Keynesian model, the equilibrium happen in the horizontal phase for a long time. This is caused by: (1) inability of wages and price to fall, and (2) insufficient aggregate demand to move the producer to produce in the potential GDP.
Unemployment
People of working age who are actively looking for jobs, but not employed.
Underemployment
People who work part-time jobs when they would rather work full-time
Formula for Unemployment Rate
Number of unemployed people/ labor force x 100
Unemployment Rate
Percentage of the labor force that is unemployed.
Labor Force
Number of people who are employed + number of people who are unemployed.
This consist of those who are employed, self-employed, and the unemployed.
Population Groups
Measures the avg over the entire population, and it does not include:
Region Disparities
Ethics group disparities
Gender disparities
Age disparities: mostly youth unemployment
Occupation and educational attainment: less skill, less opportunity → unemployed.
Economic cost of unemployment
Loss in real output (GDP) → Fewer people produce output.
Loss in income for unemployed workers
Loss in tax revenue
Cost to the government of unemployment benefit
Cost to the government in dealing with social problem
Larger budget deficit or smaller budget surplus
More unequal distribution of income
Social and Personal Cost of Unemployment (Personal Problems)
Great psychological stress
Lower level of health
Family tension
Family breakdown
Suicide
Social and Personal Cost of Unemployment (Greater Social Problem)
Increase crime and violence
Drug use
Homelessness, arising from growing poverty
4 Types of Unemployment
Structural Unemployment
Frictional Unemployment
Seasonal Unemployment
Cyclical Unemployment
Structural Unemployment
Occurs due to changes in the structure the economy and a mismatch between the type of labour demanded and the type supplied.
Causes for Structural Unemployment
Technological Changes — Demand for a specific labour skills changes overtime. Some jobs become OBSELETE, and all demand disappears. (ATMs replacing bank tellers).
Structural Changes — Economy develops often primary sector jobs will disappear and be replaced by secondary and tertiary jobs.
Geographical Changes — When a large firm/ industry moves to a different location. Thus decreasing the demand for that specific type of labour in one region and an increase demand for the region it relocates.
Labour Market Rigidities — Factor that prevent the forces of supply and demand from operating in the market.
Frictional Unemployment
Occurs when workers, are between jobs. Workers may leave their job because they have been fired or they are looking for a better job.
Characteristics of Frictional Unemployment
It is usually temporary
Does not involve a lack of skills
Inevitable in growing economy
A part of natural unemployment
Seasonal Changes (Seasonal Unemployment)
Demand for labor in certain industries changes on a seasonal basis because of variations in needs. Its also a part of natural unemployment.
Why is ‘Seasonal Unemployment’ Unavoidable?
Because there will always be some industries with seasonal so variations in labour demand.
Cyclical Unemployment
Occurs during the downturn of a business cycle, when the economy is in a deflationary gap. The downturn is seen as arising from declining or low aggregate demand (AD)
Causes of Cyclical Unemployment
A shortfall of demand for goods and services results in a lack of jobs being available for those who want to work.
Businesses experiencing weaker demand might reduce the amount of people they employ by laying off existing workers, or hiring fewer new workers.
What’s Economic Growth?
Increase in real GDP, or the real qty of goods and services produced.
How is Economic Growth Measured?
A percentage (%) change in real GDP, over a period of time.
A percentage (%) change in real GDP per capita over a period of time.
What is the Formula for measuring the Growth of the total output produced in economy?
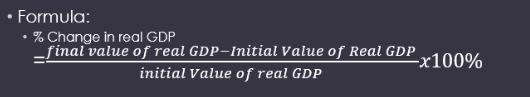
What does ‘Growth in real GDP, per capita’ measures?
The growth of the total output per-person, thus a better indicator of the standard of living.
What’s short-term growth?
Increase in AD, and AS.
What’s long-term growth?
Increase long-term AS
What’s the PPC model?
It shows the maximum output that can be produced by an economy with fixed resources and technology, provided there is maximum employment of resources and efficiency in production.
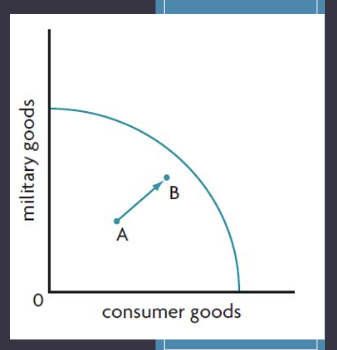
What’s ‘Actual Growth’ (short-term growth) — PPC model?
Economic growth as an increase in actual output, caused by reductions in the unemployment and productive inefficiency.