AP physics unit 1 MCQ review
1/29
There's no tags or description
Looks like no tags are added yet.
Name | Mastery | Learn | Test | Matching | Spaced |
|---|
No study sessions yet.
30 Terms
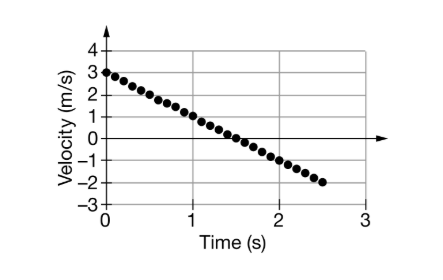
At t=0 a moving cart on a horizontal track is at position 0.5m using a motion detector, students generate a graph of the carts velocty as a function of time as shown above. At time t=1.0s the carts position is most nearly
1.75 m
An object is sliding to the right along a straight line on a horizontal surface. The graph shows the object's velocity as a function of time. What is the object's displacement during the time depicted in the graph?
0 m
A car is driving east on a straight, level road with a speed of 20 m/s when it begins to accelerate eastward at a constant rate. After 5 s the car has a speed of 40 m/s to the east. The acceleration of the car during the 5 s interval is
4 m/s^2
An object on a straight, horizontal track with an initial positive velocity undergoes a constant acceleration of -5m/s^2 for 4 seconds. Which of the following is the change in velocity of the object during this interval?
- 20 m/s
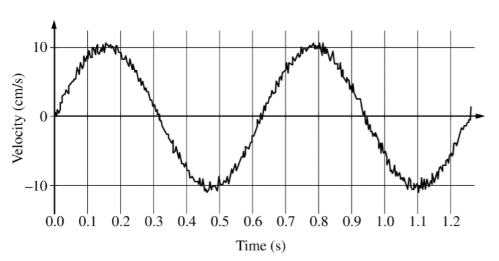
A student sets an object attached to a spring into oscillatory motion and uses a motion detector to record the velocity of the object as a function of time. A portion of the recorded data is shown in the figure above.
The acceleration of the object at time t = 0.7 s is most nearly equal to which of the following?
The slope of the tangent to a best-fit sinusoidal curve at 0.7 s

A student sets an object attached to a spring into oscillatory motion and uses a motion detector to record the velocity of the object as a function of time. A portion of the recorded data is shown in the figure above.
The total change in the object's speed between 1.0 s and 1.1 s is most nearly
5 cm/s
A 1.5 kg cart starts from rest and then accelerates at a constant rate of 2 m/s² to the right for 5 s. The displacement of the cart over this time interval is most nearly
25 m
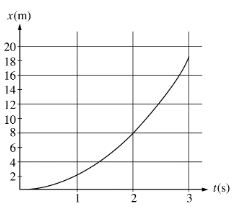
The graph above represents position x versus time t for an object being acted on by a constant force. The average speed during the interval between 1 s and 2 s is most nearly
6 m/s

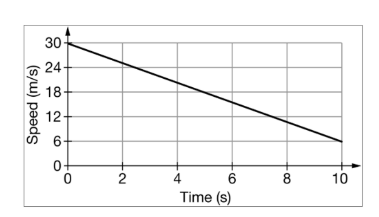
The graph above shows the speed of a truck as it moves along a straight level road. How far does the truck travel in the 10 s time interval shown?
180 m
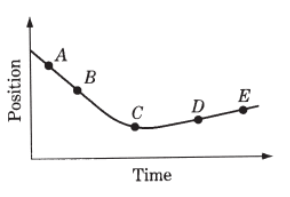
The motion of a particle along a straight line is represented by the position versus time graph above. At which of the labeled points on the graph is the magnitude of the acceleration of the particle greatest?
C
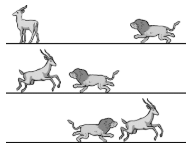
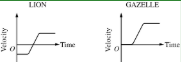
A lion is running at constant speed toward a gazelle that is standing still, as shown in the top figure above. After several seconds, the gazelle notices the lion and accelerates directly toward him, hoping to pass the lion and force him to reverse direction. As the gazelle accelerates toward and past the lion, the lion changes direction and accelerates in pursuit of the gazelle. The lion and the gazelle eventually each reach constant but different speeds. Which of the following sets of graphs shows a reasonable representation of the velocities of the lion and the gazelle as functions of time?
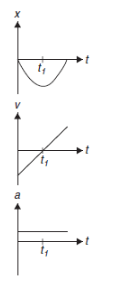
The graphs above represent the position x, velocity v, and acceleration a as a function of time t for a marble moving in one dimension. Which of the following could describe the motion of the marble?
Rolling up a ramp and then rolling back down
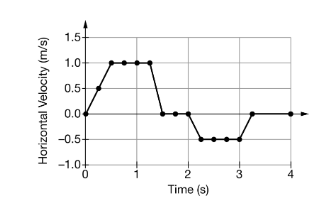
A motion sensor is used to create the graph of a student’s horizontal velocity as a function of time as the student moves toward and away from the sensor, as shown above. The positive direction is defined as the direction away from the sensor. Which of the following describes the student’s final position xf in relation to the starting position x0 and the student’s average horizontal acceleration ax between 0.0 and 3.0?
position xf is farther away from the sensor than x0 and ax is negative
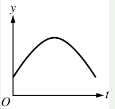
A person throws a marble straight up into the air, releasing it a short height above the ground and catching it at that same height. If air resistance is negligible, which of the following graphs of position y versus time t is correct for the motion of the marble as it goes up and then comes down?
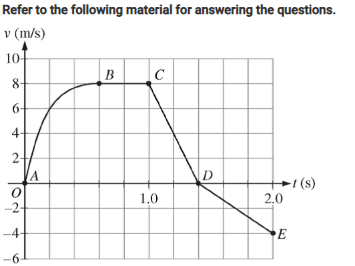
A cart is constrained to move along a straight line. A varying net force along the direction of motion is exerted on the cart. The cart’s velocity v as a function of time t is shown in the graph above. The five labeled points divide the graph into four sections.
For which segment does the cart move the greatest distance?
AB

A cart is constrained to move along a straight line. A varying net force along the direction of motion is exerted on the cart. The cart’s velocity v as a function of time t is shown in the graph above. The five labeled points divide the graph into four sections.
Which of the following correctly ranks the magnitude of the average acceleration of the cart during the four sections of the graph?
aCD > aAB > aDE > aBC
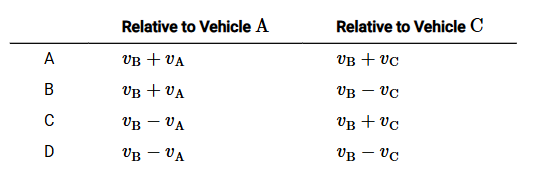
Three vehicles pass each other traveling on a three-lane roadway. Vehicle A is moving west with speed Va relative to the road; Vehicle B is moving east with speed Vb relative to the road; and Vehicle C is moving east with speed Vc relative to the road. Assume east is the positive direction. What is the velocity of Vehicle B relative to observers in Vehicle A and in Vehicle C?
B
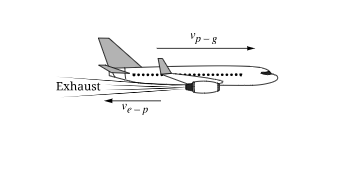
A plane flies horizontally with constant speed v p-g relative to the ground. While in flight, the plane ejects exhaust in the opposite direction at a speed relative to the plane. Which expression correctly represents the velocity of the exhaust relative to the ground?

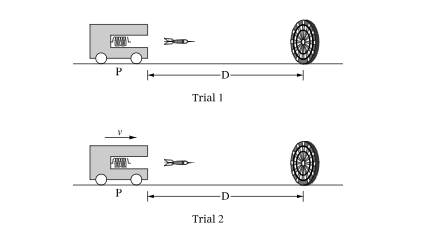
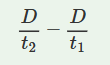
A cart equipped with a launcher launches a dart horizontally, as shown. The dart is always given the same horizontal velocity v dart relative to the cart. In Trial 1, the cart is at rest at Point P a distance D from a target and launches the dart toward the target. The dart takes a time t1 to reach the target. In Trial 2, the cart is moving toward the target with constant speed v cart and launches the dart at the instant the cart is at Point P. The dart takes a time t2 to reach the target. The cart has a negligible change in speed during the launch. Which of the following is a correct expression for the cart’s speed v cart?
A duck flies past a truck that is at rest. The duck takes 2.1 seconds to fly at constant speed vd from the back of the truck to the front. Later, the truck travels along a flat, straight roadway with a constant speed ¾ vd . The duck again flies past the truck with constant speed vd, flying in the same direction that the truck is moving. How long does it take the duck to fly from the back of the truck to the front in this case?
8.4 seconds
A train is moving to the east at 2.5 m/s relative to the ground. A passenger at the back of the train throws a ball to the west with an initial speed of 15 m/s relative to the train. What is the initial velocity of the ball relative to the ground?
10 m/s to the east
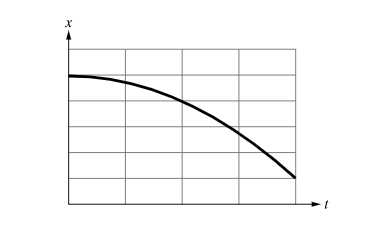
The graph shows the position x of an object as a function of time t as it moves along the x-axis. Which of the following claims about the motion of the object during the time interval shown is correct?
The velocity and acceleration of the acceleration are both in the -x direction.
An object is initially at the origin. The object changes its position to the right by 4 units. The object then changes its position to the left by 3 units. Which of the following correctly indicates the magnitude of the object’s change in position and provides a valid justification?
1 unit, because in one dimension vectors with opposite directions have opposite signs.
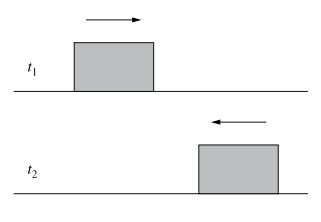
A student slides a box across a level floor in a straight, horizontal path as shown in the picture. At time t1, the box is moving to the right at 1 m/s. At time t2, the box is moving to the left at 1 m/s. Which of the following correctly describes the speed and velocity at the times t1 and t2?
C
A cart moves along a straight, level track. At time t = 0 s, the cart has a speed of v0 to the right. At time t = 1 s, the cart has a speed of v1 to the left. Which of the following correctly describes the magnitude and direction of the change △v in the cart’s velocity between t =0 and t = 1 ?
v1 + v0 to the left
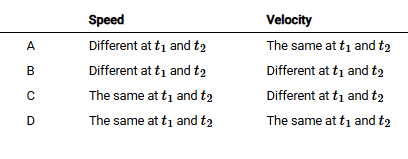
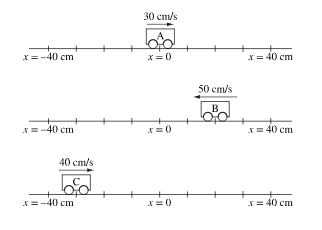
Object 1 and object 2 travel across a horizontal surface, and their horizontal velocity as a function of time is shown in the graph. Which of the following statements is correct about the two-object system?
After 2s, object 1 travels a greater distance than object 2 travels.
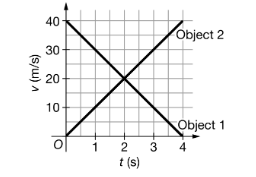
Three carts move along the x-axis. The locations and instantaneous velocities of the carts are shown in the figure. Which of the following correctly ranks the carts according to the magnitude of their position vectors relative to the origin at the instant shown?
C>B>A
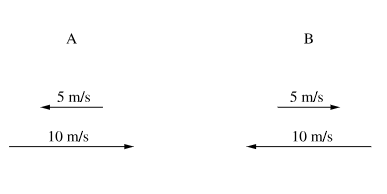
Figure A and Figure B both show two velocity vectors. Let A and B be the vector sums of the velocity vectors in Figure A and Figure B, respectively. Are the speed and the velocity of A the same as the speed and velocity of B?
No, because the vectors are in opposite directions, which means the velocities are different.
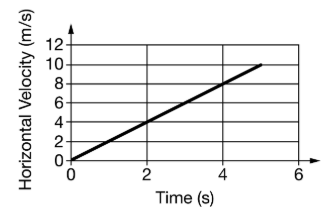
An object travels along a straight line across a horizontal surface, and its motion is described by the velocity versus time graph shown in the figure. Which of the following methods will determine the total displacement of the object between 0s and 5s? Select two answers.
Finding the area bound by the horizontal axis and the curve from 0s to 5s
Using Average Speed = total distance/ total and multiplying the average speed of 5 m/s by a total time of 5s
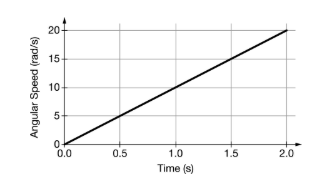
An object rotates with an angular speed that varies with time, as shown in the graph. How can the graph be used to determine the magnitude of the angular acceleration a of the object? Justify your selection.
Subtract the greatest value of the angular speed from the smallest value of the angular speed, because a = △w.