S1 Consumer choice
1/15
There's no tags or description
Looks like no tags are added yet.
Name | Mastery | Learn | Test | Matching | Spaced | Call with Kai |
|---|
No analytics yet
Send a link to your students to track their progress
16 Terms
What is consumer theory?
Consumer theory examines how a person makes sensible decisions under scarcity.
What the individual wants to do
What the individual can do
The decision
Step 1 is associated with preferences.
Step 2 is associated with constraints to the individuals problem, e.g. constraints coming from income and market prices.
Step 3 is about the optimal decision (which decision will provide the most satisfaction.
Explain marginal and total utility
The satisfaction a consumer receives from consuming a product is called utility.
Total utility refers to the total satisfaction derived from all the units of that product consumed.
Marginal utility refers to the change in satisfaction resulting from consuming one unit more or one unit less of that product.
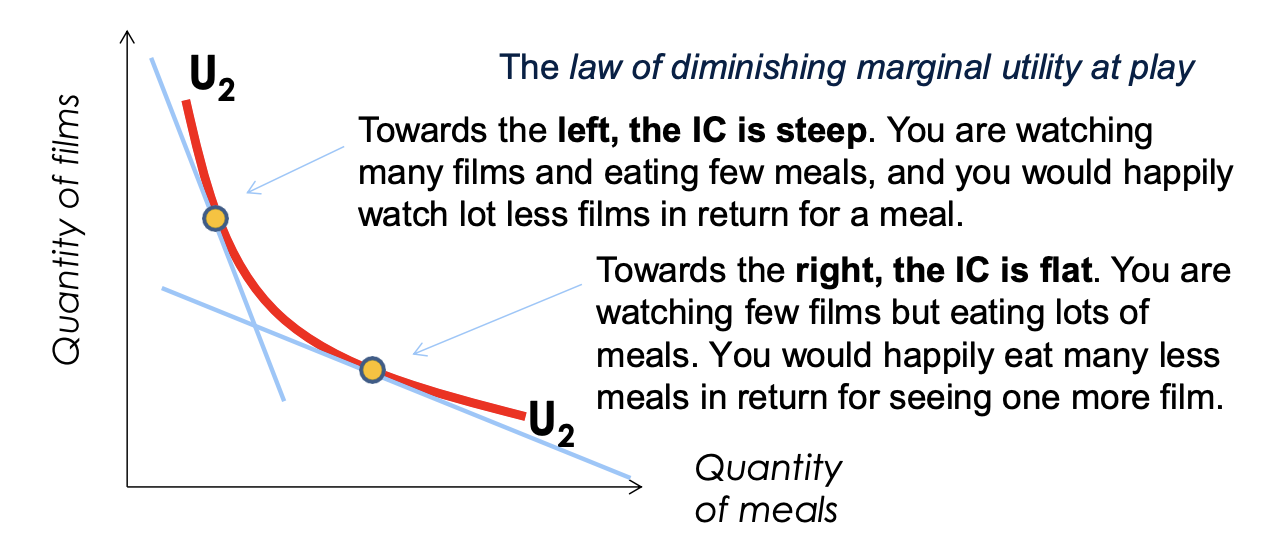
Explain diminishing marginal utility
A basic assumption of utility theory, which is sometimes called the law of diminishing marginal utility, is as follows:
The marginal utility generated by additional units of any product diminishes as an individual consumes more of it, holding constant the consumption of all other products.
Explain Step 1 to consumer choice (Preferences)
The choice for consumers is how to allocate their income across different goods in a way that maximises their satisfaction/utility. The basic assumption is that consumers are rational.
What do we expect of a RATIONAL buyer - all bundles of goods can be compared, all bundles of goods can be ranked consistently
What consistency in ranking means - similar bundles should have similar rankings, more is better, averages are preferred to extremes
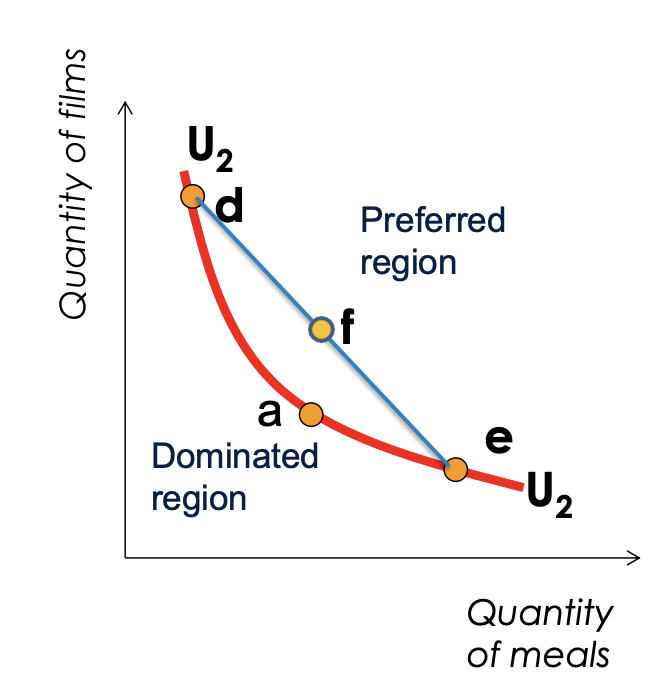
What does an indifference curve (IC) show?
Shows all the consumption bundles that yield the same utility to the consumer. ICs slope downwards (suggests a tradeoff between the two goods)
ICs cannot intersect
Their slope gets steadily flatter as you move along it to the right
They are bowed towards the origin
The consumer is indifferent between all points/bundles on the same indifference curve.
Points below/to the left of U2 give the consumer lower utility than any point on U2. Points above/to the right give the consumer more utility. Bundle f, for example, has been constructed to be the average of d and e. It gives higher utility than d or e.
What does the slope of an IC give you?
The marginal rate of substitution (MRS) between good x and y: it is the number of units of good Y the consumer can give up for 1 extra unit of good x and maintain the same utility.
Explain Step 2 of consumer choice (feasibility of choices)
A consumer’s choice is constrained by what they can afford. This depends on income.
Expenditure cannot be greater than income.
Explain the budget line
Income and prices together determine the combinations of the goods that the student can afford. The budget line separates the affordable (A to F and H) from the unaffordable bundles (G). Is H affordable? Yes, but it leaves money on the table
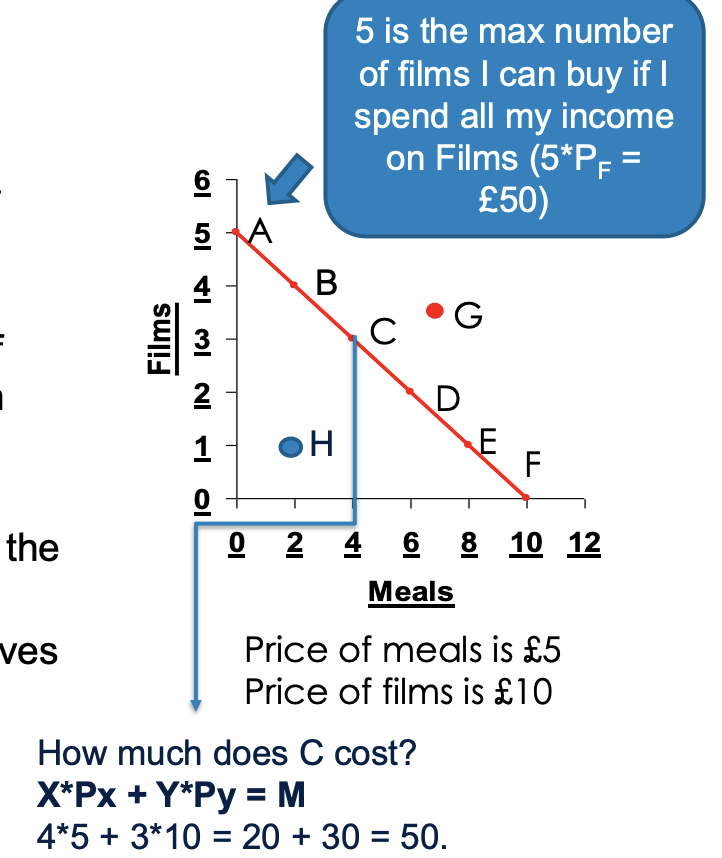
What does the slope of the budget line give you?
The slope shows the tradeoff: to buy 6 more meals, 3 films must be sacrificed etc.
Slope is: − ΔY/ ΔX
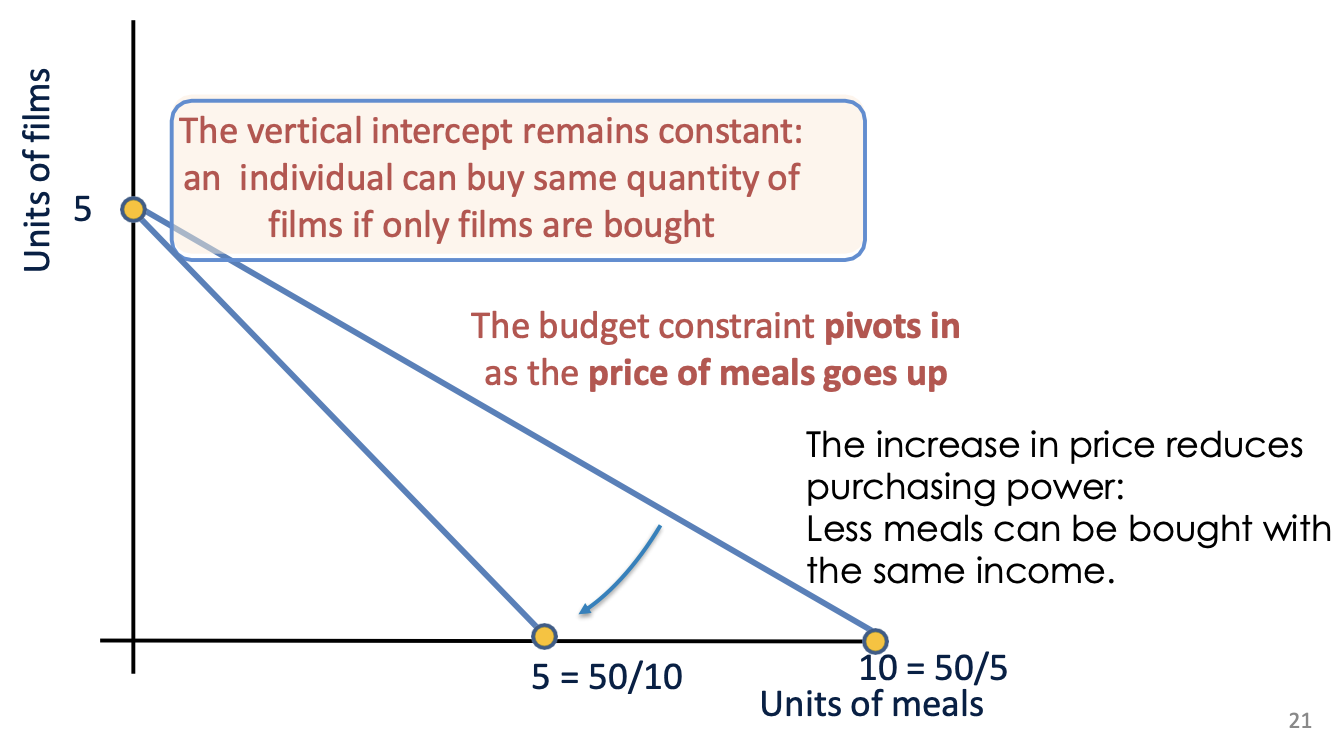
How does the budget line change if income increases? How does it change if prices increase?
The budget constraint shifts to the right as income rises, the slope of the budget constraint remains constant when income changes.
If the price of a product increases, the budget line will pivot inwards.
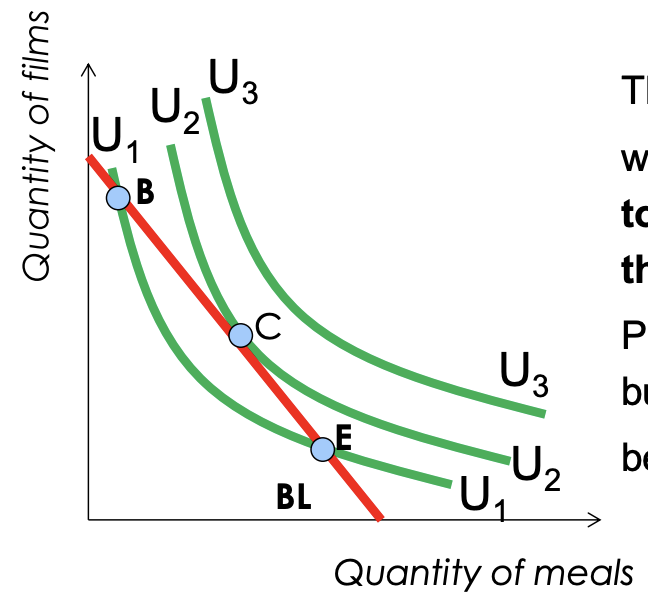
Explain Step 3 of consumer choice (the decision)
The point at which utility is maximised is found by bringing together the IC and the BL. The optimal choice point is where the BL is tangent to the IC. Point C in the image.
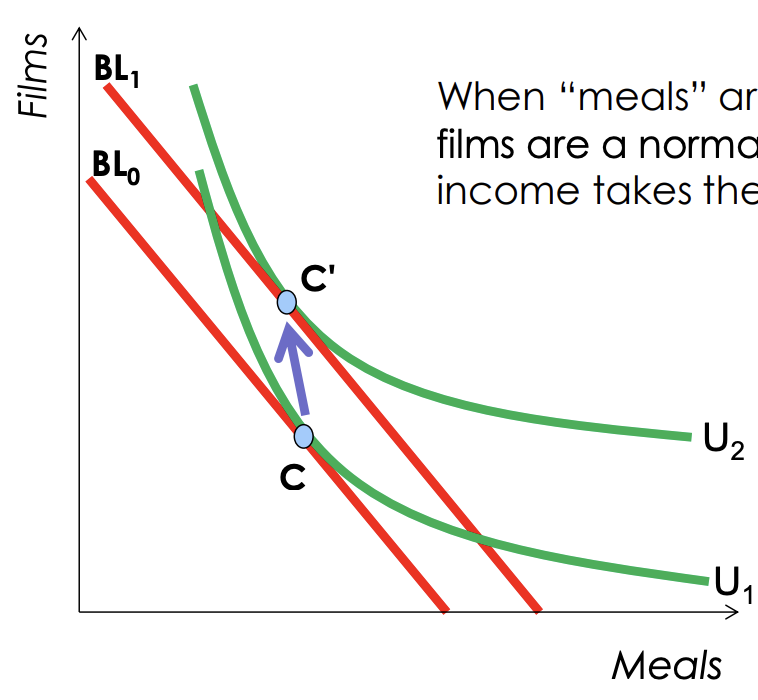
How does the IC BL graph change in regard to normal goods, inferior goods and elasticity.
Normal goods (income elasticity > 0) - the quantity demanded of each good increases.
Inferior good and normal good - the quantity of meals (the inferior good) has fallen and the quantity of films (the normal good) has increased. Shown in graph attached.
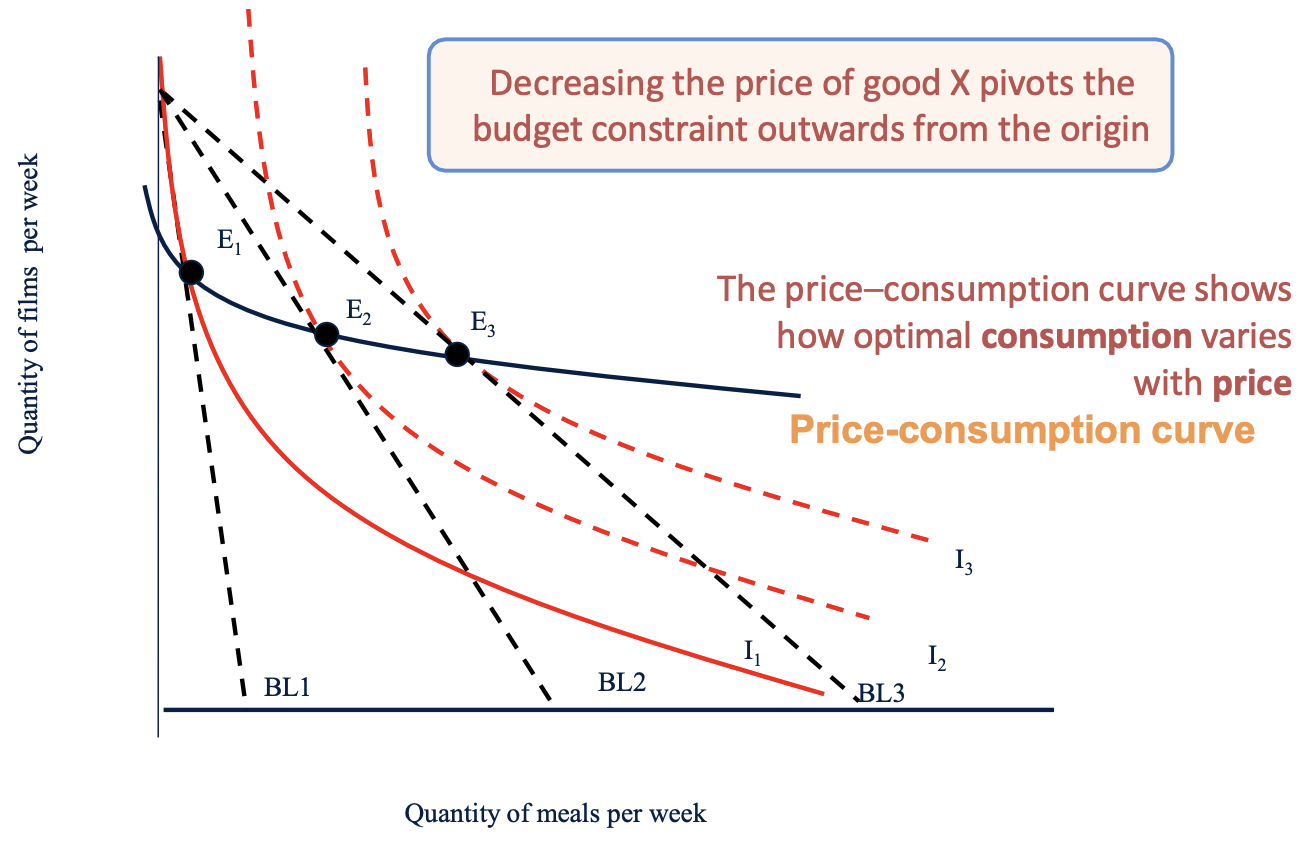
What does the price-consumption line look like following a decrease in the price of meals?
The price–consumption curve shows how optimal consumption varies with price
This line shows how a consumer’s purchases react to a change in one price, with income and other prices held constant.
Decreases in the price of meals (with income and the price of films constant) pivot the budget line from BL1 to BL2 to BL3.
The equilibrium position moves from E1 , to E2 to E3.
The blue price-consumption line joins all such equilibrium points.
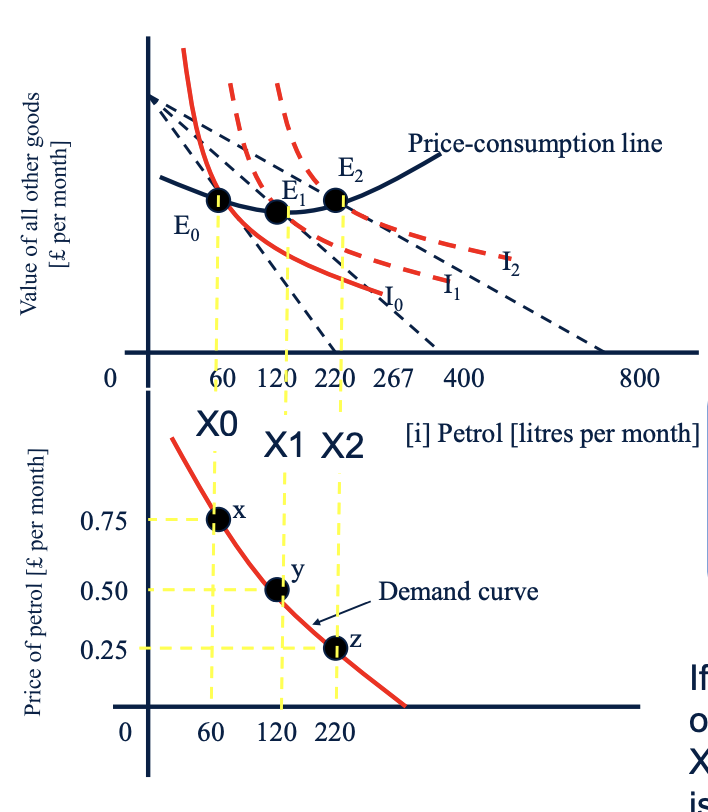
What can we use the price consumption curve to show?
How consumption of one good varies with price. This derives the consumer’s demand curve which can then be used to derive the market demand curve.
The points on a price-consumption line provide the information needed to draw a demand curve.
In part (i) Phillip has an income of £200 per month and alternatively faces prices of £0.75, £0.50, and, £0.25 per litre of petrol, choosing positions E0 , E1 , and E2.
The information for the number of litres he demands at each price is then plotted in part (ii) to yield his demand curve.
The three points x, y, and z in (ii) correspond to the three equilibrium positions E0 , E1 and E2 in part (i).
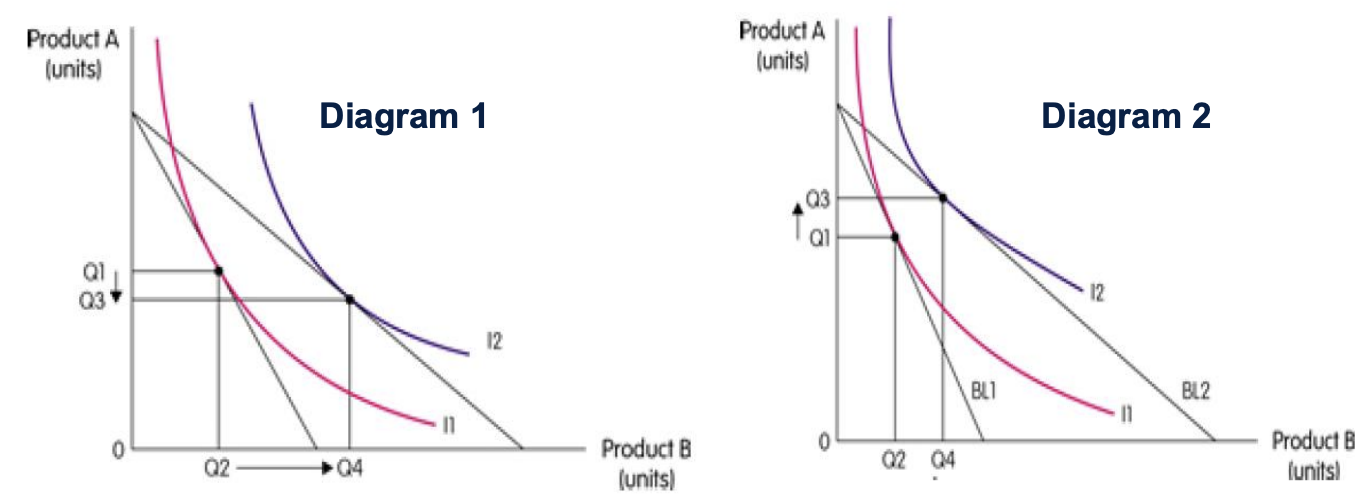
How does IC curve analysis show us whether two products are substitutes or complements?
In diagram 1, a fall in the price of product B has led to more of product B and less of product A being bought. The products are substitutes. The consumer has switched from product A to product B.
In diagram 2, the price of product B has fallen. This has led to an increase in the quantity demanded of A and B; the two products are complements. A lower price leads to more of both goods being bought.
Where does the consumer maximise utlity?
Where the BL and IC curves are tangent, i.e.: slope of IC = MRS = - MUx / MUy = - Px / Py = slope of BL
Rearranging this equation we get: MUx / Px = MUy / Py
Marginal utility of good X/Price of X = Marginal utility of good Y/ Price of Y
This is the equi-marginal condition.