ECO 2013 UCF Exam 1 Spring 2026
1/127
There's no tags or description
Looks like no tags are added yet.
Name | Mastery | Learn | Test | Matching | Spaced | Call with Kai |
|---|
No analytics yet
Send a link to your students to track their progress
128 Terms
What is economics?
The study of how economic units make decisions under scarcity and the incentives that influence those decisions.
What is scarcity?
Limited quantities of resources to meet unlimited wants
What are resources?
The things used in making goods and providing services
What is opportunity cost?
The cost of the next best use of your time or money when you choose to do one thing rather than another
Explicit Costs
The actual payments a firm makes to its factors of production and other suppliers.
Implicit costs
Indirect, non-purchased, or opportunity costs of resources provided by the entrepreneur
Marginal Analysis
Analysis that involves comparing marginal benefits and marginal costs
Marginal benefit
The additional benefit to a consumer from consuming one more unit of a good or service
Marginal Cost
Extra cost of producing one additional unit of production.
What are incentives?
Things that motivate or incite, which are used to change economic behavior (Ex:coupons, profits)
What is a positive statement?
"What is"(it actually happens)
What is a normative statement?
"What should be"
Comparative Advantage
Ability of a country to produce a product at a lower opportunity cost than another country
Absolute Advantage
One can produce more of any good than someone else in a given time period
What is a Production Possibilities Frontier(PPF)?
A line or curve that shows all the possible combinations of two outputs that can be produced using all available sources
Which points on the PPF are feasible and efficient?
The points on the frontier line are feasible "attainable" points.
Which points on the PPF are feasible but not efficient?
The points inside the frontier
Which points on the PPF are not feasible?
Anything past the frontier line
How can we use the Production possibilities frontier to measure opportunity cost?
A PPF shows all the possible combinations of two goods, or two options available at one point in time.
Why is the PPF sometimes a straight line and sometimes bowed out?
If it is bowed, it reflects an increasing opportunity cost (it is not constant)
Why do people, firms, and countries specialize?
They will focus on economic activities best suited to their resources.
Efficiency
To produce more of one good, you must give up some of another good
What are the three components of a competitive market?
Free entry/exit, many buyers and sellers, homogenous goods
What is a market economy?
A system based on private ownership, free trade and competition
What is a market?
interaction between buyer and seller
What is a standardized good?
A good or service for which any two units of it have the same features and are interchangeable
What is a price taker?
A firm that has no control over the price they can charge for their product
What is quantity demanded?
Specific quantity that will be purchased at a specific or unique price
What is quantity supplied?
The amount of a good that sellers are willing and able to sell to the market
Who demands goods/services?
The demand for a good or service represents the willingness and ability of buyers or consumers to purchase goods and services.
What is a demand curve?
shows the relationship between price and quantity demanded.
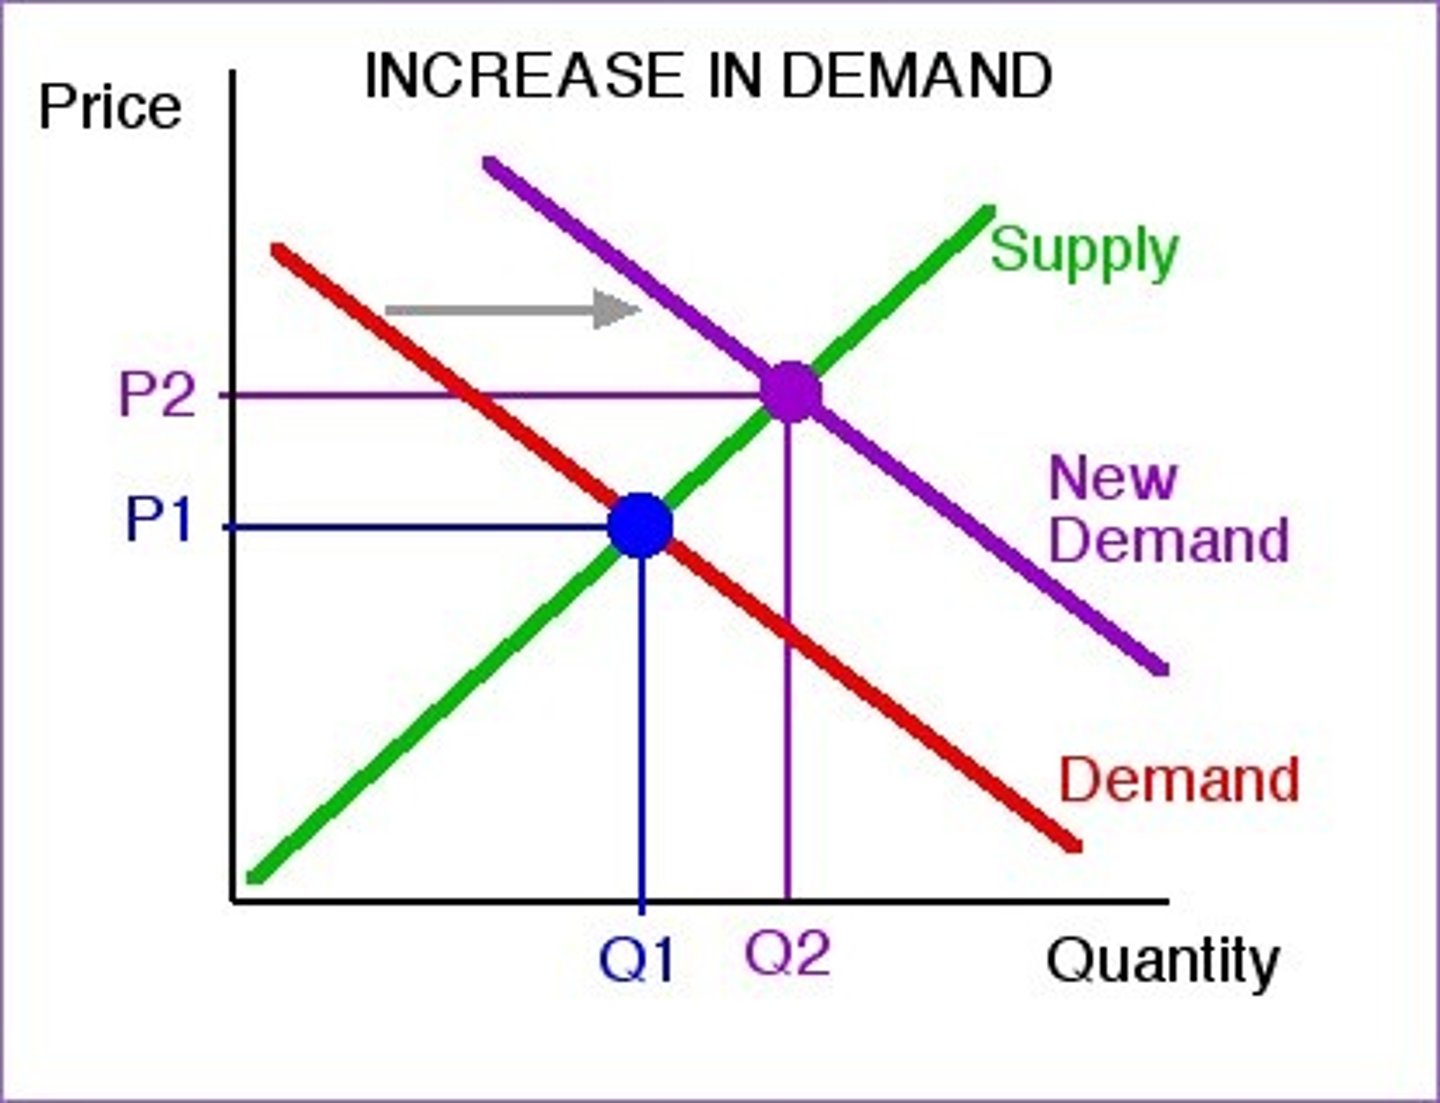
What is the law of demand?
When Price FALLS, quantity of Demand RISES
What are substitute goods?
can be used in place of another price and demand are directly relate
What are complements?
Two goods for which an increase in the price of one leads to a decrease in the demand for the other
What are normal goods?
When incomes change, demand will also change in the SAME way
What are inferior goods?
When income increases, demand decreases
Factors that shift demand curves
Non-price determinants: consumer preferences, prices of related goods (substitute and complimentary goods), incomes (normal and inferior goods), expectations, number of buyers
What is a supply curve?
A graph showing how much of a product will sell at different prices
What is the law of supply?
When Price RISES, quantity of supply RISES
Factors that shift supply curves?
Number of sellers, productivity, cost of inputs, expectations, weather, price of related goods
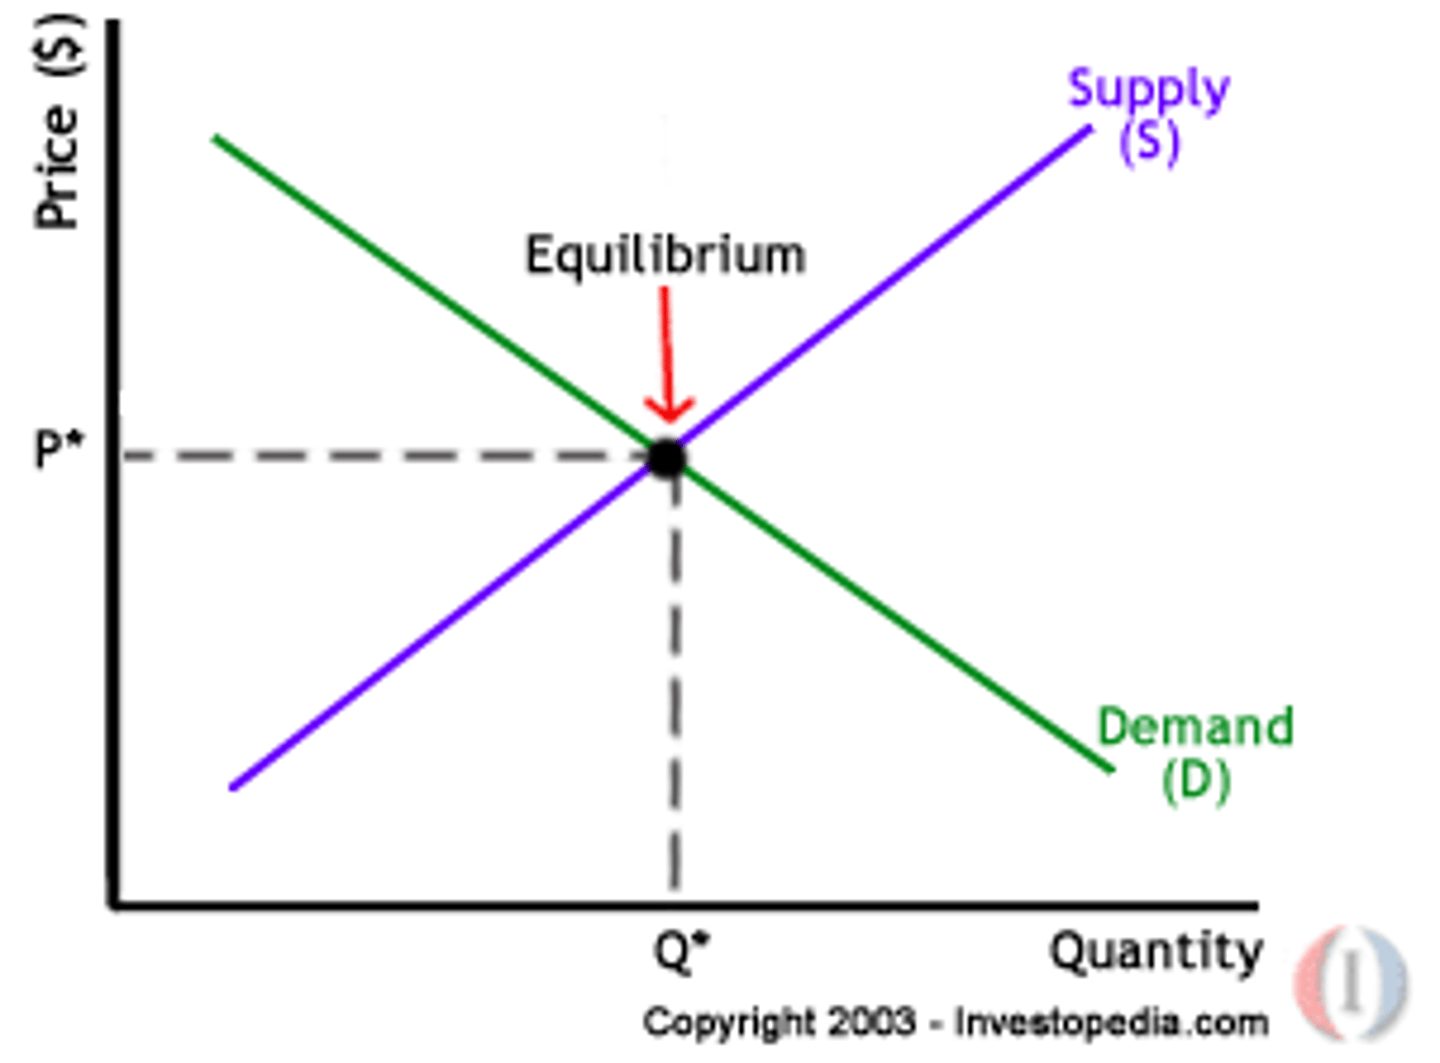
What is equilibrium?
The price of which the amount producers are willing to supply is equal to the amount consumers are willing to buy
How do we find equilibrium price and quantity?
At the intersection of the supply and demand curves
What does movement along a demand curve mean?
a change in market price
What does movement along a supply curve mean?
a change in market price
What does a shift along a demand curve mean?
The quantity demanded is affected by something other than price
What does a shift along a supply curve mean?
The quantity supplied is affected by something other than price
What role do households play in the market?
Supply factors of production, receive incomes, and demand goods/services
What role do firms play in the market?
They demand factors of production, pay income, and supply goods/services
Property Rights
The ability of an individual to own and exercise control over scarce resources
Shortage
Quantity demanded is greater than quantity supplied
Surplus
Quantity supplied is greater than quantity demanded
Does a production possibilities frontier (PPF) identify different combinations of goods that can be produced at the same cost?
False
What does a PPF show?
Combinations that can be produced with given resources and technology.
Are points on the PPF feasible and efficient?
True
What does the slope of the PPF measure?
Opportunity cost
Is the PPF a straight line if there are increasing opportunity costs?
False
What shape does the PPF take with increasing opportunity costs?
Bowed-out/curved
Is trade determined by comparative advantage?
True
Can you produce at a point outside the PPF with existing resources?
False
What happens to points outside the PPF?
They are currently unattainable unless resources or technology improve.
What characteristics define a competitive market?
has:
Many buyers and sellers
Identical (or very similar) products
Buyers and sellers are price takers (cannot control price)
Free entry and exit
What causes a movement along the demand curve?
A change in the good's own price.
What causes a shift of the demand curve?
Anything that changes demand other than the good's price, such as income, prices of related goods, tastes/preferences, expectations, and number of buyers.
What causes a movement along the supply curve?
A change in the good's own price.
What causes a shift of the supply curve?
Anything that changes supply other than the good's price, such as input costs, technology, taxes/subsidies, expectations, and number of sellers.
market equilibrium
Illustrate An increase in demand
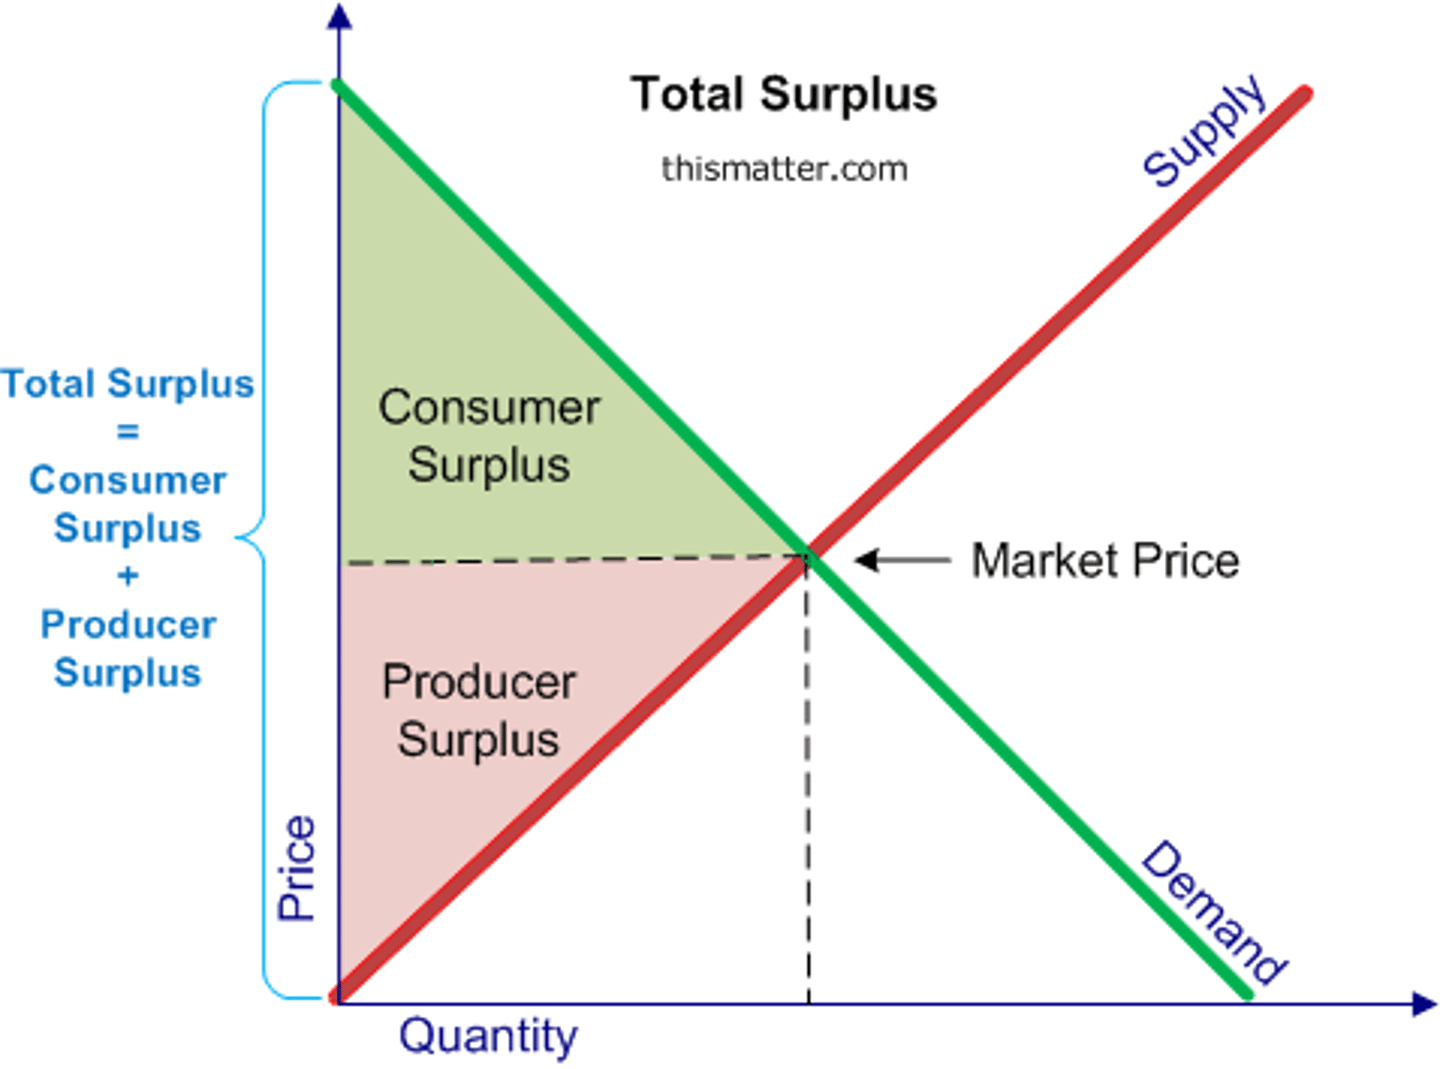
consumer surplus vs producer surplus
Optimal Decision Rule
A principle stating that an action should be taken if the marginal benefit exceeds the marginal cost.
Cost-Benefit Analysis
A systematic approach to estimating the strengths and weaknesses of alternatives in order to determine the best option.
Decision-Making Process
A series of steps taken to identify and choose alternatives based on values and preferences.
Correlation
A relationship between two variables where they move together.
Causation
When one event directly causes another event to occur.
Model
A simplified representation of reality used to explain or predict economic behavior.
Circular Flow Model
A model that shows how money, goods, and resources flow between households and firms in an economy.
Factor of Production
Resources used to produce goods and services.
Revenue
The total income a firm receives from selling goods or services.
Categories of Income (in Economics)
Wages, Rent, Interest, Profit.
Revenue Formula
Revenue = Price × Quantity Sold.
What is the beneficial rate of exchange?
The price at which two parties agree to trade that makes both sides better off.
What must the beneficial rate of exchange fall between?
The opportunity costs of the two traders.
Provide an example of a beneficial trade rate.
A trade rate of 1 apple for 3 oranges benefits both parties if one gives up 1 apple for 2 oranges and the other for 4 oranges.
What are gains from trade?
The benefits each party receives by specializing in what they have a comparative advantage in and then trading.
List three advantages of trade.
1. More total production 2. Lower opportunity costs 3. Higher overall consumption
What happens to the equilibrium price when both demand and supply increase?
Uncertain
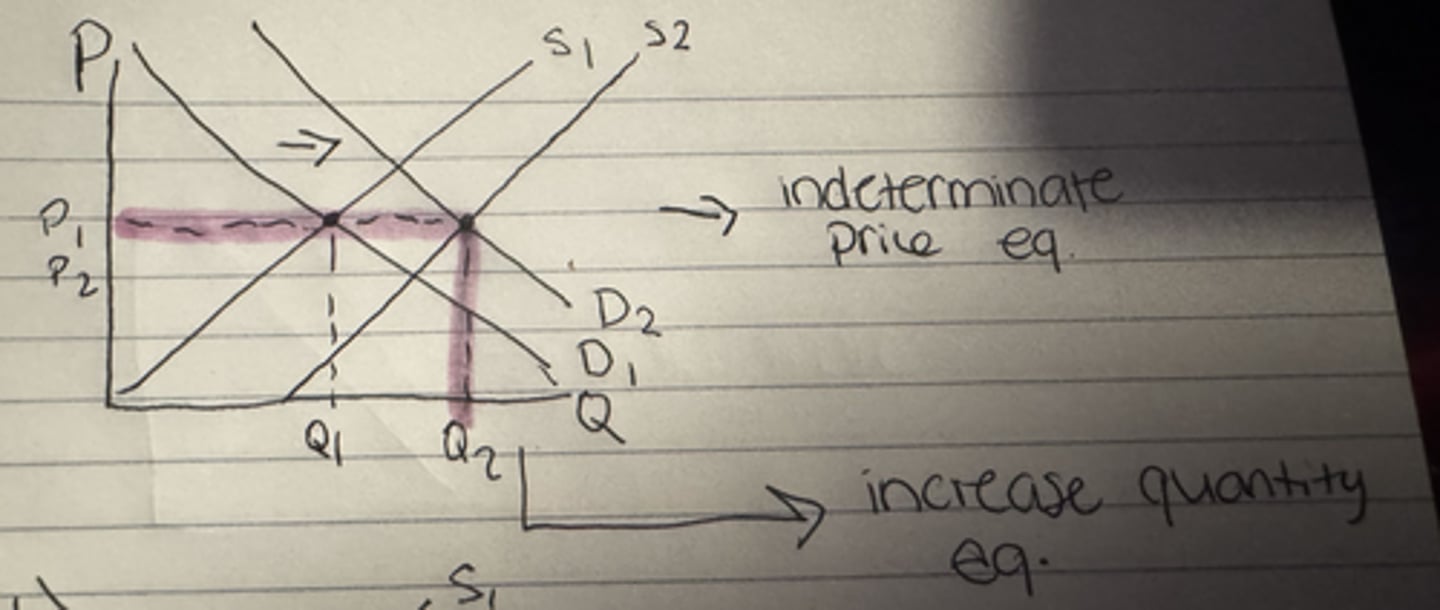
What happens to the equilibrium quantity when both demand and supply increase?
Increase

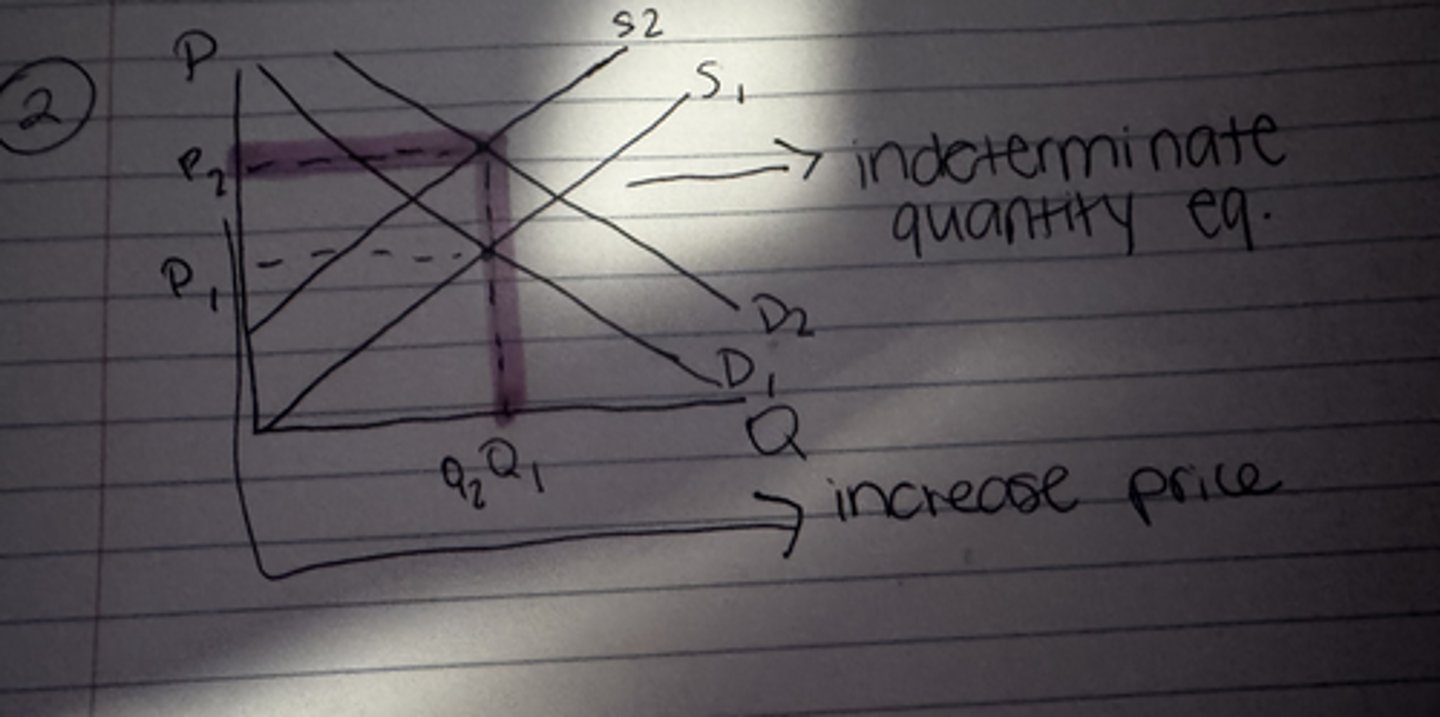
What happens to the equilibrium price when demand increases and supply decreases?
Increase

What happens to the equilibrium quantity when demand increases and supply decreases?
Uncertain
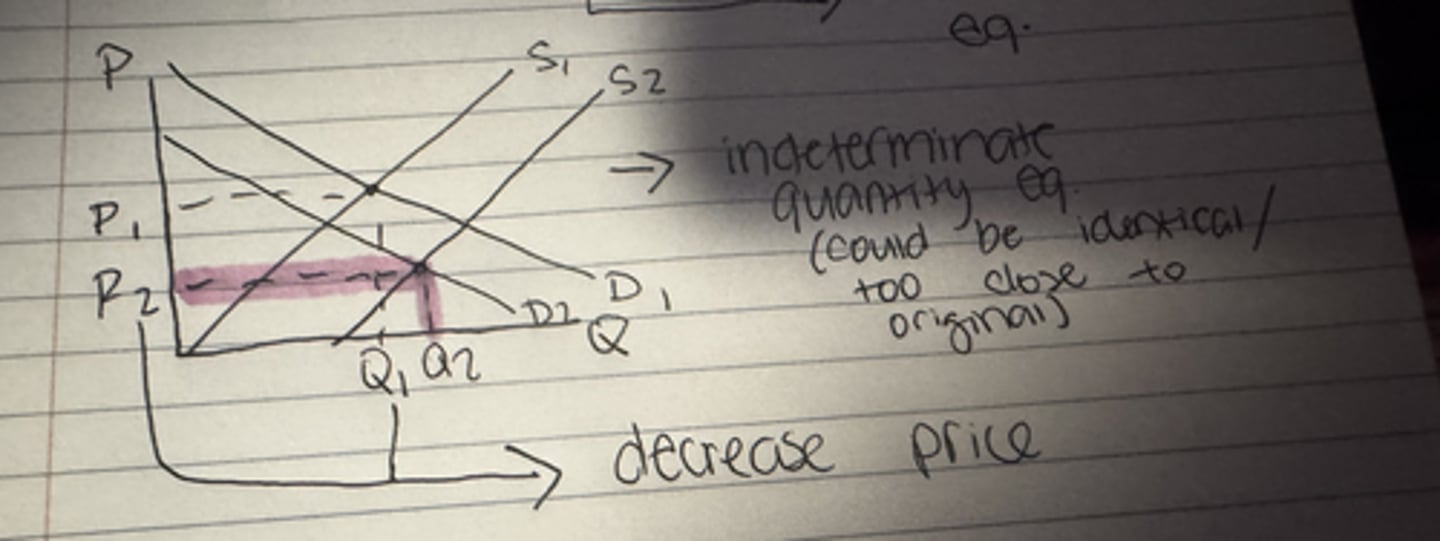
What happens to the equilibrium price when demand decreases and supply increases?
Decrease

What happens to the equilibrium quantity when demand decreases and supply increases?
Uncertain
What happens to the equilibrium price when both demand and supply decrease?
Uncertain
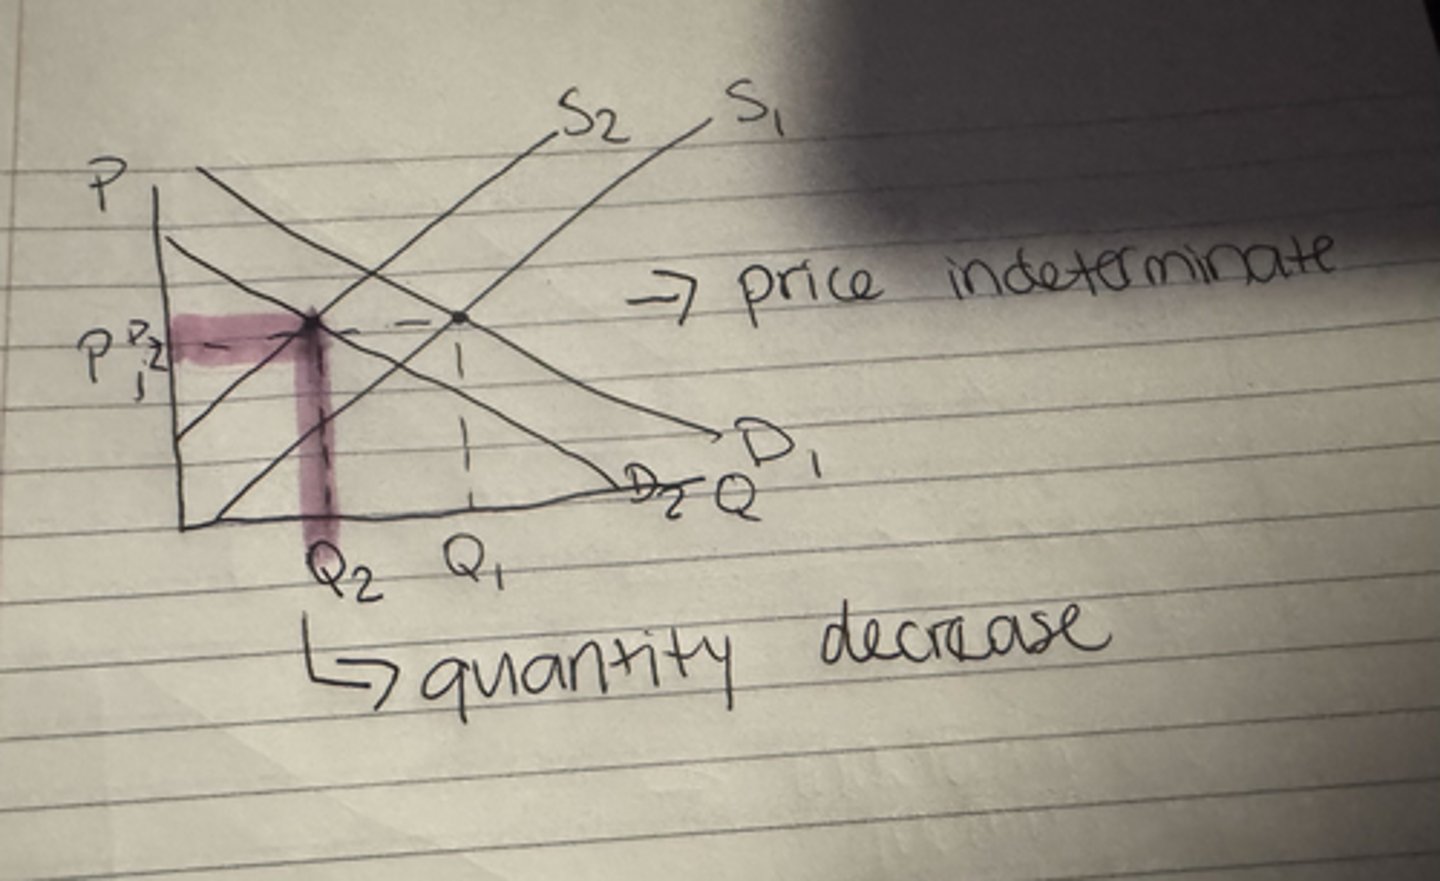
What happens to the equilibrium quantity when both demand and supply decrease?
Decrease

(EXAMPLE QUESTION) What happens to the equilibrium price and equilibrium quantity of jelly when the cost of producing peanuts decreases?
Both the equilibrium price and equilibrium quantity increase.
(The new farming technology will lead to a decrease in the price of peanut butter. The decrease in the price of peanut butter, a complement of jelly, leads to an increase in the demand for jelly.)
Marginal Analysis
Hours Customers
0 40
1 60
2 75
3 88
4 98
5 105
• Customers spend $10 each
• Total customers given
• Cost $100/hr for advertising
What is the marginal cost for advertising 1 hour?
$100
Marginal Analysis
Hours Customers
0 40
1 60
2 75
3 88
4 98
5 105
• Customers spend $10 each
• Total customers given
• Cost $100/hr for advertising
Marginal benefit advertising 1 hour?
20 extra customers (from 40 to 60) x $10 = $200
Marginal Analysis
Hours Customers
0 40
1 60
2 75
3 88
4 98
5 105
• Customers spend $10 each
• Total customers given
• Cost $100/hr for advertising
How many hours are optimal?
4 hours
(• MB = $100 and MC = $100
Compare:
Hour 1: $200 > $100 ✔
Hour 2: $150 > $100 ✔
Hour 3: $130 > $100 ✔
Hour 4: $100 = $100 ✔
Hour 5: $70 < $100 ✘)
The data in the table identifies three points on a production possibilities frontier:
Rice Coconuts
A 1,600 250
B 1,200 450
C 800 600
According to the table, the opportunity cost of producing more coconuts is
a. constant. b. increasing. c. decreasing.
increasing
(Opp. Cost 1 Rice Opp. Cost 1 Coconut
A - B: 200/400 = 0.5 400/200 = 2
B - C: 150/400 = 0.375 400/150 = 2.67)
Country A's opportunity cost of producing 1 pie is 2 cakes. Country B's opportunity cost of producing 1 pie is 3 cakes. A beneficial rate of exchange that would make both countries BETTER off is
a. 1 pie for 1 cake.
b. 1 pie for 3 cakes.
c. 2 pies for 3 cakes.
d. 2 pies for 5 cakes.
d. 2 pies for 5 cakes
(Country A: 1 pie = 2 cakes
Country B: 1 pie = 3 cakes
Country A has the lower opportunity cost, so:
Country A has the comparative advantage in pies
Country B has the comparative advantage in cakes
For both countries to benefit, the trade rate must be:
Between 2 cakes and 3 cakes per pie
So the acceptable range is:
2 cakes < 1 pie < 3 cakes)
When Country A increases production of good X from 100 to 200 units, its production of good Y falls from 600 to 300. The opportunity cost of producing each extra unit of good X is equal to
a. 1/3 unit of good Y.
b. 3 units of good Y.
c. 300 units of good Y.
d. 2 units of good Y.
b. 3 units of good Y
(Production of X:
100 → 200
Increase of 100 units of X
Production of Y:
600 → 300
Decrease of 300 units of Y
Opportunity cost
300/100 = 3)
The following two points are on the production possibilities frontier:
A: 100 cars and 60 computers
B: 150 cars and 30 computers
The opportunity cost of producing one car is?
a. 30 computers
b. 3/5 of a computer
c. 5/3 of a computer
d. 1/5 of a computer
b. 3/5 of a computer
(100 → 150
Increase of 50 cars
Computers:
60 → 30
Decrease of 30 computers
30/50= 3/5)