Understanding Resting Metabolic Rate and Energy Expenditure
1/187
There's no tags or description
Looks like no tags are added yet.
Name | Mastery | Learn | Test | Matching | Spaced |
|---|
No study sessions yet.
188 Terms
Resting Metabolic Rate (RMR)
Lowest energy expenditure at rest for physiological functions.
Energy Expenditure
Total energy used by the body over time.
RMR Expression
Measured in kcal/min or kcal/day.
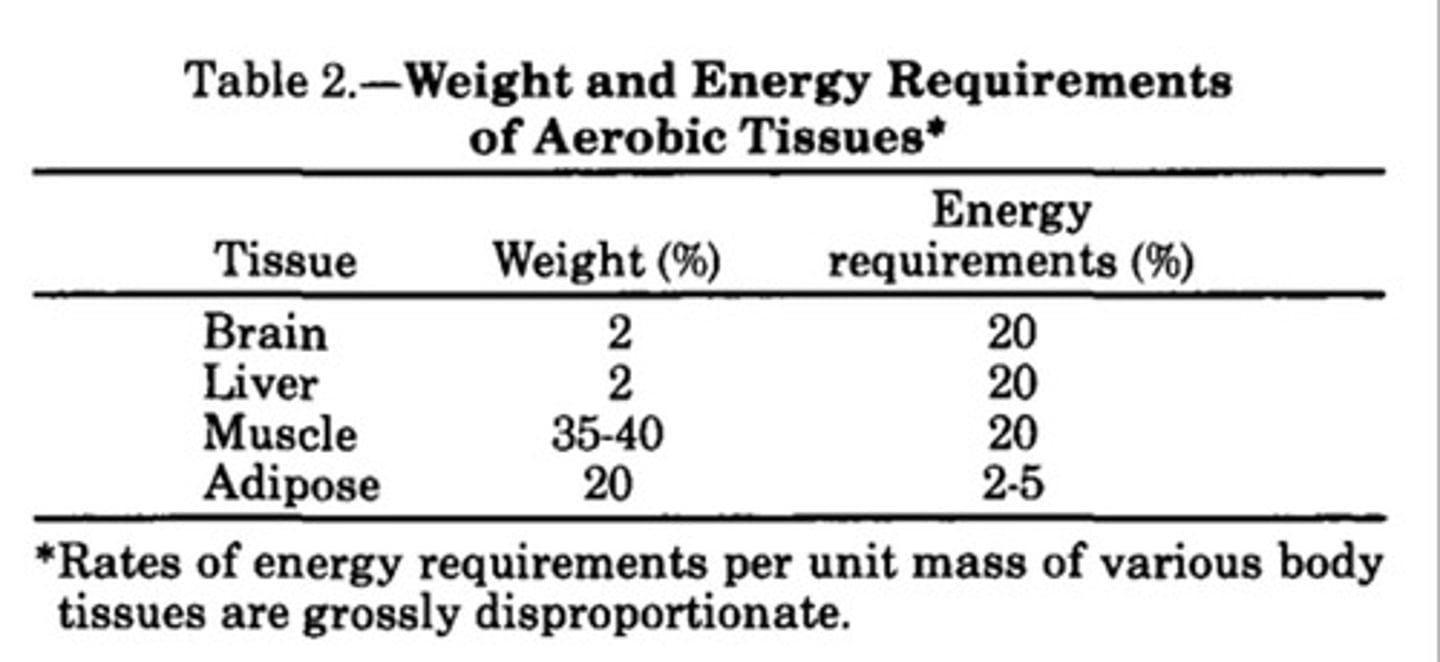
Liver and Brain Contribution
4-5% body weight, 40% of RMR.
Total Daily Energy Expenditure
Sum of RMR, physical activity, and thermic effect.
RMR Percentage
66% of total daily energy expenditure.
Physical Activity Contribution
23% of total daily energy expenditure.
Sedentary Energy Expenditure
300-800 kcals/day for inactive individuals.
Thermic Effect of Food
10% of total ingested calories.
RMR for Males
1.11 to 1.32 kcal/min during activity.
RMR for Females
~0.833 to 1.04 kcal/min during activity.
Optimal Exercise Recommendation
200-400 kcals/day for health benefits.
Moderate Exercise RMR Elevation
Elevates RMR for ~20-30 mins post-exercise.
RMR Increase from Resistance Training
Can increase RMR by ~5% after 9 months.
Factors Influencing RMR
Includes exercise, age, food intake, and testing time.
Age Impact on RMR
RMR decreases with age, especially after 40.
Muscle Loss Rate
3-5% muscle mass loss per decade post-40.
Hormonal Influence on Muscle
Decreased hormones affect muscle anabolism.
Testing Time Influence
RMR varies between morning and afternoon tests.
RMR Testing Procedures
Requires fasting and abstaining from stimulants.
Afternoon RMR Comparison
Afternoon RMR ~100 kcals higher than morning.
Thermic Effect Measurement
Minimal effect on RMR by 4 hours post-meal.
Food Composition Impact
Varies thermic effect based on meal size.
Rest Period
15 minutes of calm, quiet resting required.
Midday Meal
500 ± 200 kcal meal allowed.
Record Intake
Document all food and beverage consumed daily.
Future Tests Timing
Conduct tests within same 4-hour period.
Temperature Range
Maintain temperature between 21-24° Celsius.
Measurement Duration
Temperature measurement lasts at least 15 minutes.
Acclimation Period
Discard first 5 minutes of temperature measurement.
Oxygen Fluctuation
Should be less than 10% during measurement.
RER
Respiratory exchange ratio should be less than 5.
RMR Estimation
Estimates fall within ± 10% of lab values.
Harris-Benedict Equation
Used to estimate basal metabolic rate (BMR).
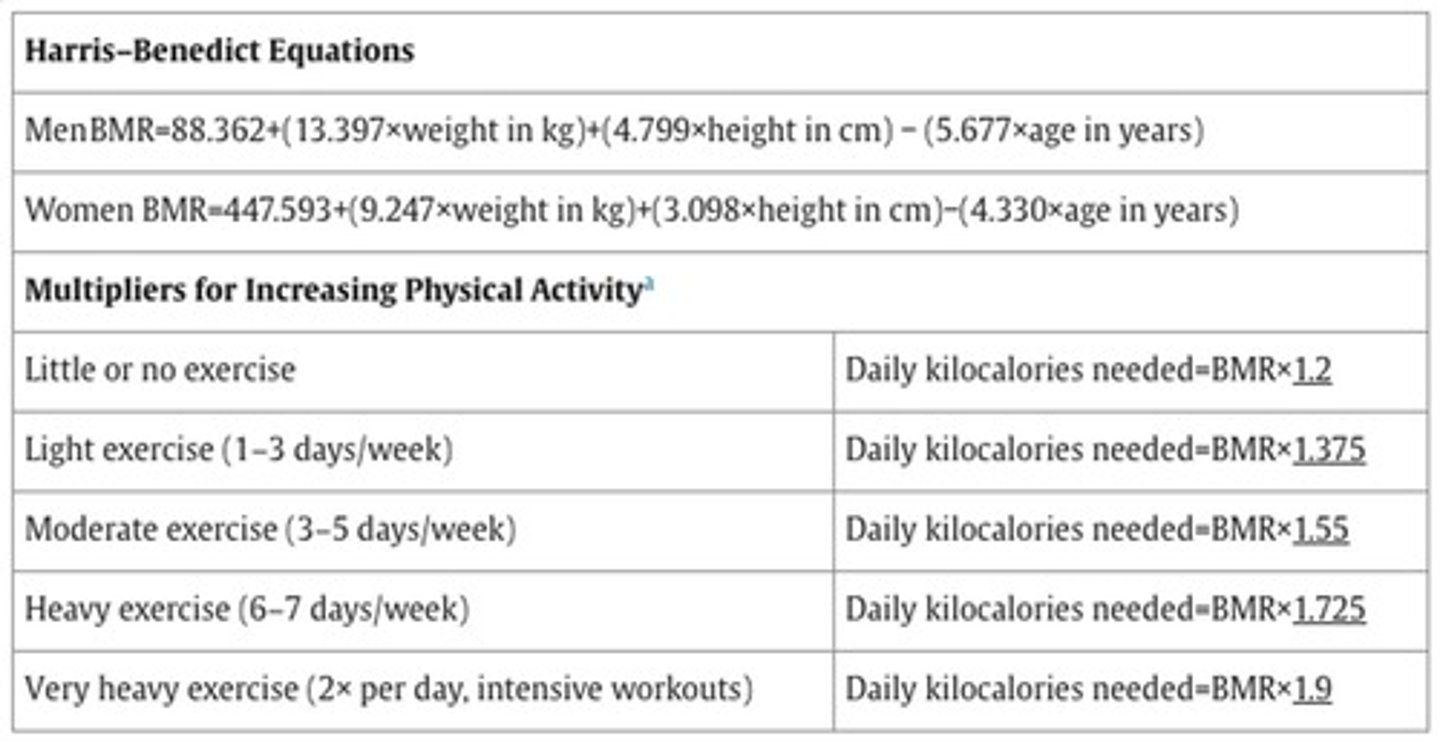
Basal Metabolic Rate
Typically 5-10% lower than resting metabolic rate.
Activity Level Multiplier
BMR multiplied by activity level for kcal needs.
Contractile Hypertrophy
Increase in dry lean mass and skeletal muscle mass.
Sarcoplasmic Hypertrophy
Increase in skeletal muscle mass and intracellular water.
In-series Hypertrophy
Increase in lean mass with minimal size change.
Standard Error of Estimate
Accuracy estimation of prediction, about 3.5%.
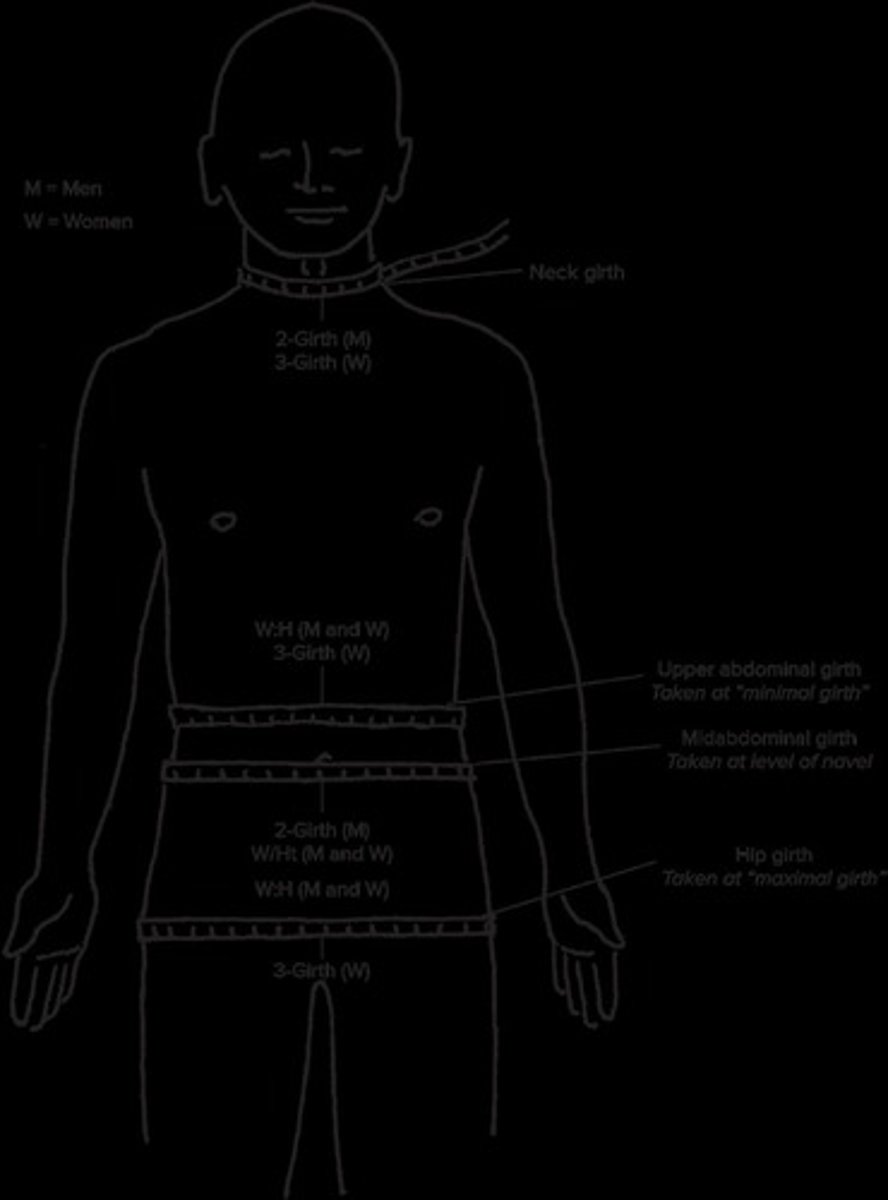
Girth Measurement Correlation
Strong correlation with hydrostatic weighing (r = 0.85-0.90).
2-Girth Method
Used for men, includes neck and mid-abdominal girth.
3-Girth Method
Used for women, includes neck, upper-abdominal, hip girth.
Body Density Calculation
Density = Body Mass / Body Volume.
Underwater Weighing (UWW)
Method to determine body density via water displacement.
Hydration Impact
1-2 kg change affects body fat percentage estimation.
Participant Preparation
Fasting for 3-4 hours recommended before testing.
Hyperhydration status
Increase in body fat percentage (%BF).
Underwater Weighing (UWW)
Method for measuring body composition underwater.
Participant instructions
Change into swimsuit, void bladder and bowels.
Calibration weight
4.08 kg weight used for UWW calibration.
Body Volume (BV)
Volume of air displaced equals body volume.
Air Displacement Plethysmography (ADP)
Measures body volume via air pressure changes.
Boyle's Law
P1ᐧP2 = V2ᐧV1, relates pressure and volume.
SIRI equation
%BF = (495/body density) - 450.
Sources of Error
Factors affecting accuracy of body composition tests.
Fasted state testing
Testing after fasting improves accuracy.
Dehydration effect
Underestimates %BF by 1.1%.
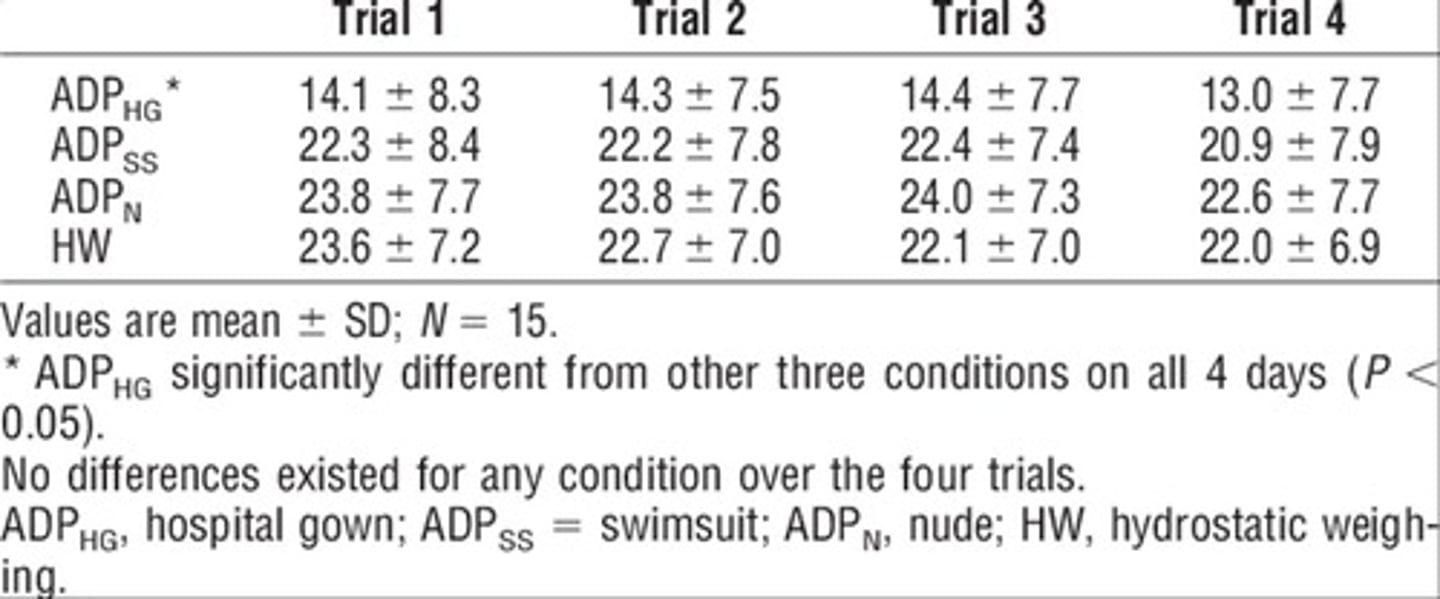
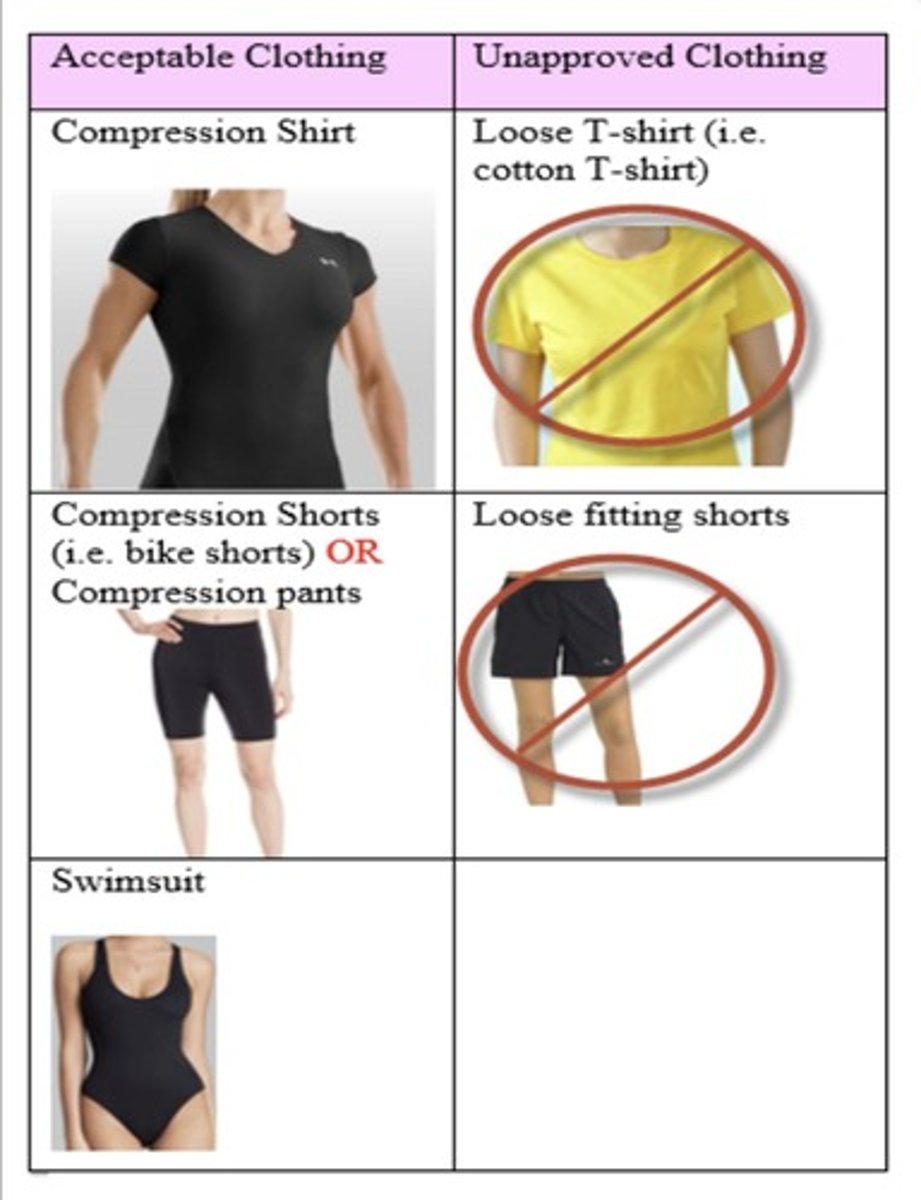
Clothing effects
Wearing clothing can lower %BF measurement.
Isothermal effects
Air trapped in clothing affects body volume.
Body moisture impact
Increases isothermal air, underestimating body volume.
Testing standardization
Consistent conditions improve testing reliability.
Form-fitting apparel
Swimsuits recommended for accurate body measurements.
Food consumption protocols
Avoid calorie-containing foods 4 hours prior.
BOD POD testing
Uses air displacement to measure body composition.
Two-point calibration
Baseline and cylinder calibration for BOD POD.
Testing conditions
Optimal conditions enhance testing accuracy.
Measurement disagreement
More than 150 mL difference requires retest.
Participant motivation
Well-motivated individuals yield better test results.
Testing time consistency
Test at same time for reliable results.
Circadian Rhythms
Biological processes following a 24-hour cycle.
Peak Performance Hours
Optimal performance occurs between 4-8 PM.
Muscle Strength
Maximum force exerted by muscles during contraction.
Tendon Stiffness
Resistance of tendons to deformation under load.
Aerobic Contribution
Energy production through oxygen-dependent pathways.
Training Time Synchronization
Improved performance from training at the same time.
Cold-Water Immersion
Reduces core temperature, affecting performance.
Environmental Temperature Effects
Hot conditions can counteract cold immersion effects.
Active Warm-Up
Increases body temperature before physical activity.
Testing Order
Sequence of fitness tests based on recovery needs.
Resting Tests
Includes anthropometrics, body composition, and flexibility.
Skill-Based Tests
Includes jumps, agility, and sprints.
Maximal Strength Tests
Measures dynamic and isometric strength levels.
Muscular Endurance Tests
Evaluates performance over >10 repetitions.
Anaerobic Testing
Assesses short-duration, high-intensity efforts.
Aerobic Testing
Measures endurance through prolonged exercise.
Gold Standard Equipment
Preferred tools for accurate fitness assessment.
Measurement Error
Variability in results from testing equipment.
Peak Power (PP)
Highest power level achieved in a test.
Mean Power (MP)
Average power output over a specified duration.
Fatigue Index (FI)
Percentage decrease in power from peak to end.
Reliability Coefficient
Consistency of test results across multiple trials.
WAnT Methods
Protocols for Wingate Anaerobic Test execution.
Warm-up
Initial 5-min preparation before cycling test.
RPM
Revolutions per minute; cycling speed measurement.
Peak Power
Maximum power output achieved during the test.
Mean Power
Average power output over the test duration.
Fatigue Index
Percentage indicating performance drop-off over time.
Active Recovery
Low-intensity cycling to aid recovery between sprints.
Cool-down
Post-exercise phase to gradually lower intensity.