2a. Understanding Business Performance - Using Quantitative Data To Make Business Decisions
1/9
Earn XP
Description and Tags
Name | Mastery | Learn | Test | Matching | Spaced |
|---|
No study sessions yet.
10 Terms
What is quantitative data?
Statistical numeric data that can be used to support decisions making. It needs to be accurate and interpreted correctly if it is to be useful. It may be collected from primary or secondary sources
What are the ways quantitative data can be collected?
Primary data - information collected first hand for a specific purpose
Secondary data - information that has been collected previously by someone else for a different purpose
What are sources of quantitative data?
Graphs and charts
Financial data
Marketing data
Tables or infographics (a visual representation of quantitative data in a way that makes the info interesting and easy to understand)
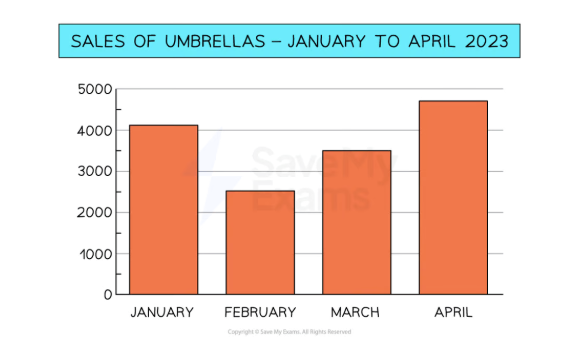
What is a bar chart?
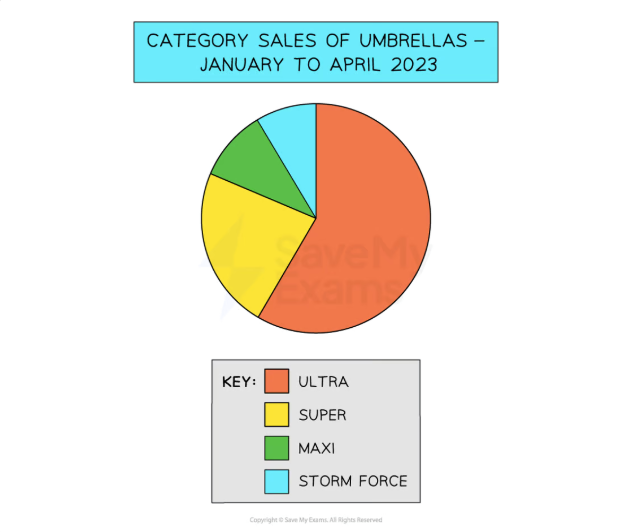
What is a pie chart?
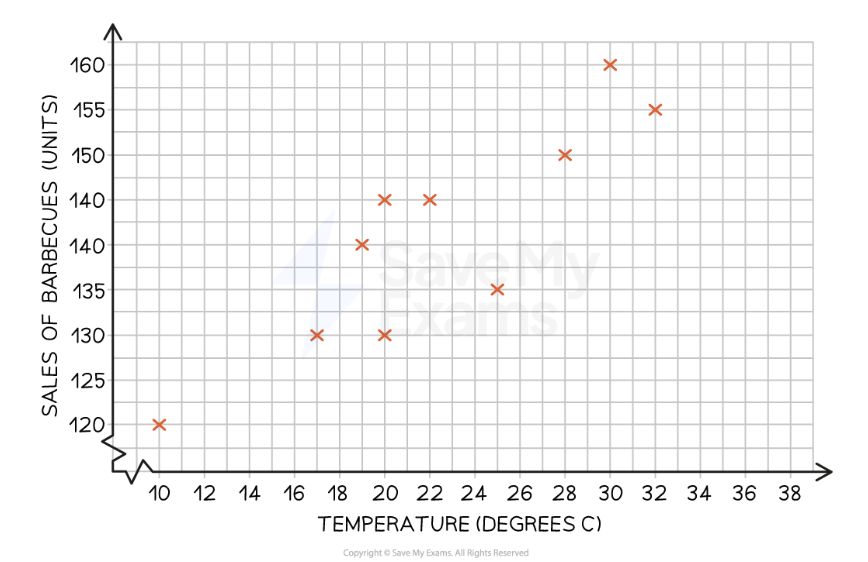
What is a scatter graph?
It allows a relationship between two variables to be identified
Positive correlation - when an increase in one variable leads to an increase in another; an upward trend
Negative correlation - when an increase in one variable leads to a decrease in another; downwards trend
Correlation may be strong or weak:
Strong - allows a ling of best fit to be applied with ease
Weak - exists if it’s difficult to identify a line of best fit
What is financial data?
Used to support decision making including:
Sales revenue
Profit
Costs
Tax
Interest and exchange rates
Valuations of assets
Bank balances
Companies need to send key financial data to Companies House each year whereas sole traders and partnerships may keep this information private
What is marketing data?
Collected through primary and secondary market research
Surveys
Focus groups
Observation
Customer feedback
Retail or online footfall
Government or trade publications
The media
Marketing data can help business managers forecast sales and to make decisions about product development and promotional plans
What is market data?
The characteristics and performance of the market in which a business operates such as:
Demographic data - the market’s population structure such as age, gender and income statistics
Market dimensions - factors such as the size of the market, the market shares of key competitors, the rate of the market growth and average prices across the market
Investment data - the prices of materials (e.g. oil) as well as exchange rate data and stock market performance
How can market data help a business?
Market data can help a business identify and plan for new opportunities and spot external threats, such as the increased power of a competitor. It can also be used alongside other types of quantitative data to make investment decisions