Psychology Unit 0
1/71
There's no tags or description
Looks like no tags are added yet.
Name | Mastery | Learn | Test | Matching | Spaced | Call with Kai |
|---|
No analytics yet
Send a link to your students to track their progress
72 Terms
Hindsight bias
A common tendency for people to perceive past events as more predictable than they actually were.
Confirmation Bias
A tendency to search for information that confirms one's preconceptions.
Overconfidence
The tendency to be more confident than correct - to overestimate the accuracy of our beliefs and judgments.
Peer review
An evaluation process where scholars or researchers assess each other's work before it gets published.
Hypothesis
A testable prediction, often implied by a theory.
Falsifiable
something can be proven wrong, or tested and verified by observation or experiment
Operational Definition
The definition of a concept in terms of the actual procedures used by the researcher to measure it.
Replication
Repeating the essence of a research study, usually with different participants in different situations, to see whether the basic finding extends to other participants and circumstances.
Survey
Obtaining self-reported attitudes or behaviors of a group, usually through questioning a random sample.
Social desirability bias
A type of response bias in which people answer questions in a way they believe will be viewed favorably by others, rather than how they truly feel or behave.
Self-report bias
A methodological problem that arises when researchers rely on asking people to describe their thoughts, feelings, or behaviors rather than measuring these directly and objectively.
Experimenter Bias
The unconscious tendency for researchers to treat members of the experimental and control groups differently to increase the chance of confirming their hypothesis.
Population
All individuals who can potentially participate in the study.
Random Sample
A sample that fairly represents a population because each member has an equal chance of inclusion.
Sample
A smaller group of individuals that are selected from a larger population in order to represent and generalize findings about the entire population.
Sampling Bias
A flawed sampling process that produces an unrepresentative sample.
Convenience Sampling
A non-probability sampling method that involves selecting a sample of individuals or cases based on their availability or proximity to the researcher.
Representative Sample
A sample that has the characteristics that are similar to those in the population.
Case Study
Studying one person or group in-depth in hope of revealing universal principles.
Naturalistic Observation
Observing and recording behavior in natural situations without trying to manipulate or control the situation.
Meta-Analysis
Process of analyzing the results of many studies that have measured the same variables.
Experiment
Measuring the extent to which two factors vary together and how well one factor can predict the other.
Correlation
statistical relationship between two variables
Experimental Methodology
Type of research method where the researcher manipulates one variable (independent variable) to determine its effect on another variable (dependent variable).
Non-Experimental Methodology
Research that lacks the manipulation of an independent variable.
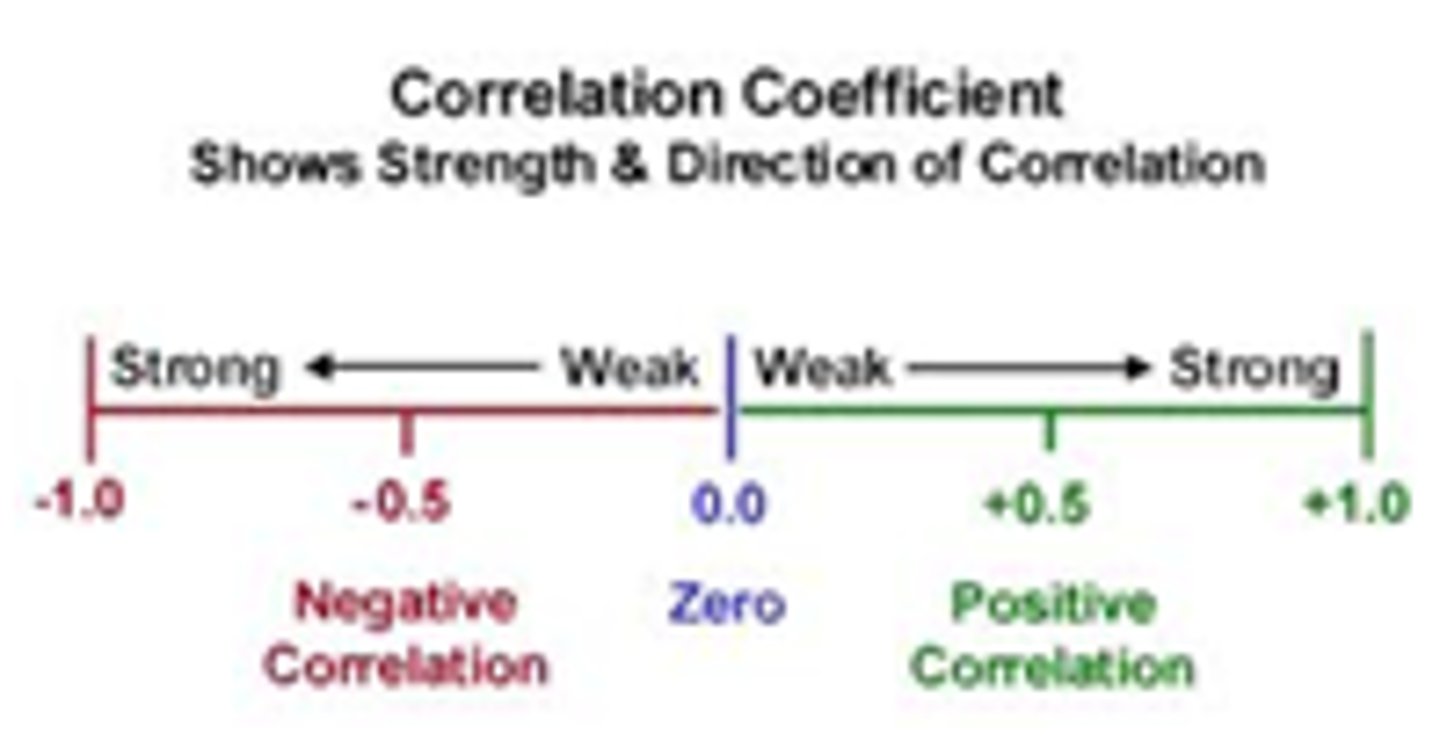
Correlation coefficient
A number (symbolized by r) between −1 and +1, which represents the strength and direction of the correlation between two variables.
Directionality Problem
A limitation of correlational research that occurs when it's unclear which variable is causing the other.
Third Variable Problem
A type of confounding variable in which a third variable causes two other variables to appear causally related when they are not.
Regression Toward the Mean
The tendency for extreme scores to become more moderate, or closer to the mean, when retested over time.
Experimental Group
The group in an experiment that receives the variable being tested.
Control Group
In an experiment, the group that was not exposed to the treatment. Serves as a comparison for evaluating the effect of the treatment.
Independent variable (IV)
Variable that the experimenter manipulates --- Cause (what you are studying). (x-axis)
Dependent variable (DV)
Variable that researchers measure --- Effect (result of experiment). (y-axis)
Random assignment
Ensures all members of the sample have an equal chance of being placed into either group.
Single Blind
participants don't know whether they are in the experimental or control group (the researcher does).
Double blind
The subjects and the researchers do not know which group they belong to (either experimental or control group).
Placebo effect
A real response to an action or substance based solely on expectations, not actual properties of the action or substance.
Confounding Variable
A factor other than the independent variable that might produce an effect.
What is informed consent?
Participants sign indicating they understand the components and the potential risks of the study and agree to take part.
What do participants do to show they agree to take part in a study?
Participants sign to indicate their understanding of the study components and potential risks.
Protect from Harm
An ethical principle that ensures that research participants are not subjected to physical or psychological harm.
Confidentiality
The experimenters will not release any information about subjects without their consent.
Debriefing
Must debrief the participants by explaining the deception at the conclusion of the study.
Quantitative Research
An approach used in psychology to collect and analyze numerical data.
Qualitative Research
Rely on observations and descriptions.
Likert Scales
A numerical scale used to assess attitudes; includes a set of possible answers with labeled anchors on each extreme.
Institutional Review Board (IRB)
A committee that reviews, approves, and monitors biomedical and behavioral research conducted on humans.
Research Confederates
Person who participates in an experiment but is not the focus of the researcher's observation.
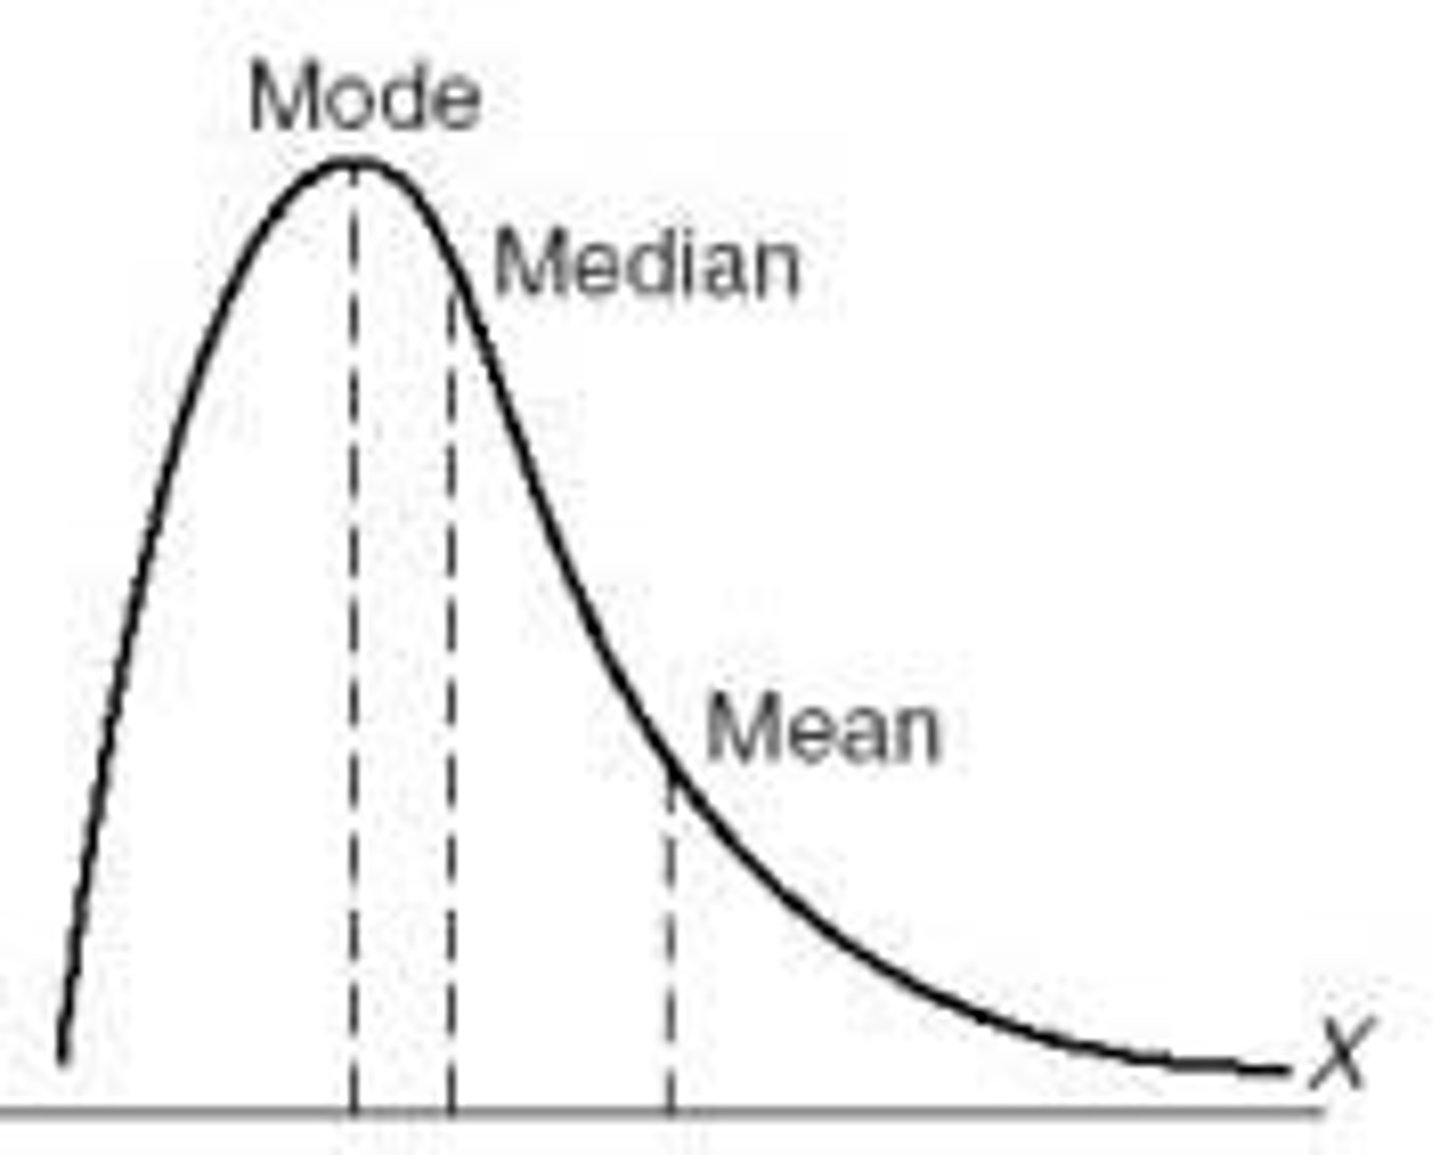
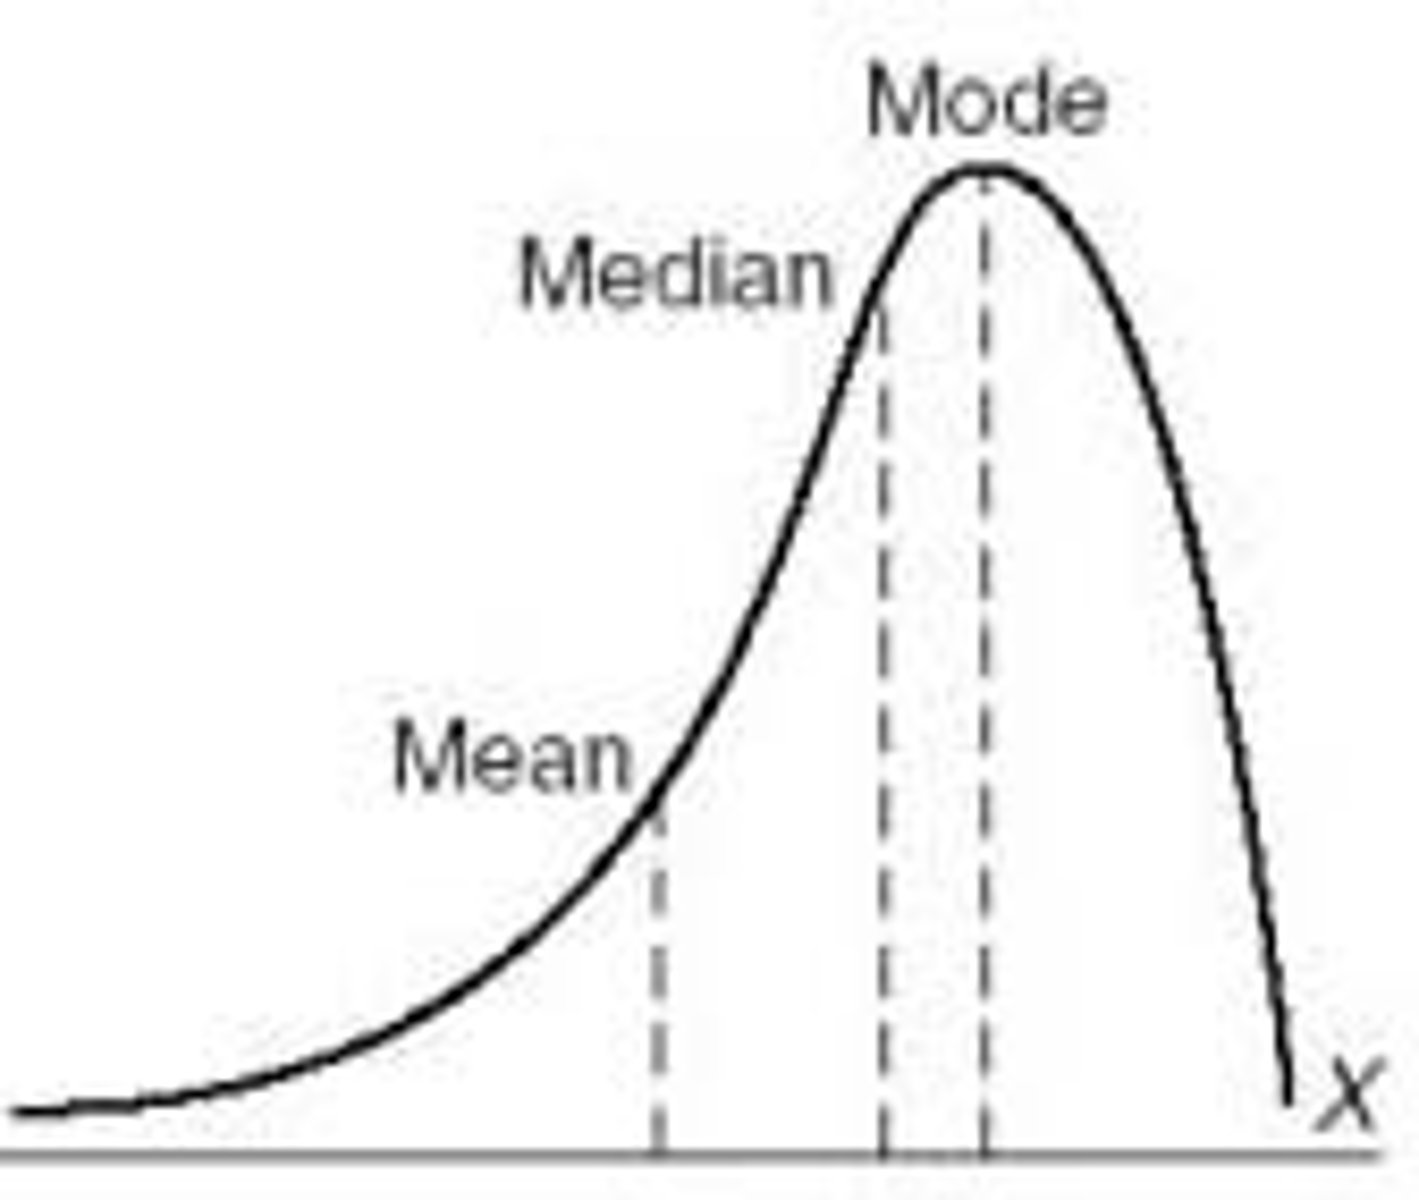
Mean
The arithmetic average of a distribution, obtained by adding the scores and dividing by the number of scores.
Median
The middle score in a distribution; half the scores are above it and half are below it.
Mode
The most frequently occurring score in a distribution.
Percentile Rank
The percentage of scores in a distribution that fall below a particular score.
Skewed Distribution
A representation of scores that lack symmetry around their average value.
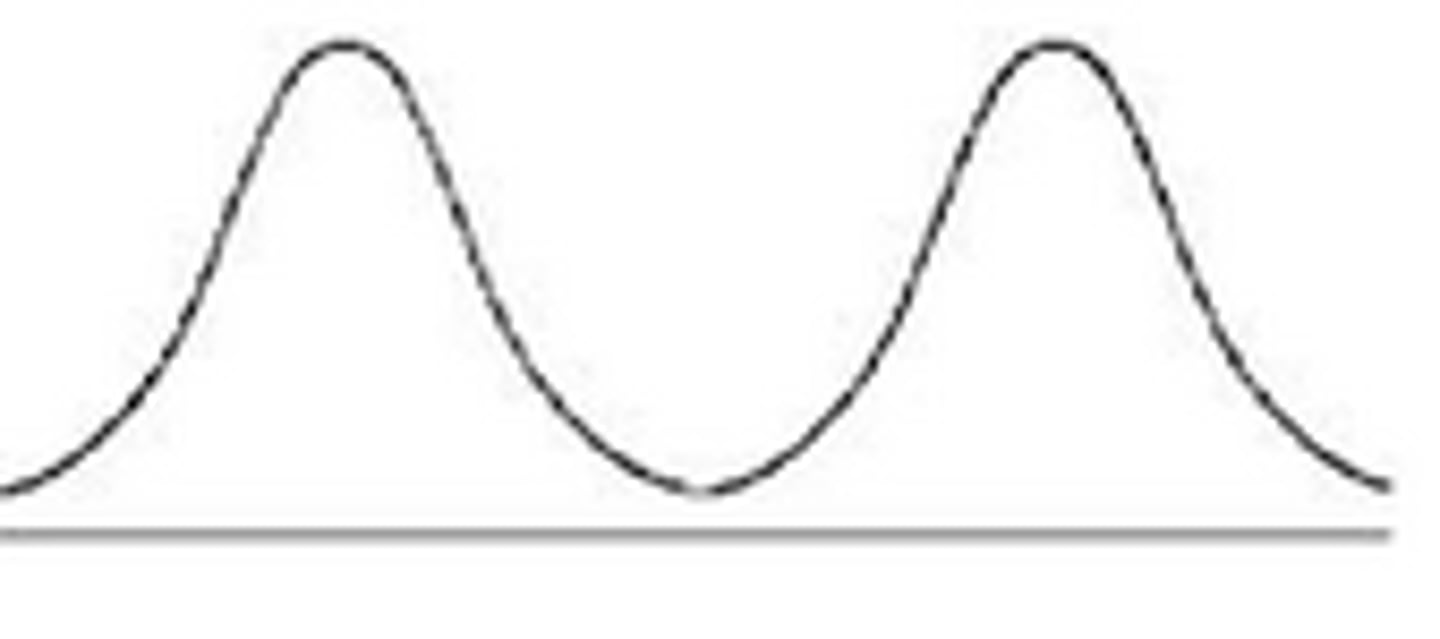
Bimodal Distribution
Data distribution with two Peaks.
Range
The difference between the highest and lowest scores in a distribution.
Standard Deviation
A computed measure of how much scores vary around the mean score.
Normal Curve
The symmetrical, bell-shaped curve that describes the distribution of many physical and psychological attributes.
Statistical significance
Measure of how likely the result of an experiment is due to the manipulation of the IV or due to chance.
closer p value is to 0
the less likely the result is due to chance
a p-value of .05 or less is
What makes the results of a study statistically significant
statistical interference
generalizes from a particular sample to an entire population
Effect Size
A quantitative measurement of the strength of the relationship between two variables or the difference between groups.
Behavioral Perspective
how we learn observable responses
Biological Perspective
how the body and brain enable emotions, memories, and sensory experiences; how genes combine with environment to influence individual differences
Cognitive Perspective
how we encode, process, store, and retrieve information
Evolutionary Perspective
how the natural selection of traits has promoted the survival of genes
Humanistic Perspective
how we meet out needs for love and acceptance and achieve self-fulfillment
Psychodynamic Perspective
how behavior springs from unconscious drives and conflicts
Social-Cultural
how behavior and thinking vary across situations and cultures
formula for z score
z =(x-mean)/standard deviation
Negatively Skewed
left skew, most scores are high and very few are low
Positively Skewed
Right skew, most scores are low and very few are high