Comptia Data+
1/99
There's no tags or description
Looks like no tags are added yet.
Name | Mastery | Learn | Test | Matching | Spaced | Call with Kai |
|---|
No analytics yet
Send a link to your students to track their progress
100 Terms
CSV and TSV
Commas & Tabs (whitespace)
HTML
Formatting tags in <>
Ident & Auth
Separate Steps: Claim & Prove
JSON
Key Value Pairs
- { "name" : "MikeMcMac1" }
- between curly braces
Measures & Dimensions
Measures - Data observed & explored
Dimensions - Space & Time segment data
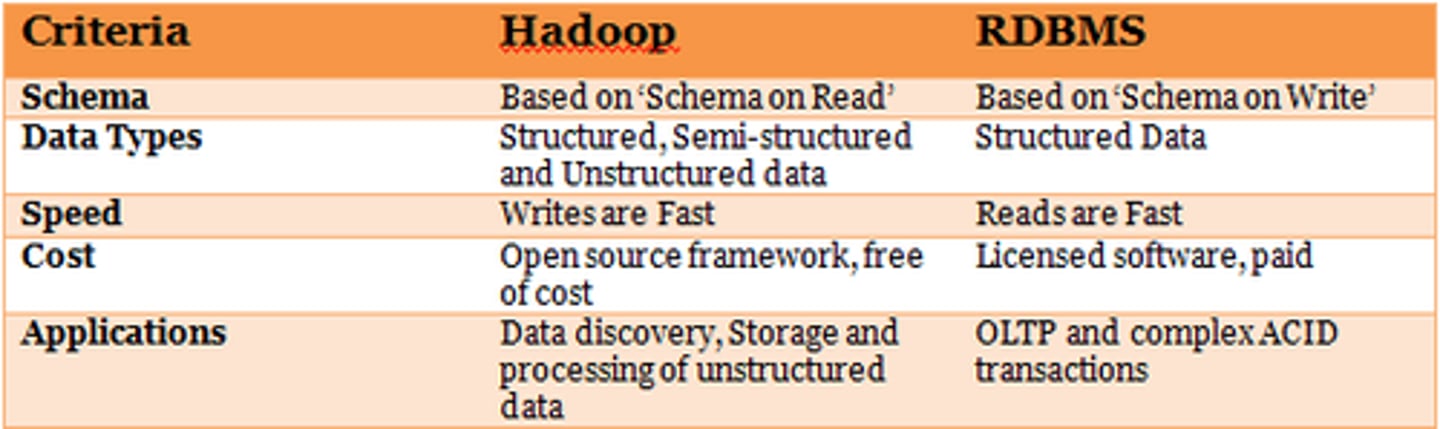
Non-Relational Databases
Developed to handle large sets of data that are not easily organized into tables, columns, and rows
Efficient by reducing overhead via Key/Value Pairs
Record Subsets & Temp Table
Record Subsets - few records returned from larger dataset, for less waiting during command creating/testing. Ex: First 100
Temp Table - table not kept outside of session, for running stats on it during that session
Query Execution Plan
declarative - what to do: sequence of steps for how to run query, with speed varying based on optimizing via human or DBMS
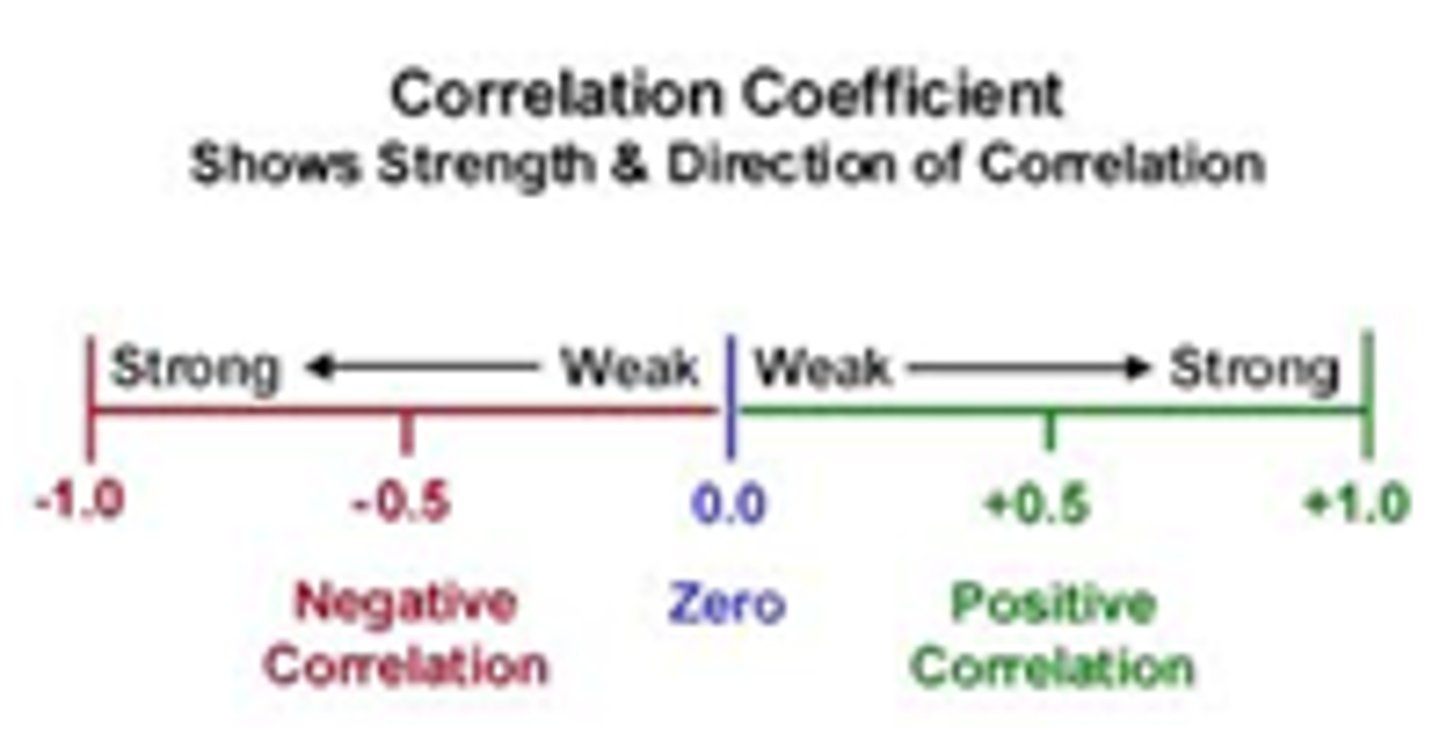
Correlation Coefficient
a statistical index of the relationship between two things (from -1 to +1), computed via statistical apps
Sample
random subset of population that is representative of population
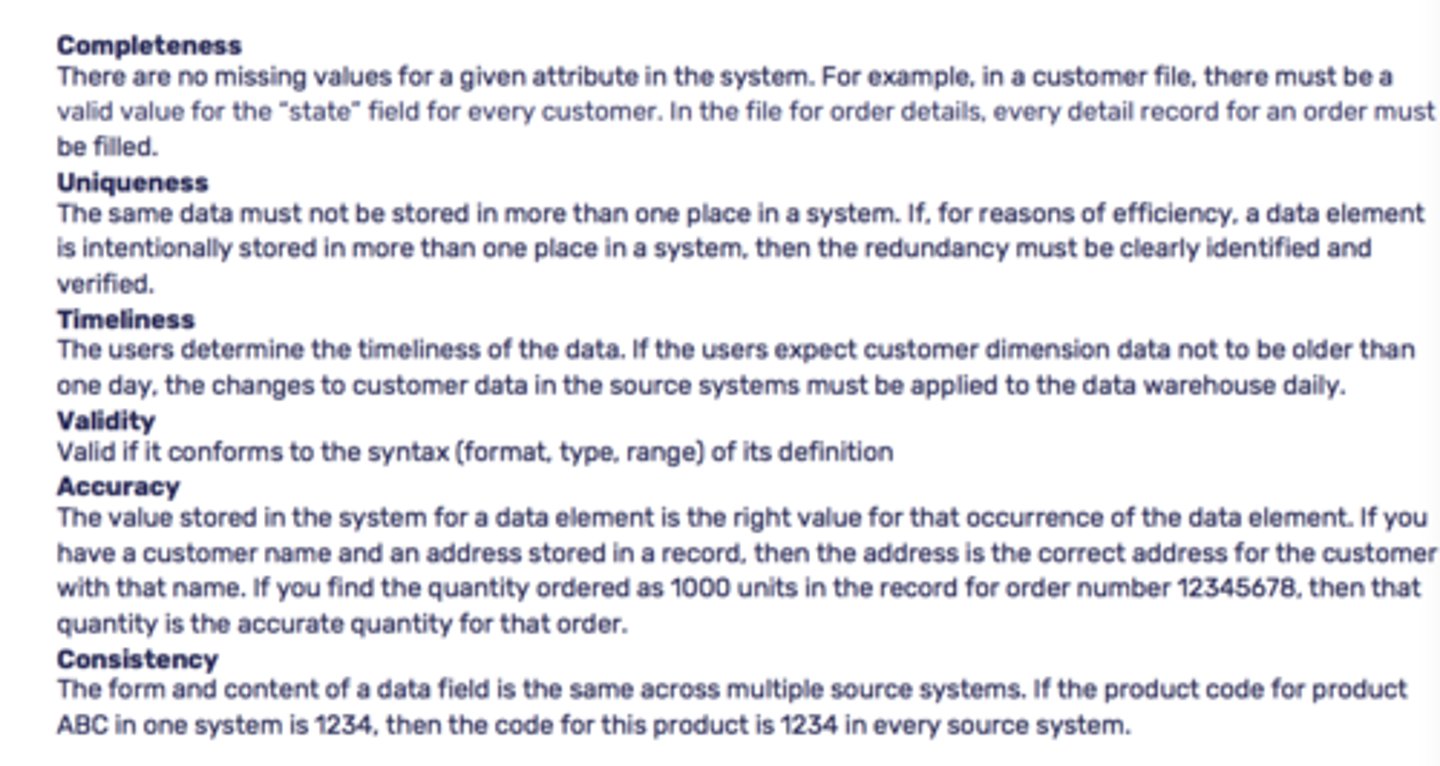
Sample Standard Deviation
sum of [ (sample value minus sample average) squared] divided by numbers of samples less one.
used as approximation of population standard deviation
![<p>sum of [ (sample value minus sample average) squared] divided by numbers of samples less one.</p><p>used as approximation of population standard deviation</p>](https://knowt-user-attachments.s3.amazonaws.com/023ebddd-1c65-4964-81e0-8f5028f534cc.png)
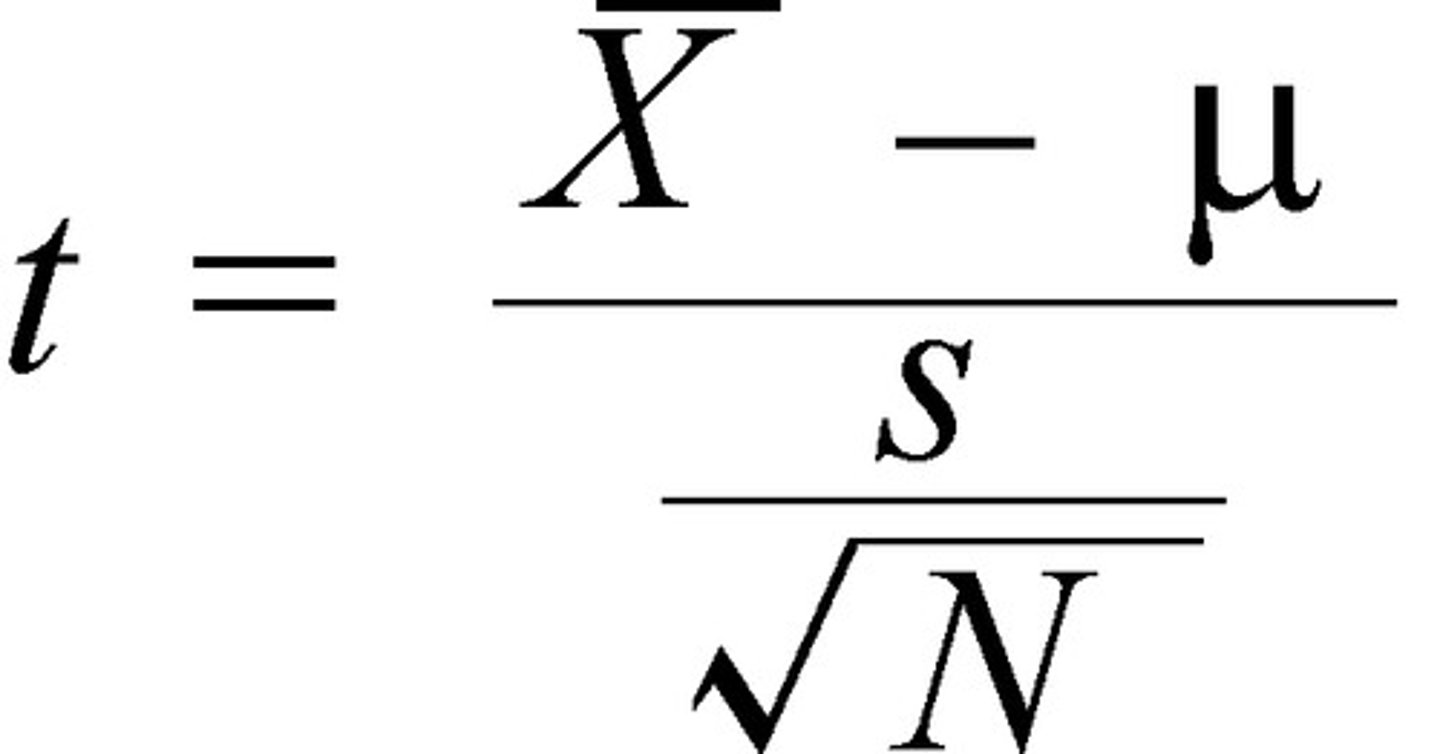
T-Test
Compares mean values of a continuous variable between 2 categories/groups.
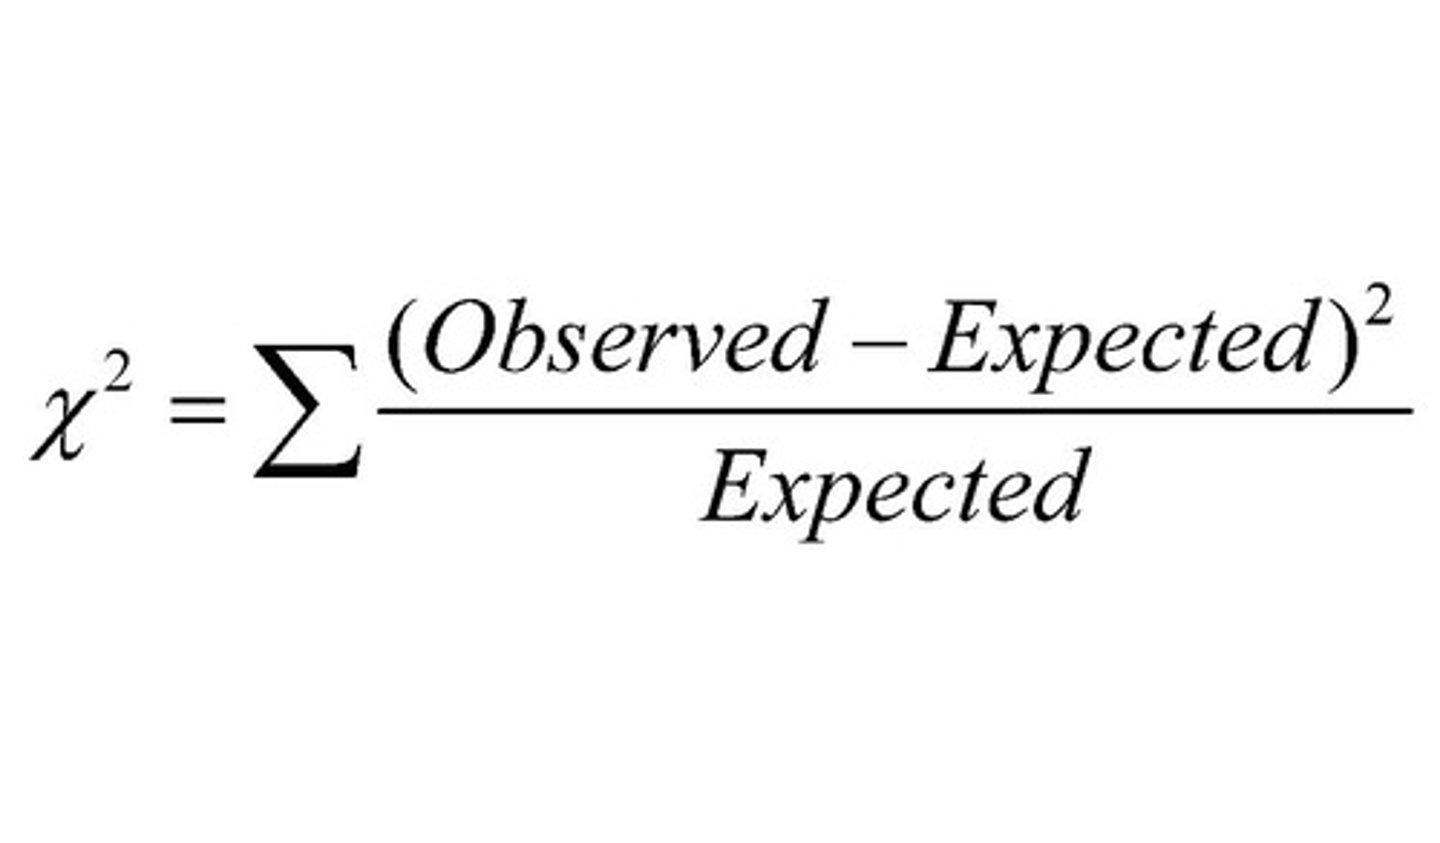
Chi-Square Test
hypothesis testing method for whether your data is as expected.
If you have a single measurement variable, you use a Chi-square goodness of fit test. If you have two measurement variables, you use a Chi-square test of independence.
XML
Structured text all in <>
Online transactional processing (OLTP)
live capture of transaction and event info to:
1) process info according to defined business rules
2) store info
3) update existing info if changed
Typically, OLTP databases are in 3NF.
Online analytical processing (OLAP)
using queries to investigate, analyze, & report hypothesized relationships among stored data
databases that power OLAP systems have a denormalized design. Instead of having data distributed across multiple tables, denormalization results in wider tables than those found in an OLTP database. It is more efficient for analytical queries to read large amounts of data for a single table instead of incurring the cost of joining multiple tables together.
Extract, transform, load (ETL)
The process by which raw data is extracted from various sources, transformed into a format to support the analysis to be performed, and loaded into the data warehouse.
Extract, load, transform (ELT)
An alternative to ETL used with data lakes, where the data is not transformed on entry to the data lake, but stored in its original raw format
Delta Load (incremental load)
delta between target and source data is dumped at regular intervals. The last extract date is stored so that only records added after this date are loaded. Incremental loads come in two flavors that vary based on the volume of data you're loading:
Streaming incremental load - better for loading small data volumes
Batch incremental load - better for loading large data volumes
understand the time available for performing delta loads into your data warehouse. Regardless of how long your batch window is, think carefully about moving current data into the data warehouse without losing history.
Non-Parametric Data
Data that does not fit a known or well-understood distribution
Usually ordinal or interval data
For real-valued data, nonparametric statistical methods are required in applied machine learning when you are trying to make claims on data that does not fit the familiar Gaussian distribution.
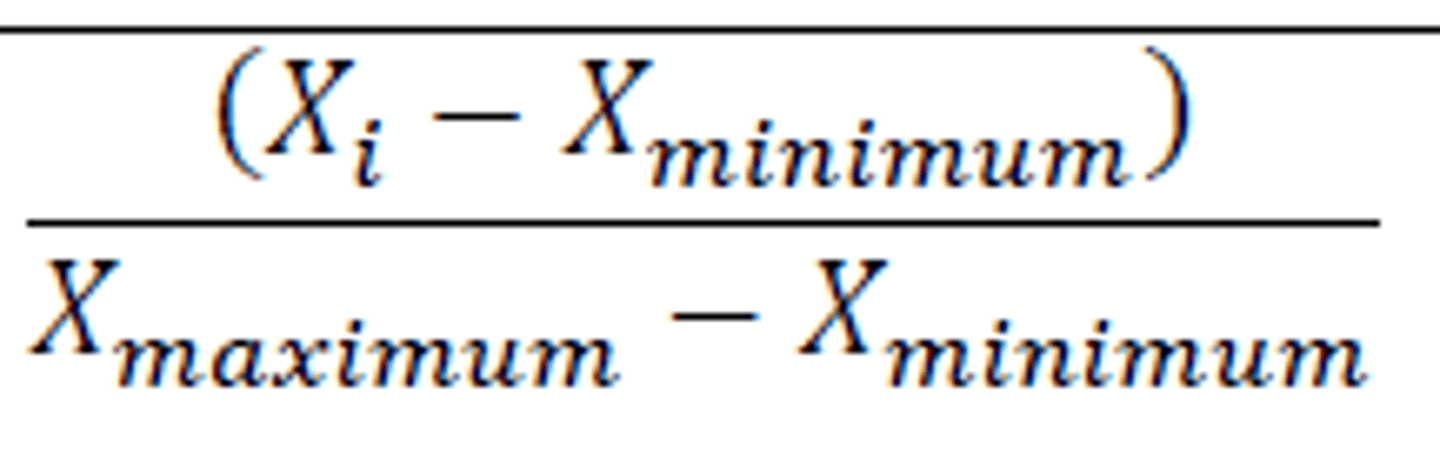
Normalize Ratings Data
normalization of ratings means adjusting values measured on different scales to a notionally common scale, often prior to averaging
Descriptive Statistical Methods
• Measures of central tendency
• Measures of dispersion
• Frequencies/percentages
• Percent change
• Percent difference
• Confidence interval
Inferential Statistical Methods
provide predictions about characteristics of a population based on information in a sample from that population
Measures of Central Tendency
mean, median, mode
Measures of Dispersion (variability)
range (max/min), distribution, variance, standard deviation
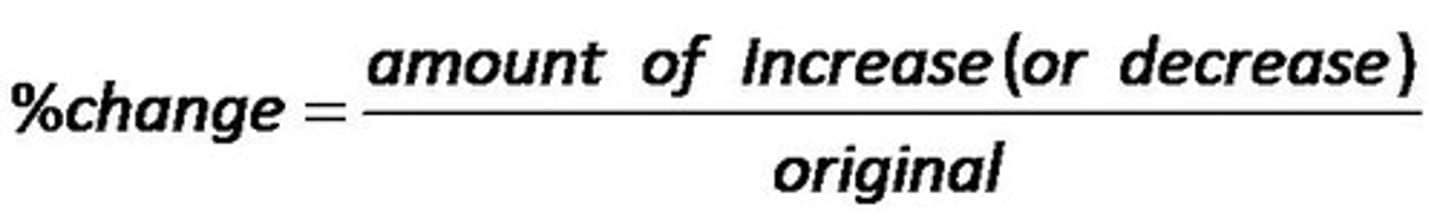
Percent Change
Percentage change equals the change in value divided by the absolute value of the original value, multiplied by 100.
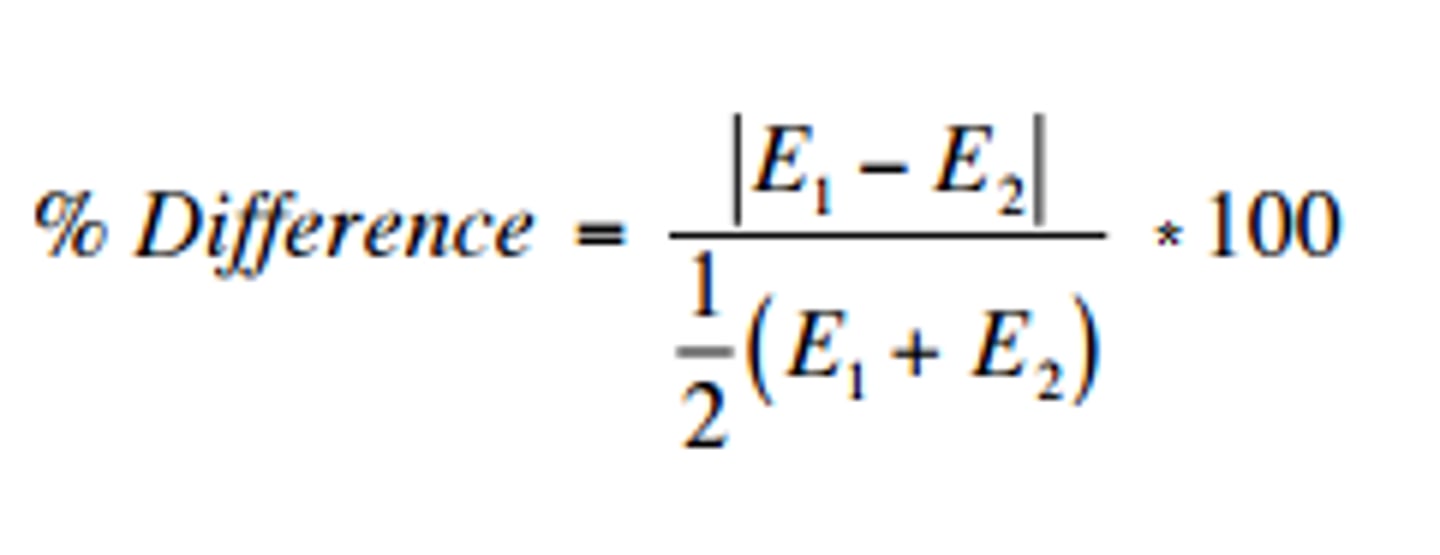
Percent Difference
Percentage difference equals the absolute value of the change in value, divided by the average of the 2 numbers, all multiplied by 100. We then append the percent sign, %, to designate the % difference.
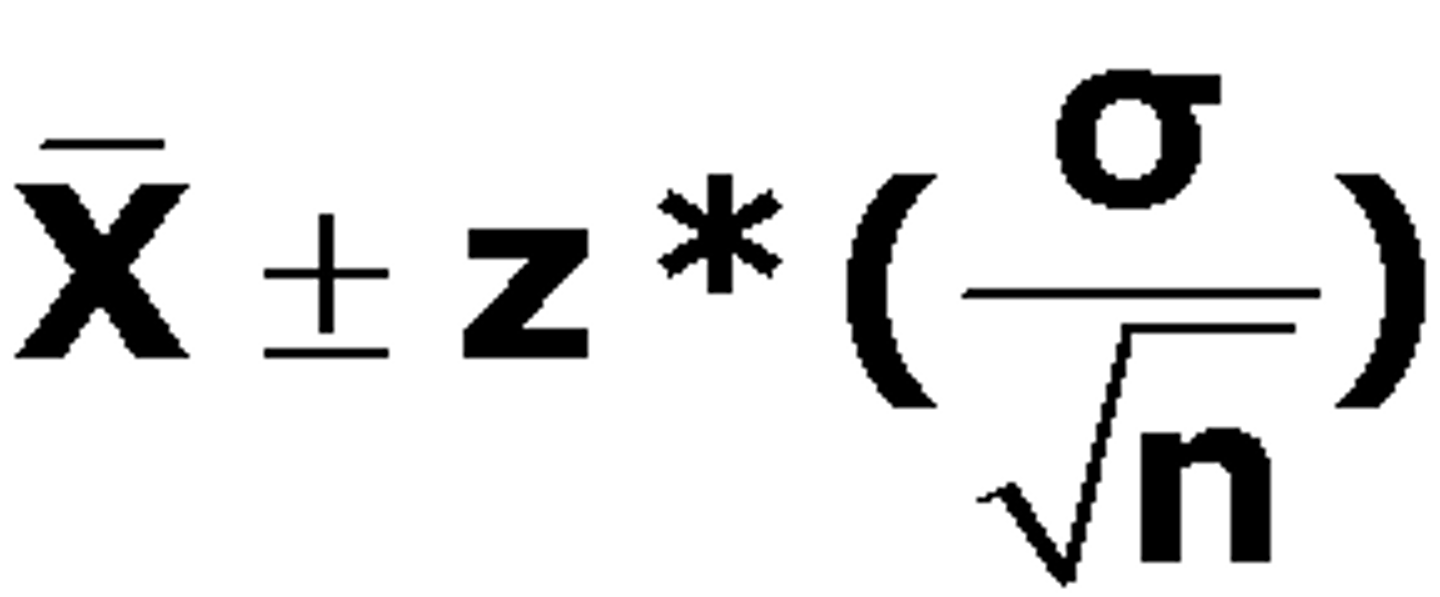
Confidence Intervals
the range on either side of an estimate from a sample that is likely to contain the true value for the whole population
confidence interval for data which follows a standard normal distribution is: (see image)
Where:
CI = the confidence interval
X̄ = the population mean
Z* = the critical value of the z-distribution
σ = the population standard deviation
√n = the square root of the population size
When calculating confidence intervals, you need to have the standard deviation of the entire population. However, since getting measures about the whole population is challenging, the population standard deviation is likely unknown. In that case, while it's more precise to use the t-distribution, if your sample size is greater than 30, it's reasonable to use the normal distribution and substitute the sample standard deviation as in image
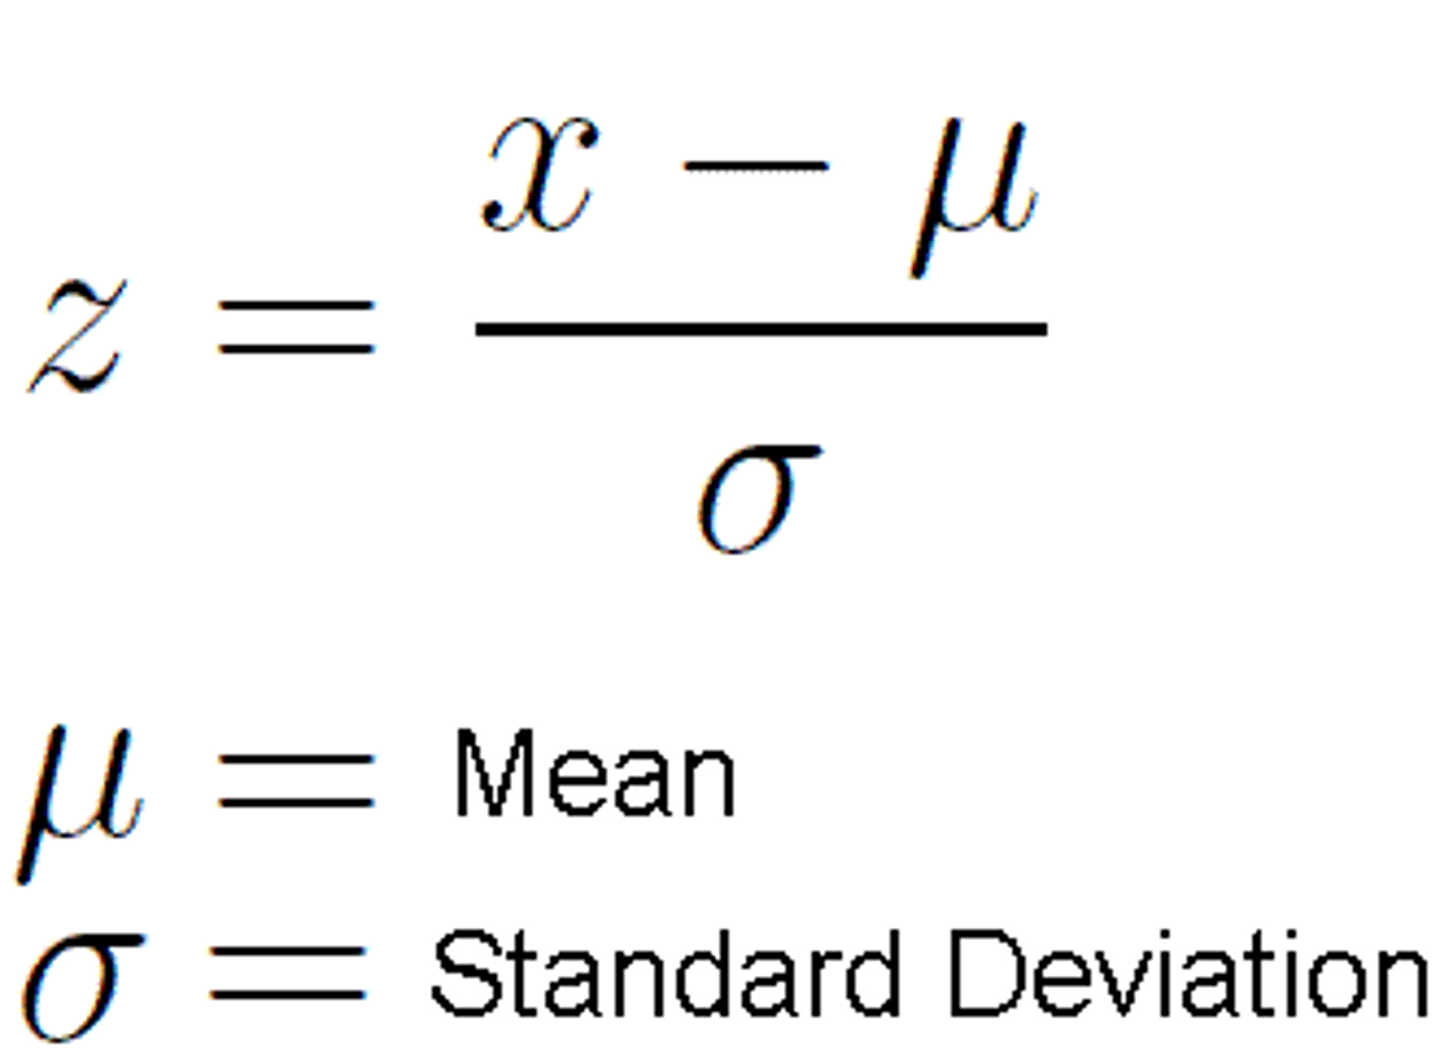
Z-Score (standard score)
the number of standard deviations a particular score is from the mean
P-Value
The probability of results of the experiment being attributed to chance.
The p value is the evidence against a null hypothesis. The smaller the p-value, the stronger the evidence that you should reject the null hypothesis.
When the p-value is less than or equal to 0.05, you should reject the null hypothesis. Alternatively, when the p-value is greater than 0.05, you should retain the null hypothesis as there is not enough statistical evidence to accept the alternative hypothesis. Remember this saying: "When the p is low, the null must go. When the p is high, the null must fly!"
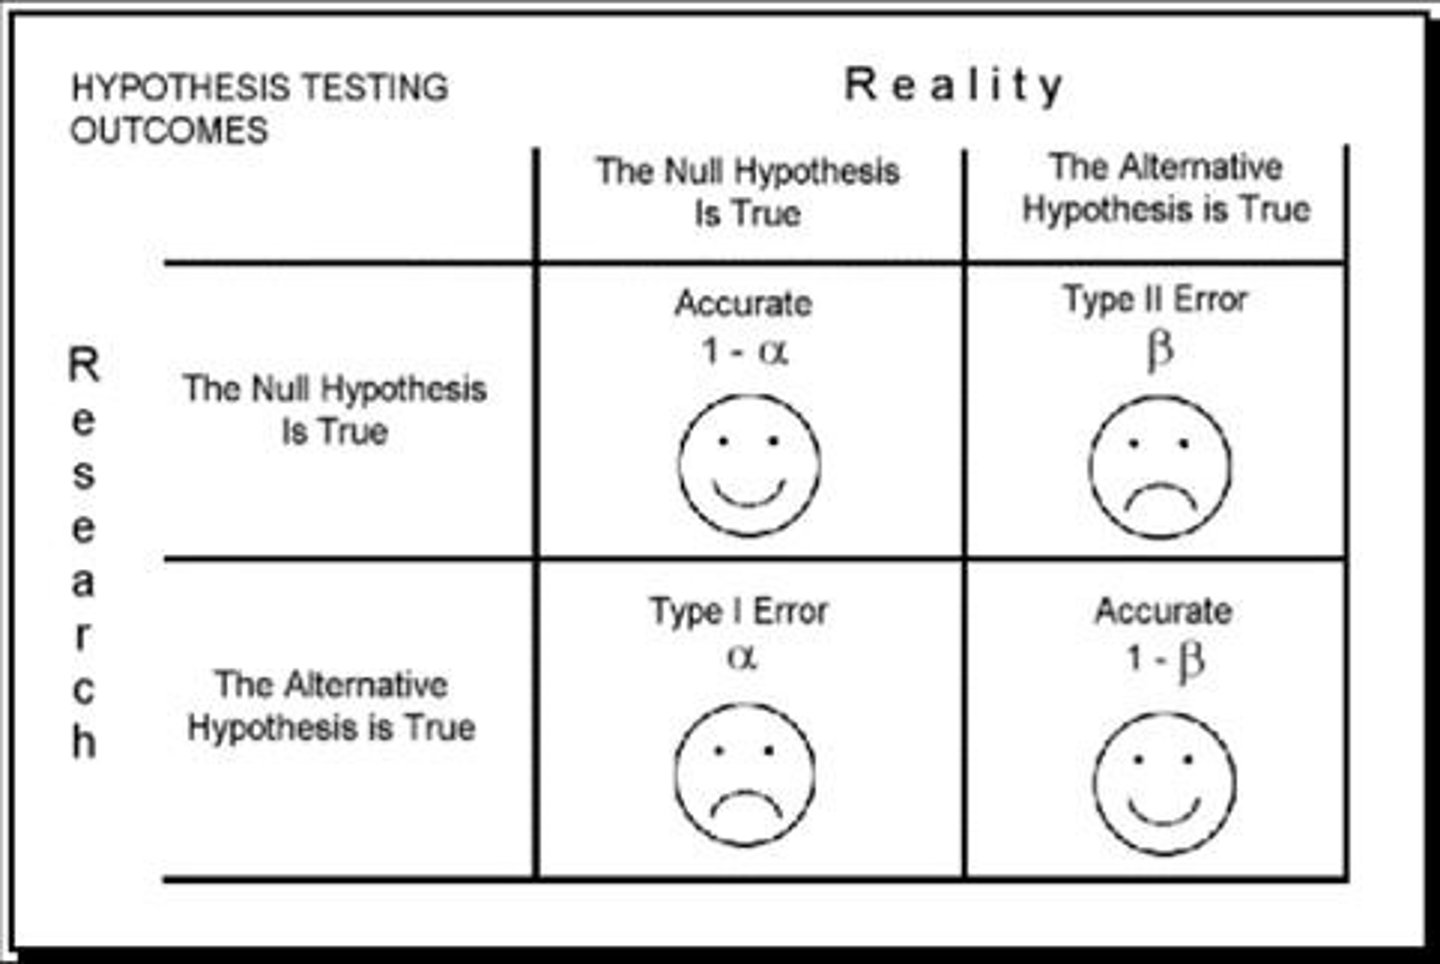
Hypothesis Testing
a decision-making process for evaluating claims about a population
When hypothesis testing, the null and alternative hypothesis describe the effect in terms of the total population.
To perform the hypothesis test itself, you need sample data to make inferences about characteristics of the overall population.
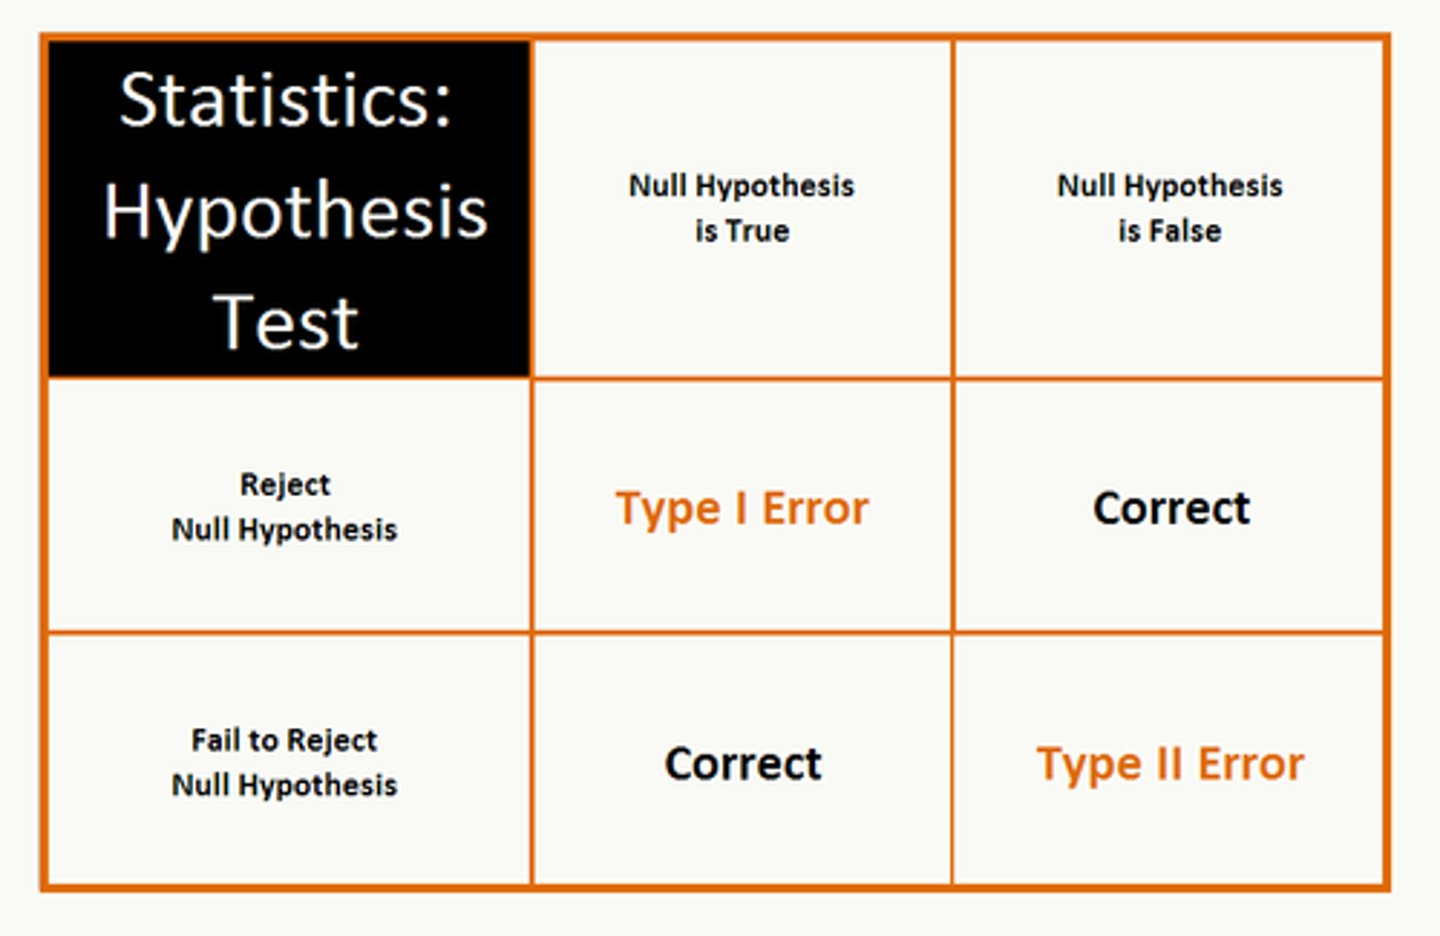
Type I error (alpha)
false positive
Type I error:
is the incorrect rejection of the null hypothesis
maximum probability is set in advance as alpha
is not affected by sample size as it is set in advance
increases with the number of tests or end points (i.e. do 20 rejections of H0 and 1 is likely to be wrongly significant for alpha = 0.05)
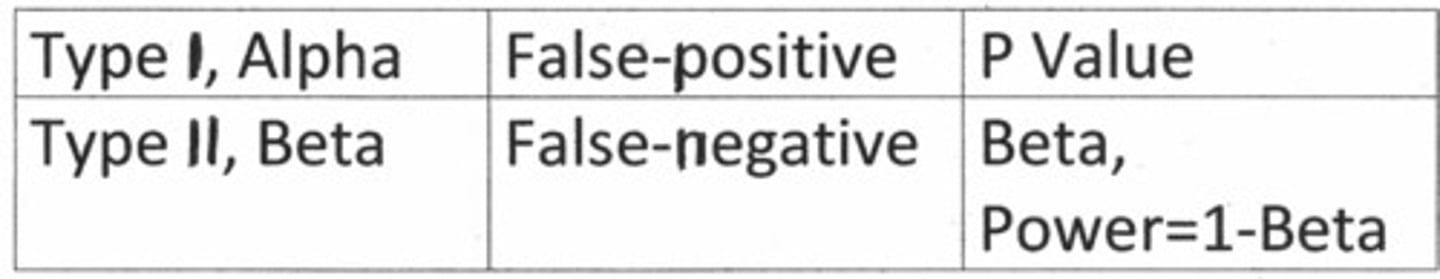
Type II error (beta)
false negative
Type II error:
is the incorrect acceptance of the null hypothesis
probability is beta
beta depends upon sample size and alpha
can't be estimated except as a function of the true population effect
beta gets smaller as the sample size gets larger
beta gets smaller as the number of tests or end points increases

Simple Linear Regression
linear regression model with a single explanatory variable. That is, it concerns two-dimensional sample points with one independent variable and one dependent variable and finds a linear function that, as accurately as possible, predicts the dependent variable values as a function of the independent variable.
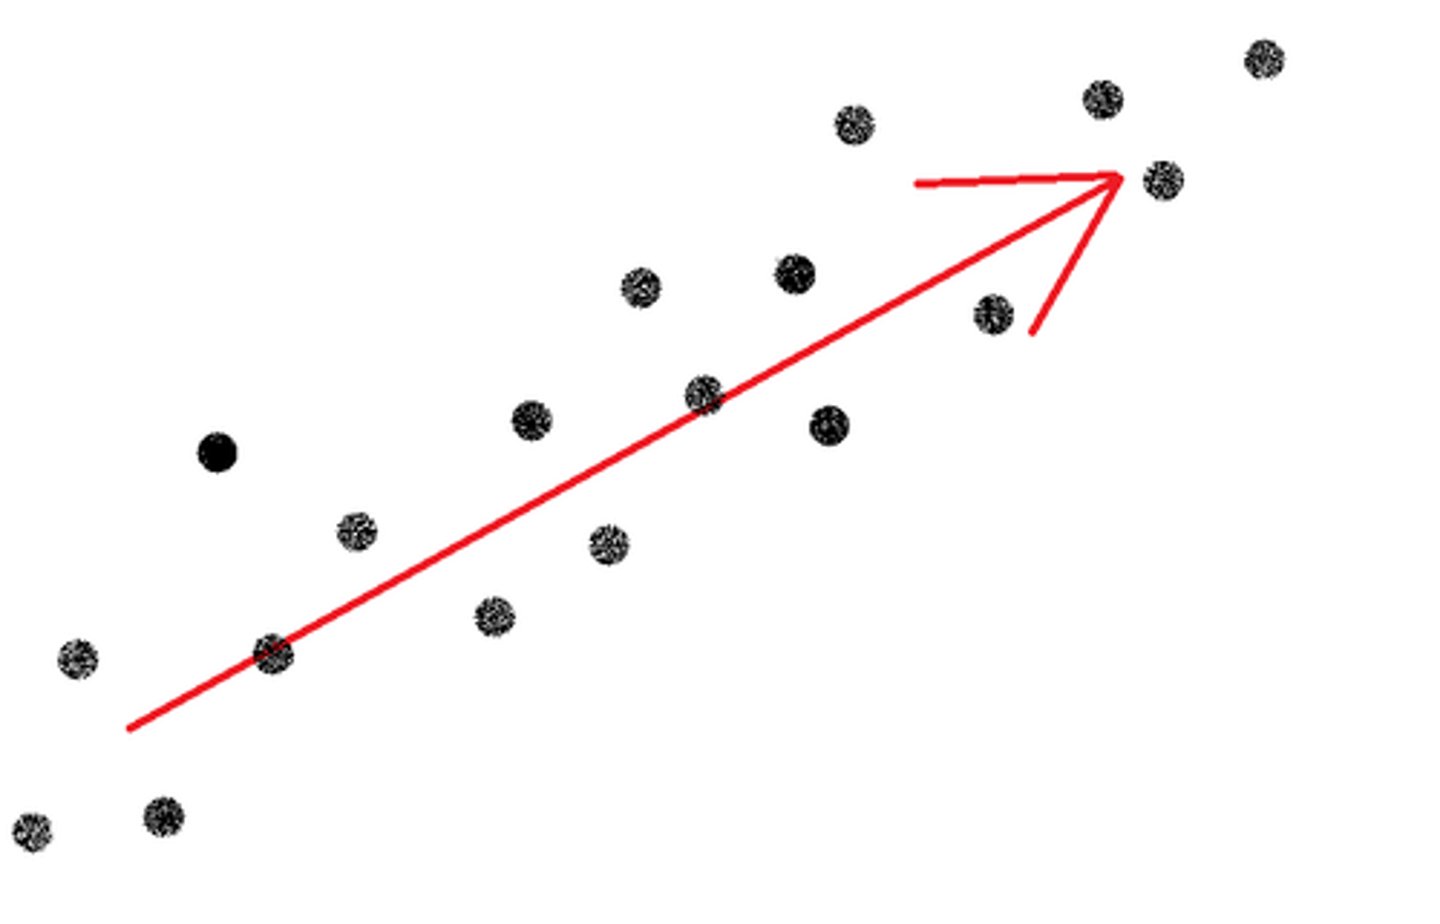
Correlation
A measure of the extent to which two factors vary together, and thus of how well either factor predicts the other.

Trend Analysis
hypothetical extension of a past series of events into the future
OR
comparison of data over time
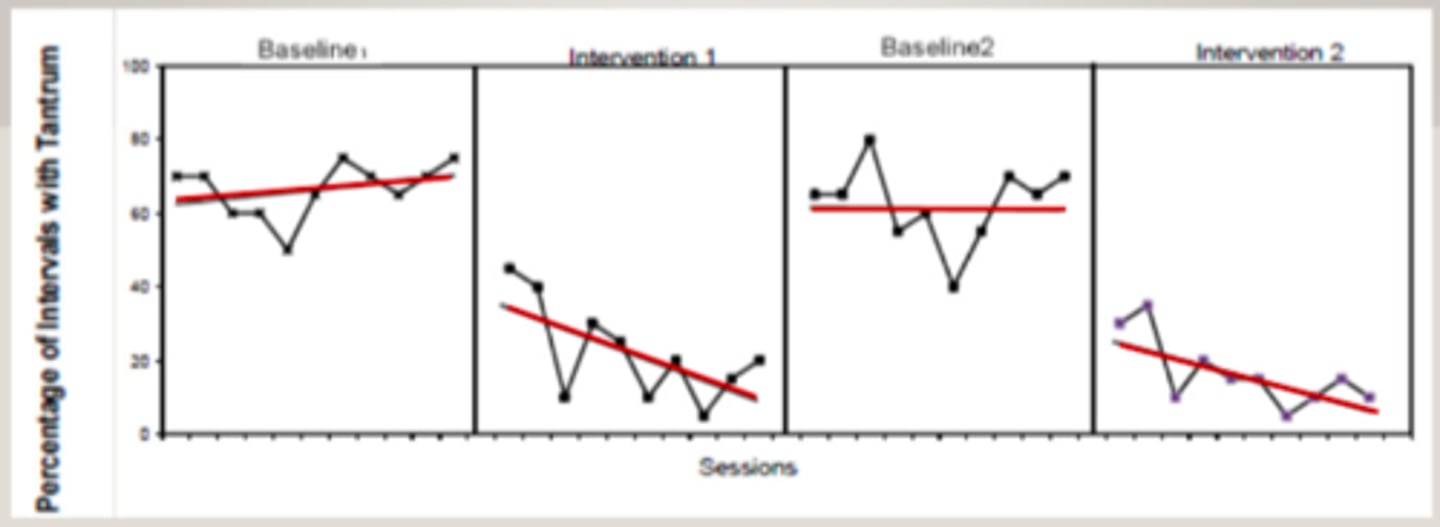
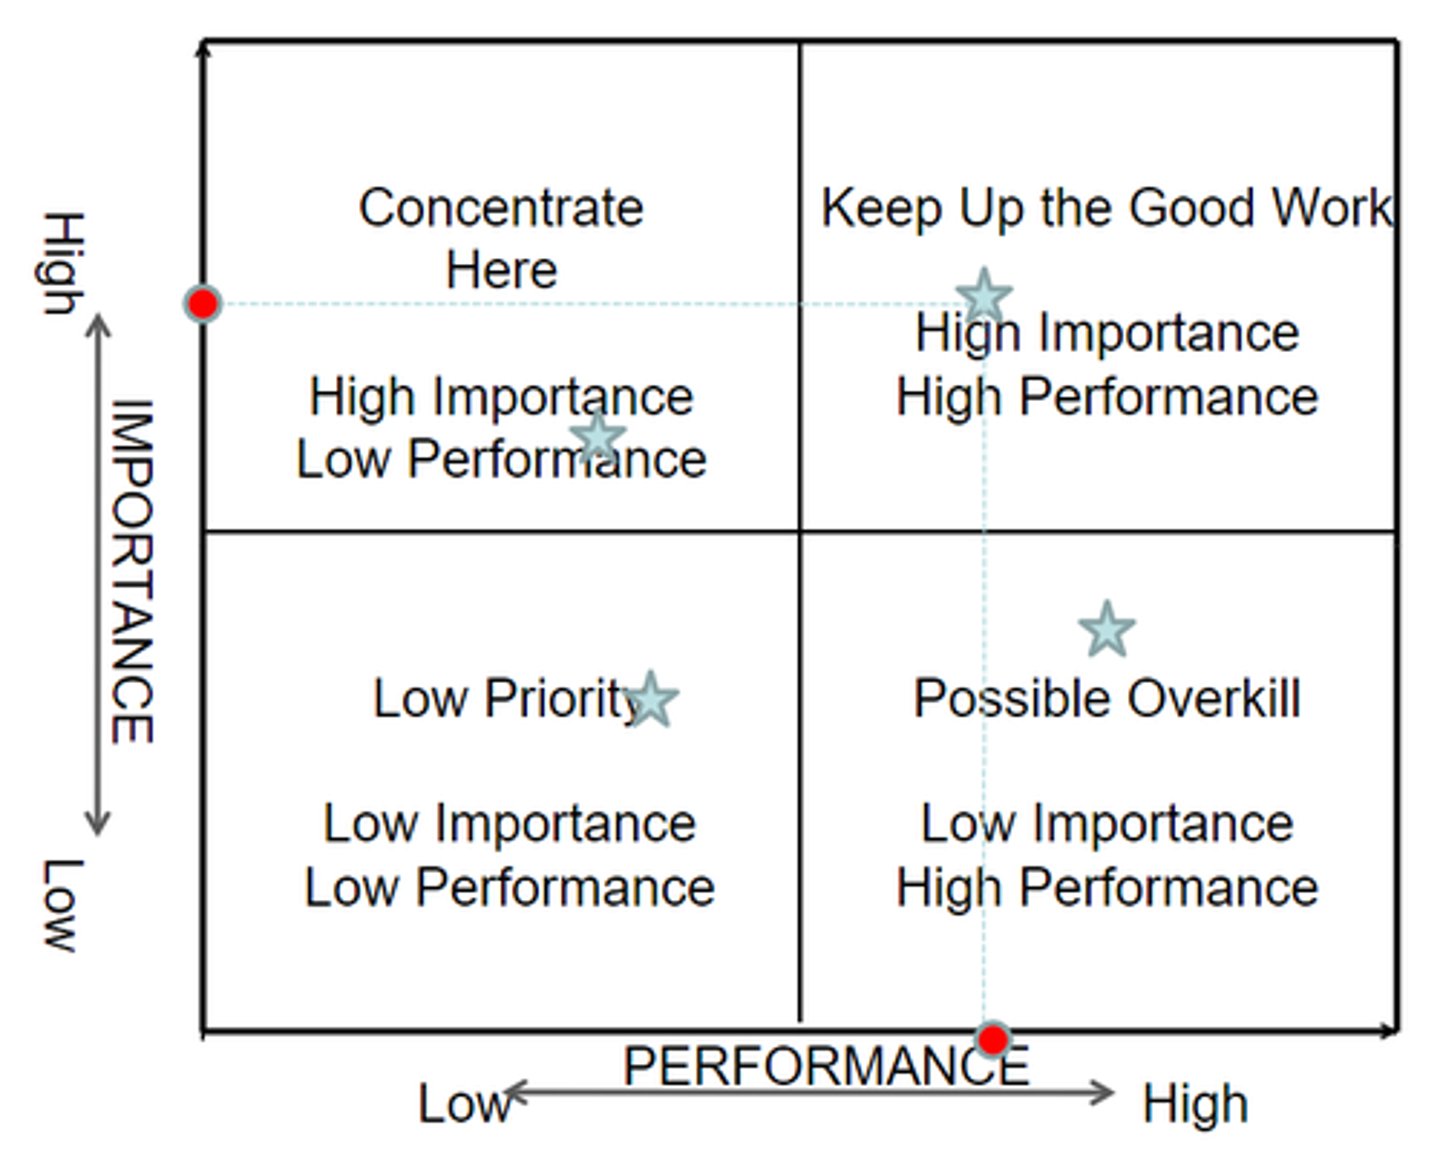
Performance Analysis
- Tracking measurements against defined goals
- Basic projections to achieve goals
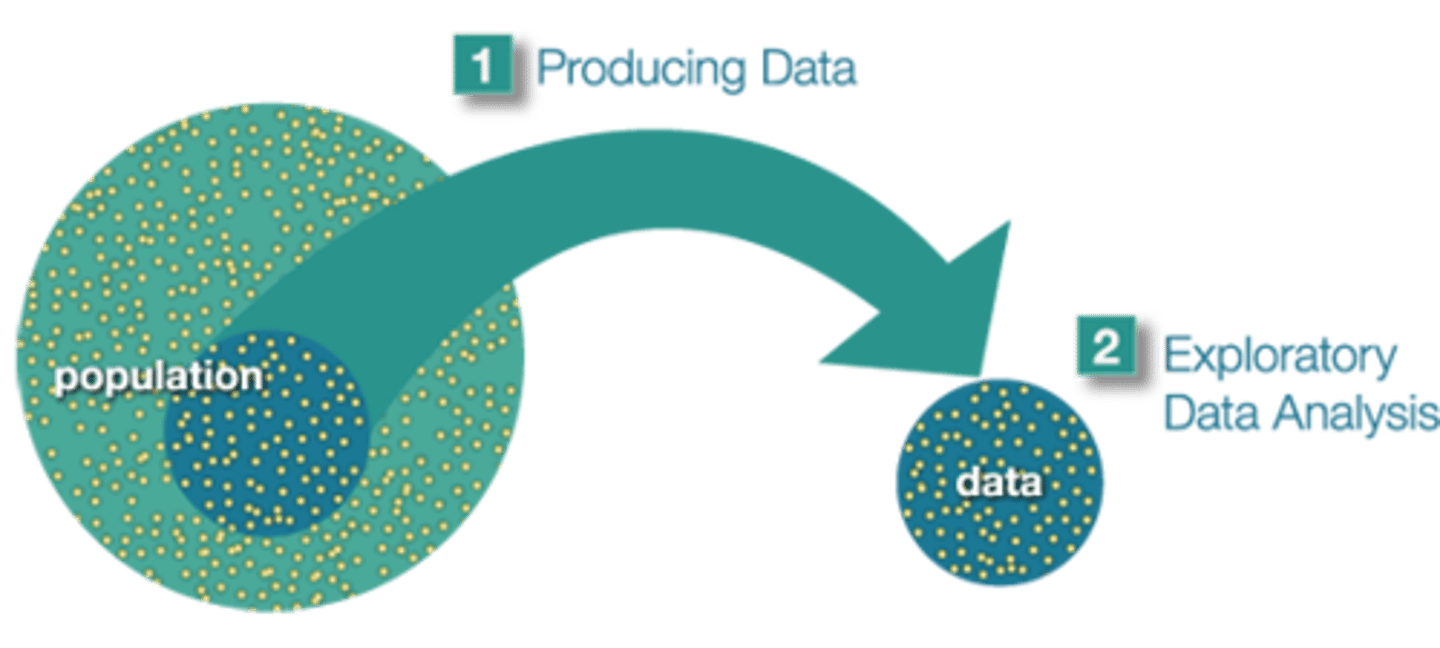
Exploratory Data Analysis
- Use of descriptive statistics to determine observations
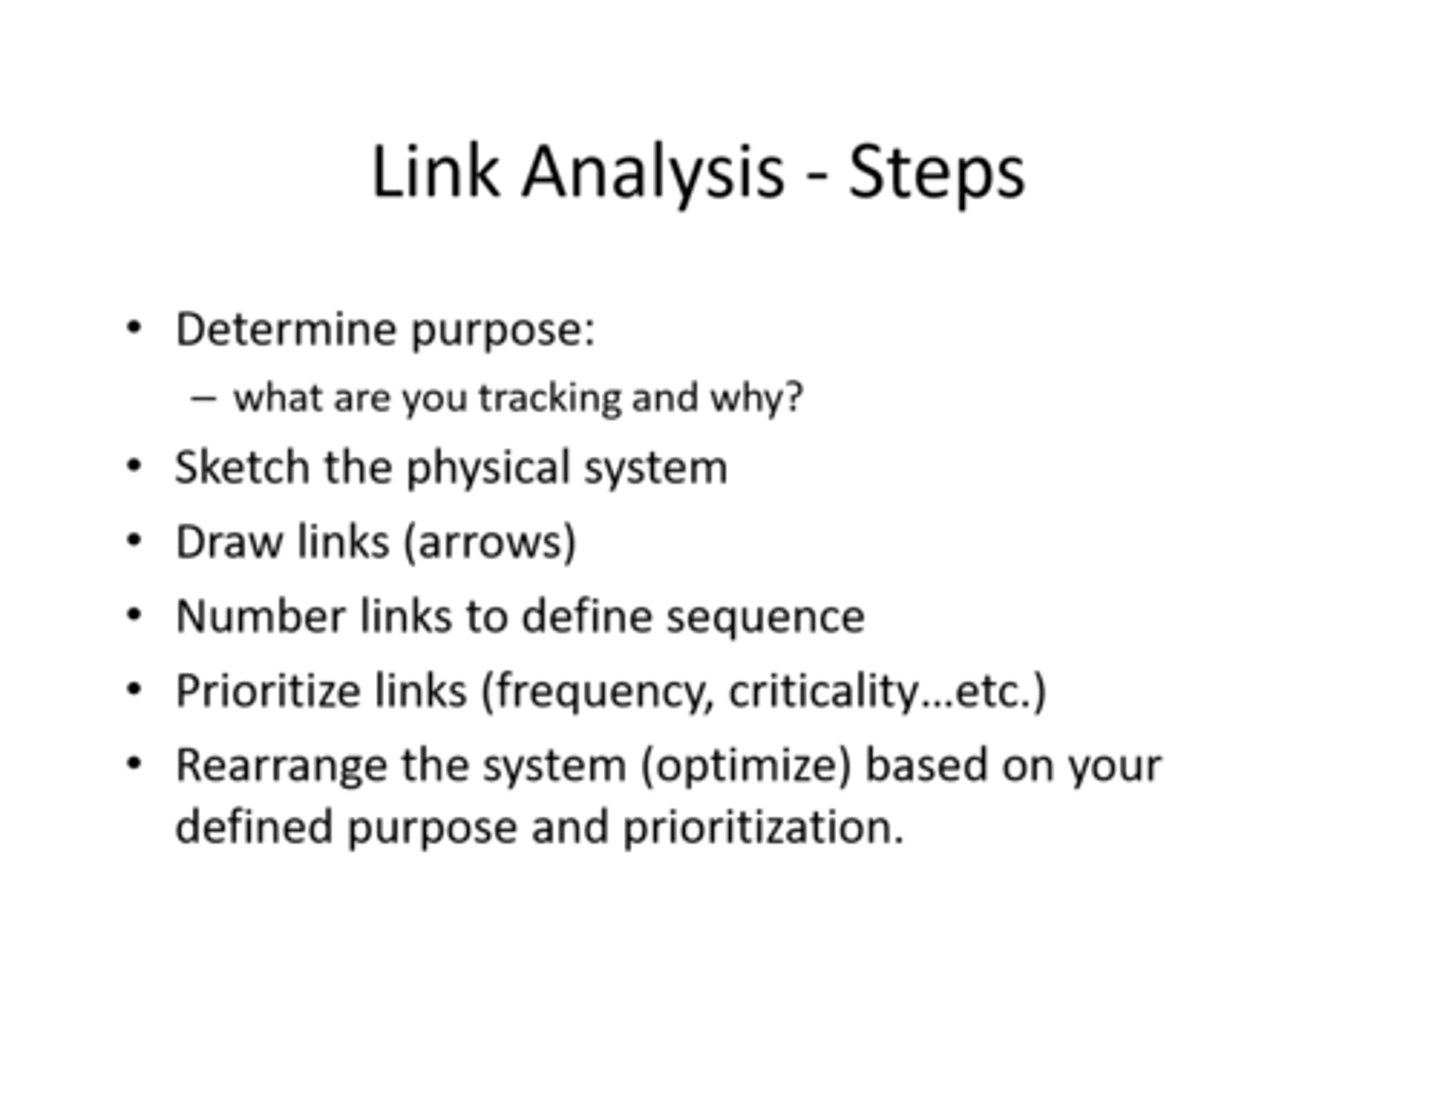
Link Analysis
- Connection of data points or pathway
Master Data Management (MDM)
the practice of gathering data and ensuring that it is uniform, accurate, consistent, and complete
- Consolidation of multiple data fields
- Standardization of data field names
- Data dictionary
Relational Database Management System (RDBMS)
allows users to create, read, update, and delete data in a relational database
Structured Query Language (SQL)
an international standard language for processing a database
Report Cover Page
- Instructions
- Summary
- Observations and insights
Why It Matters, How Did Study, What Analyst Recommends

Corporate Reporting Standards (Style Guide)
- Branding
- Color codes
- Logos/trademarks
- Watermark
Documentation Elements
Version number - Reference data sources - Reference dates - Report run date - Data refresh date
Data Sources and Attributes
- Field definitions
- Dimensions
- Measures
Delivery Considerations
- Subscription
- Scheduled delivery
- Interactive (drill down/roll up)
- Saved searches
- Filtering
- Static
- Web interface
- Dashboard optimization
- Access permissions
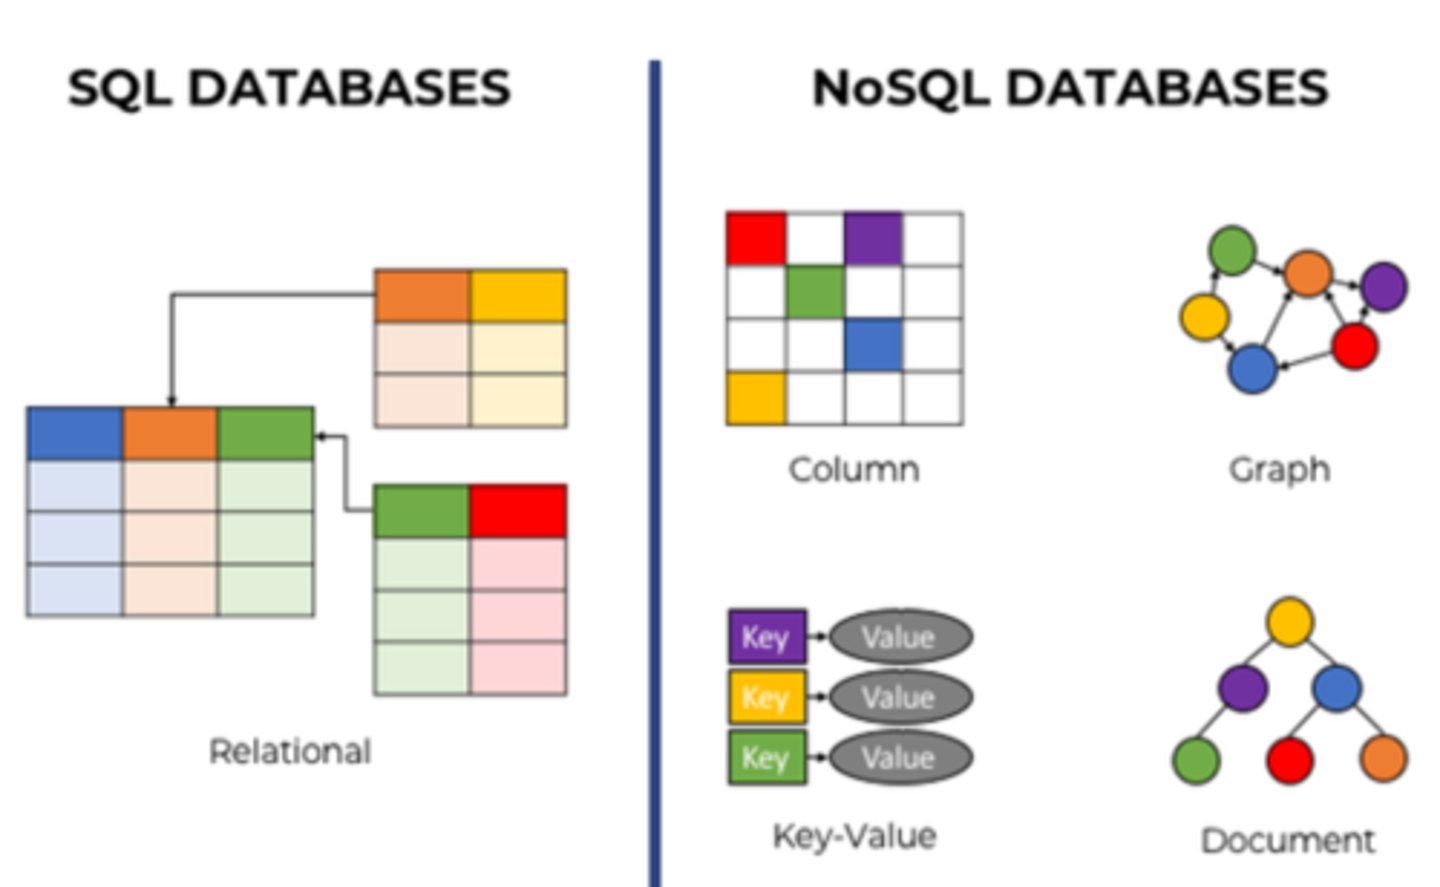
Bubble Chart
A type of scatter plot with circular symbols used to compare three variables; the area of the circle indicates the value of a third variable
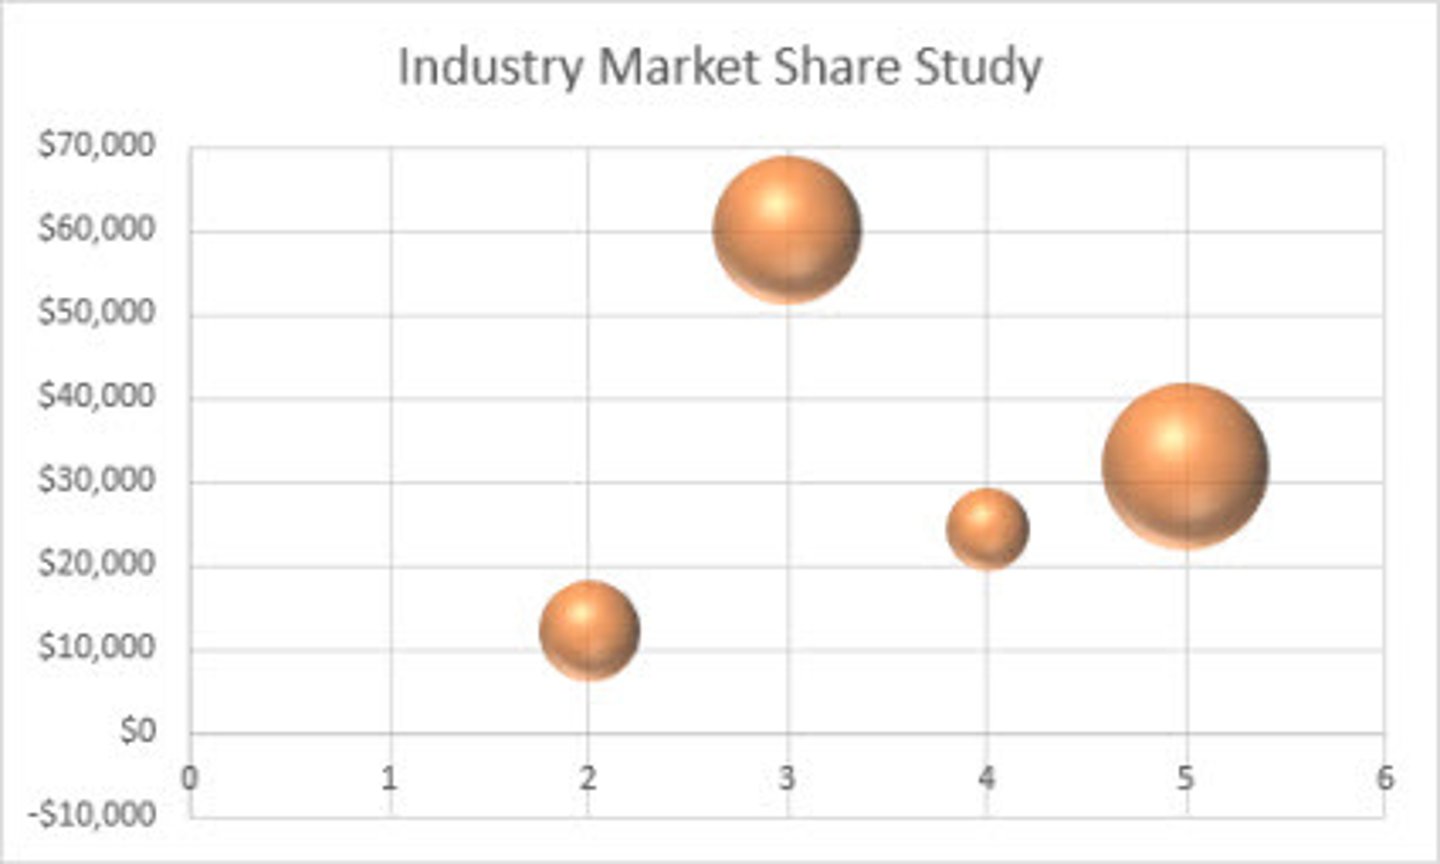
Histogram
a bar graph depicting a frequency distribution
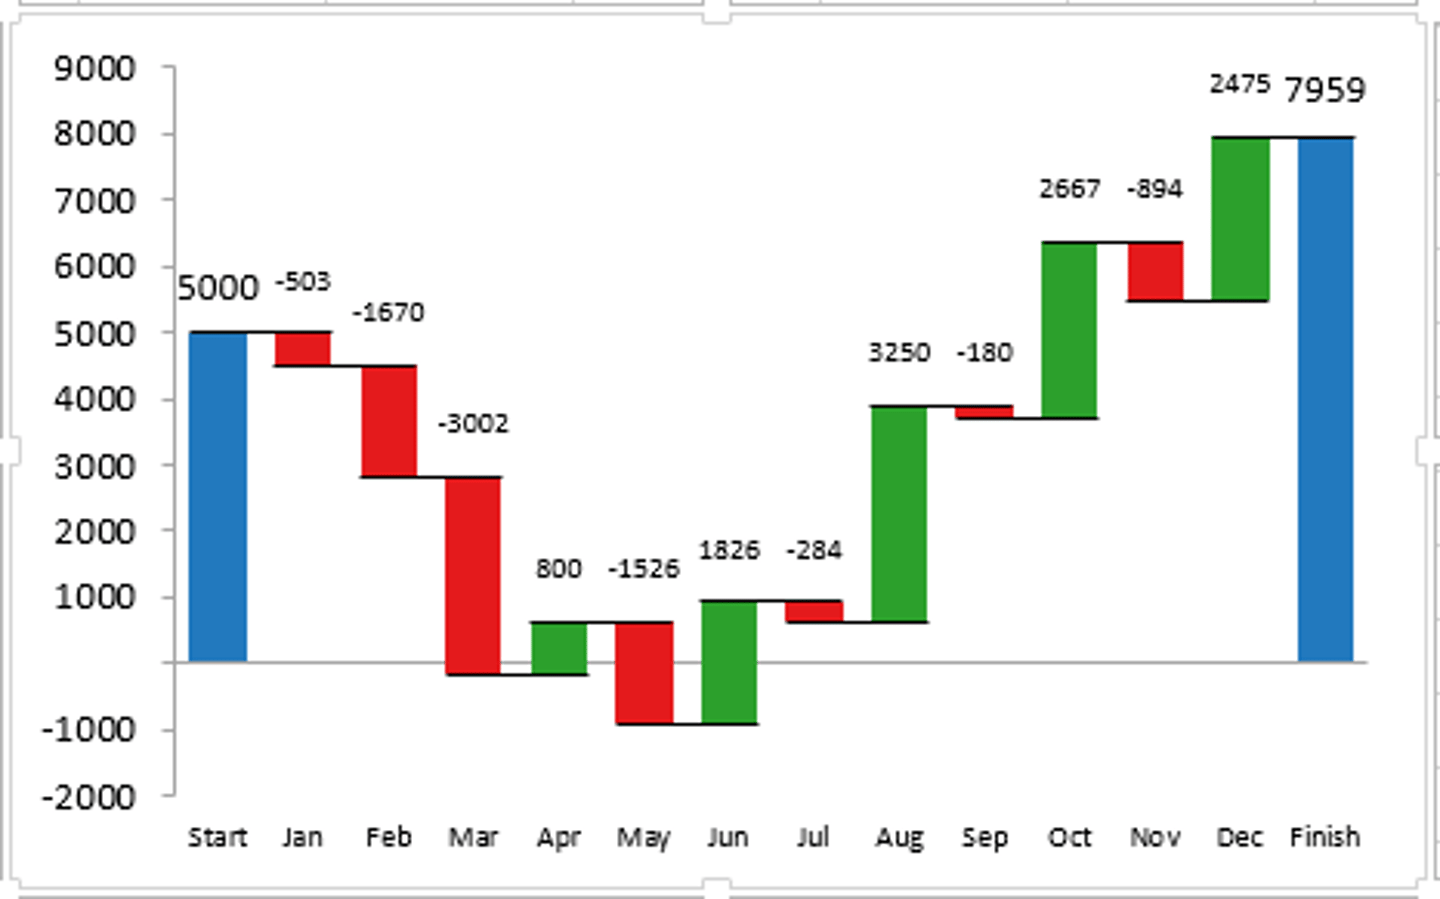
Waterfall Chart
helps in understanding the cumulative effect of sequentially introduced positive or negative values. These intermediate values can either be time based or category based. The waterfall chart is also known as a flying bricks chart or Mario chart due to the apparent suspension of columns (bricks) in mid-air.
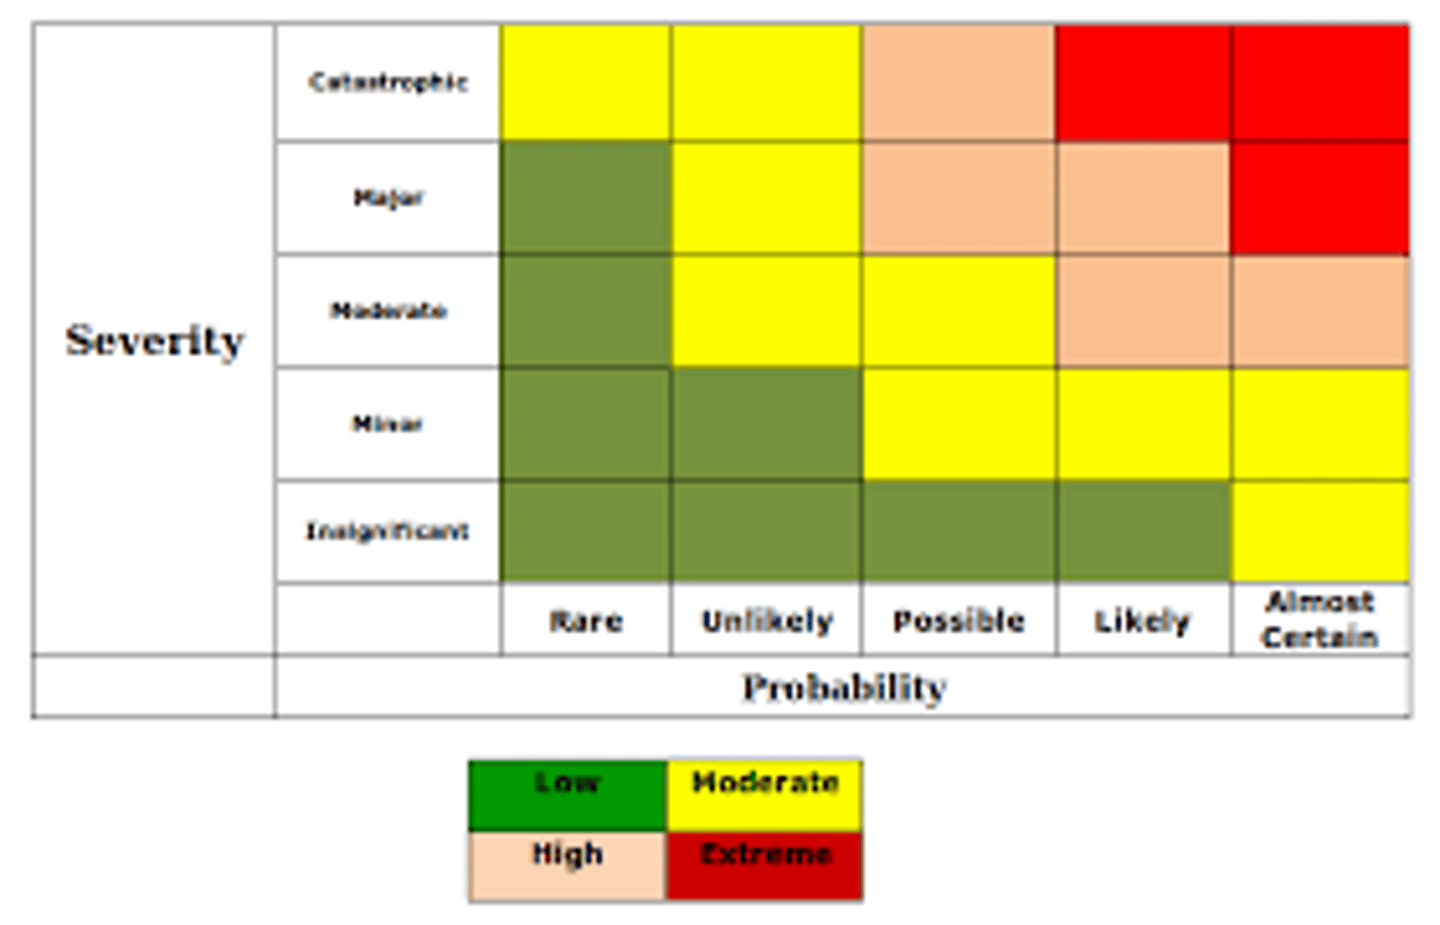
Heat Map
A two-dimensional graphical representation of data that uses different shades of color to indicate magnitude
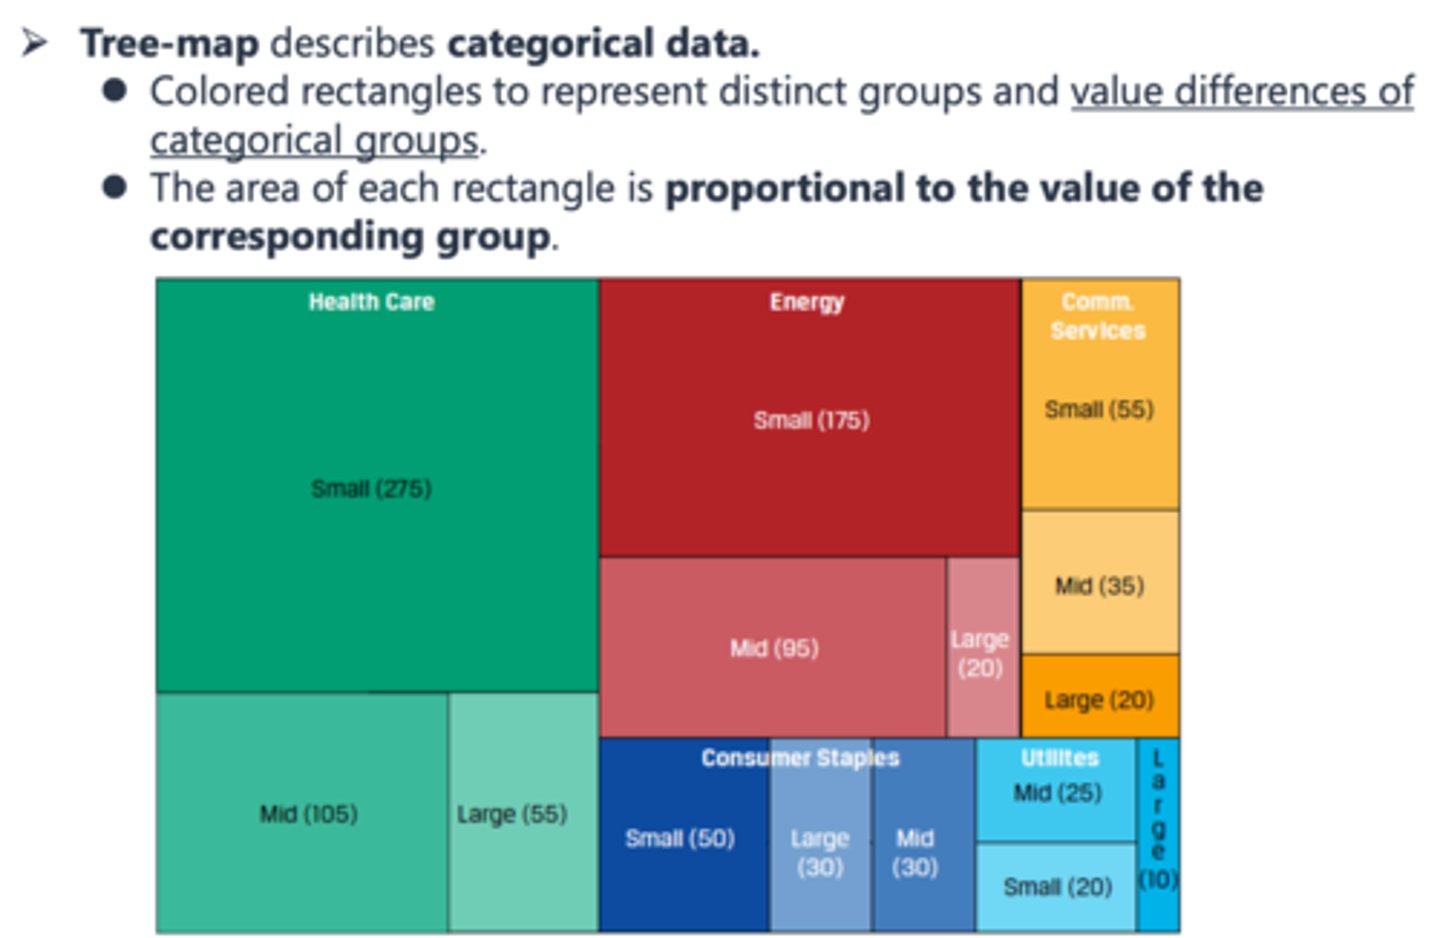
Tree Map Chart
treemapping is a method for displaying hierarchical data using nested figures, usually rectangles.
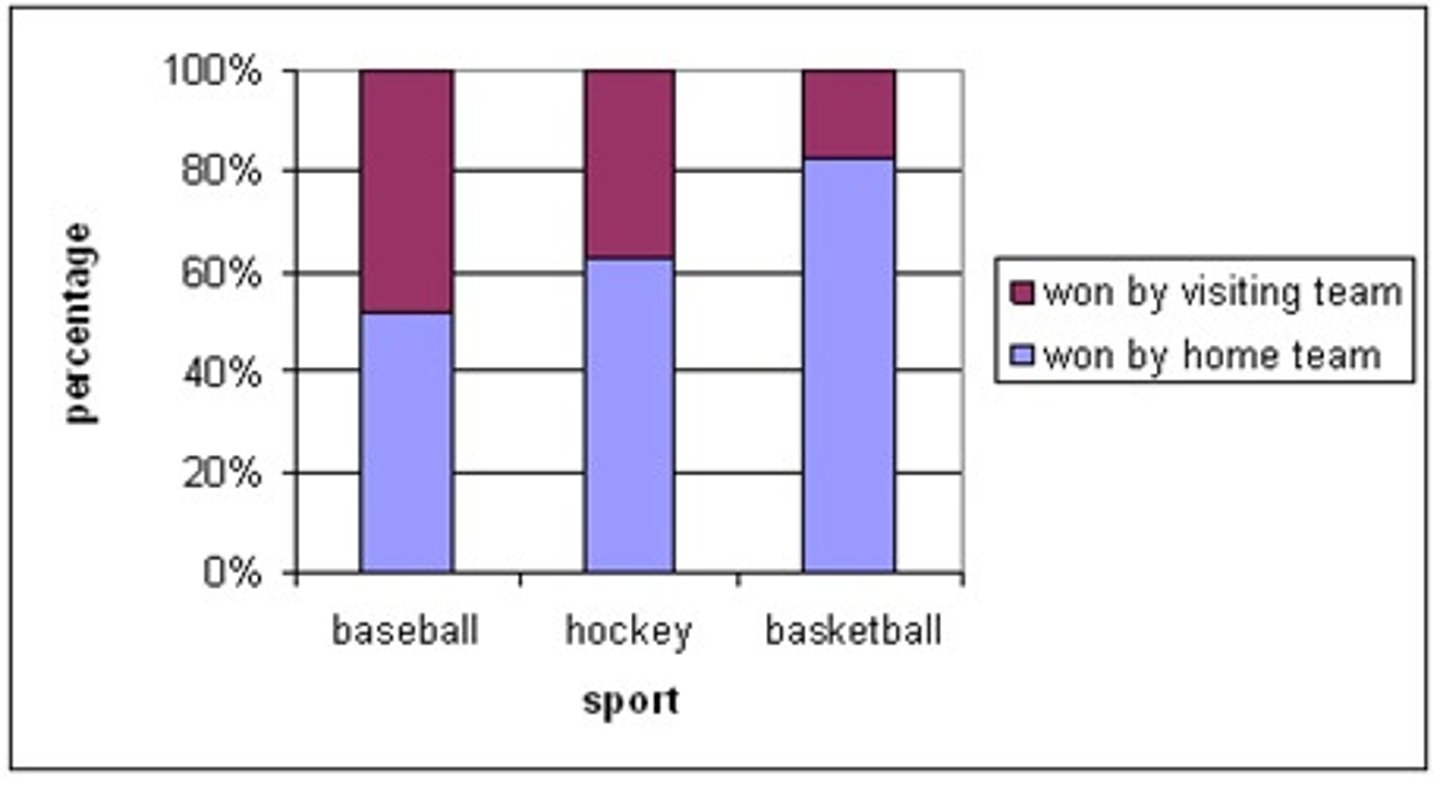
Stacked Chart
extends the standard bar chart from looking at numeric values across one categorical variable to two. Each bar in a standard bar chart is divided into a number of sub-bars stacked end to end, each one corresponding to a level of the second categorical variable.
Tactical Report
short term data report for tactical decisions, related to the operations that we do alone or in groups to realize strategic long term ends.
Research Report
long term data report for strategic decisions, or those related to overall business progress and growth, requiring deep research.
Entity Relationship Requirements
- Record link restrictions
- Data constraints
- Cardinality
entity-relationship model describes interrelated things of interest in a specific domain of knowledge. A basic ER model is composed of entity types and specifies relationships that can exist between entities.
Data Quality - 6 Dimensions
Accuracy - how closely a given attribute matches its intended use.
Timeliness - measures whether or not the data you need is available at the right time.
Completeness - minimum amount of information you need to fulfill a business objective. When considering completeness, think about database columns that can't have a null value.
Consistency - reliability of an attribute. Data consistency typically comes into play in large organizations that store the same data in multiple systems. Considering data consistency is especially important when designing a data warehouse as it sources data from multiple systems.
Integrity/Validity - indicates whether or not an attribute's value is within an expected range. One way to ensure data validity is to enforce referential integrity in the database.
Uniqueness - describes whether or not a data attribute exists in multiple places within your organization. Closely related to data consistency, the more unique your data is, the less you have to worry about
Data Quality Validation Methods
- Cross-validation
- Sample/spot check
- Reasonable expectations
- Data profiling
- Data audits
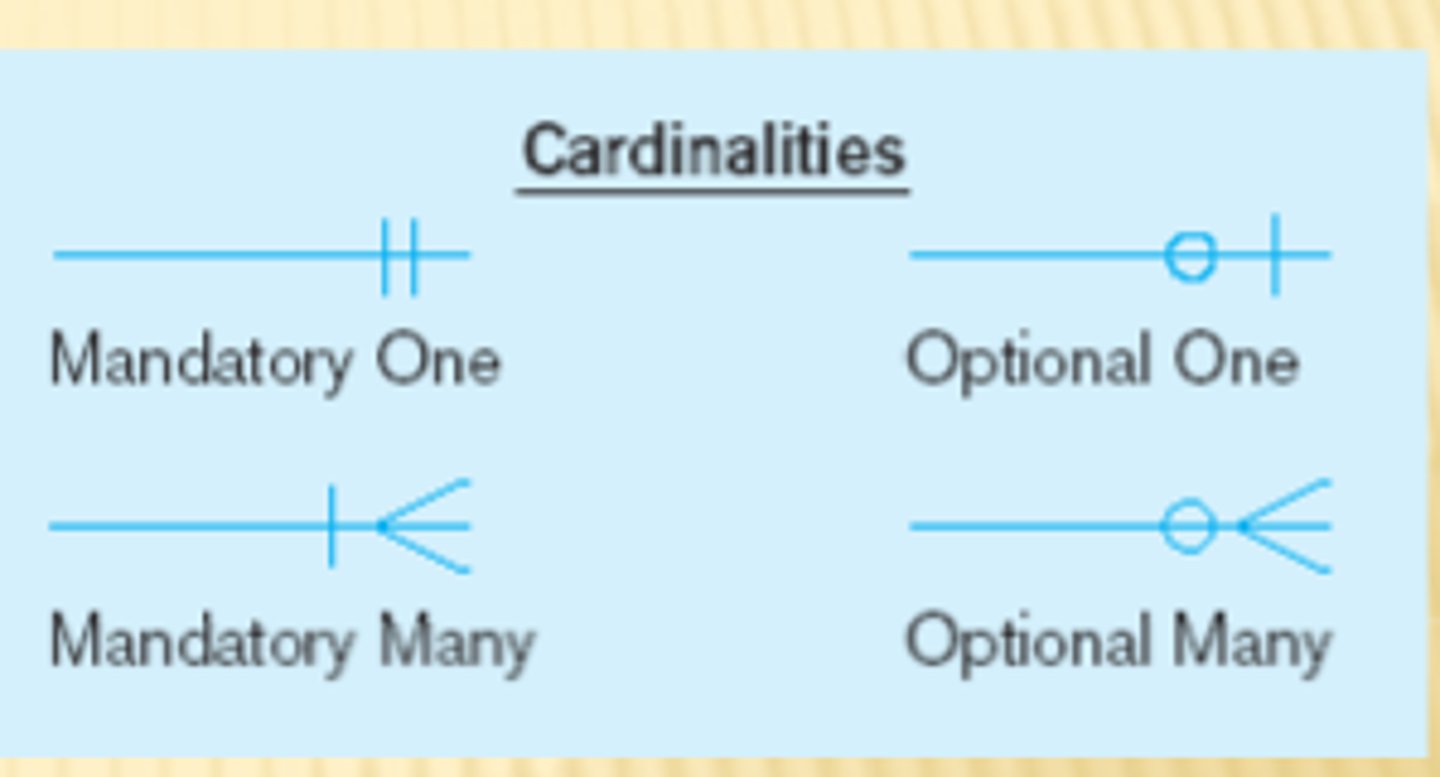
Cardinality
the relationship between two entities, showing how many instances of one entity relate to instances in another entity. You specify cardinality in an ERD with various line endings. The first component of the terminator indicates whether the relationship between two entities is optional or required. The second component indicates whether an entity instance in the first table is associated with a single entity instance in the related table or if an association can exist with multiple entity instances.
Schema
an ERD with the additional details needed to create a database.
Column-family databases
use an index to identify data in groups of related columns.
optimize performance when you need to examine the contents of a column across many rows.
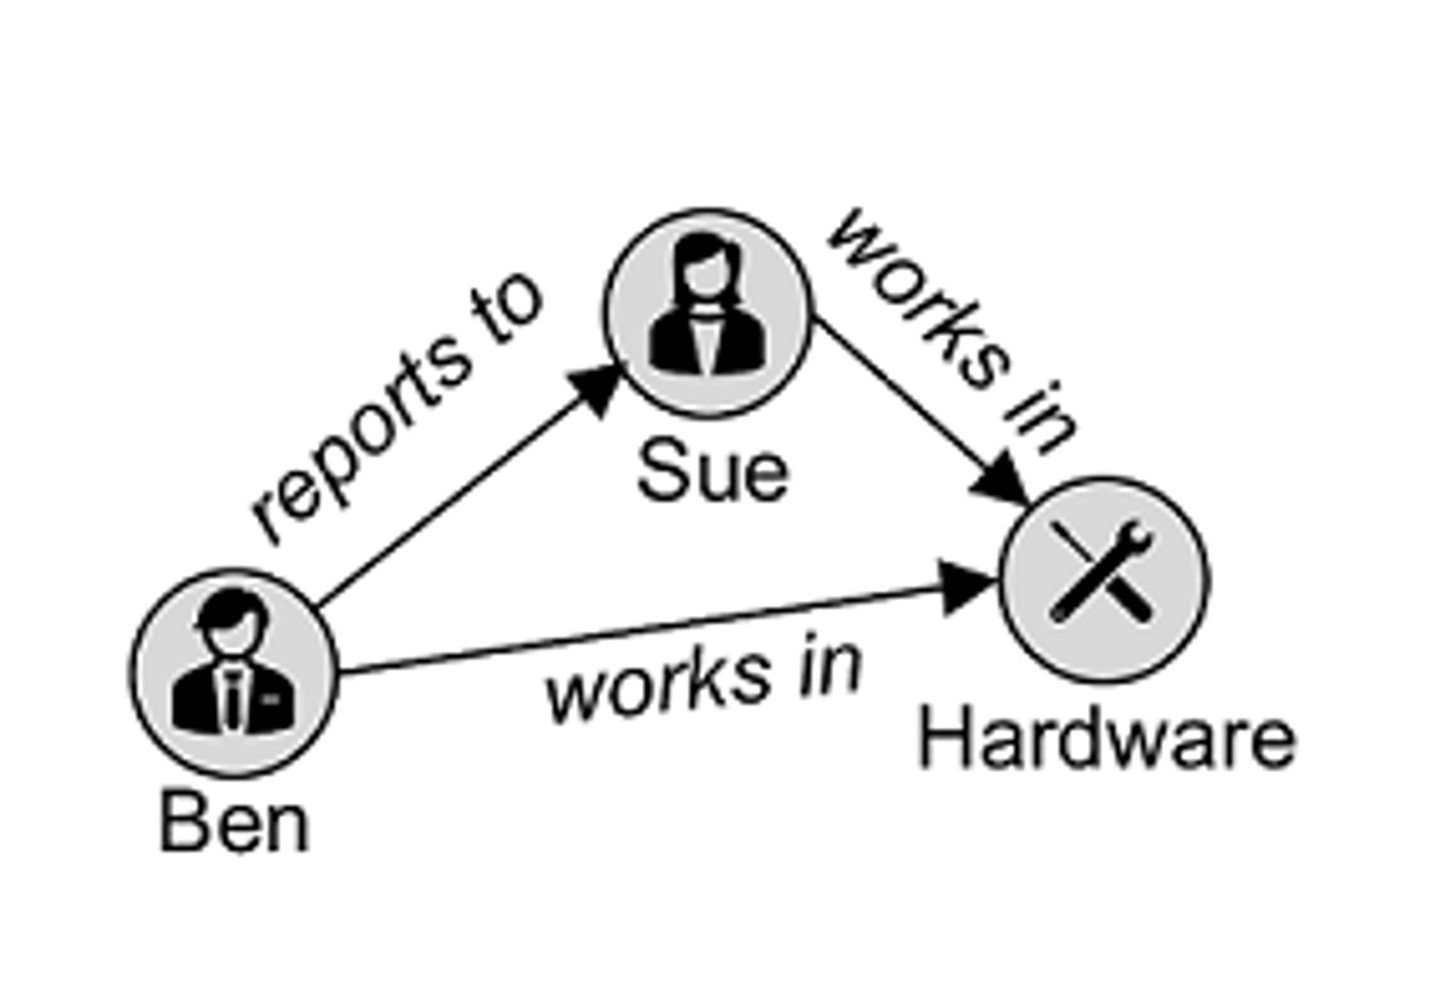
Graph databases
specialize in exploring relationships between pieces of data.
Graph models map relationships between actual pieces of data.
Graphs are an optimal choice if you need to create a recommendation engine, as graphs excel at exploring relationships between data.
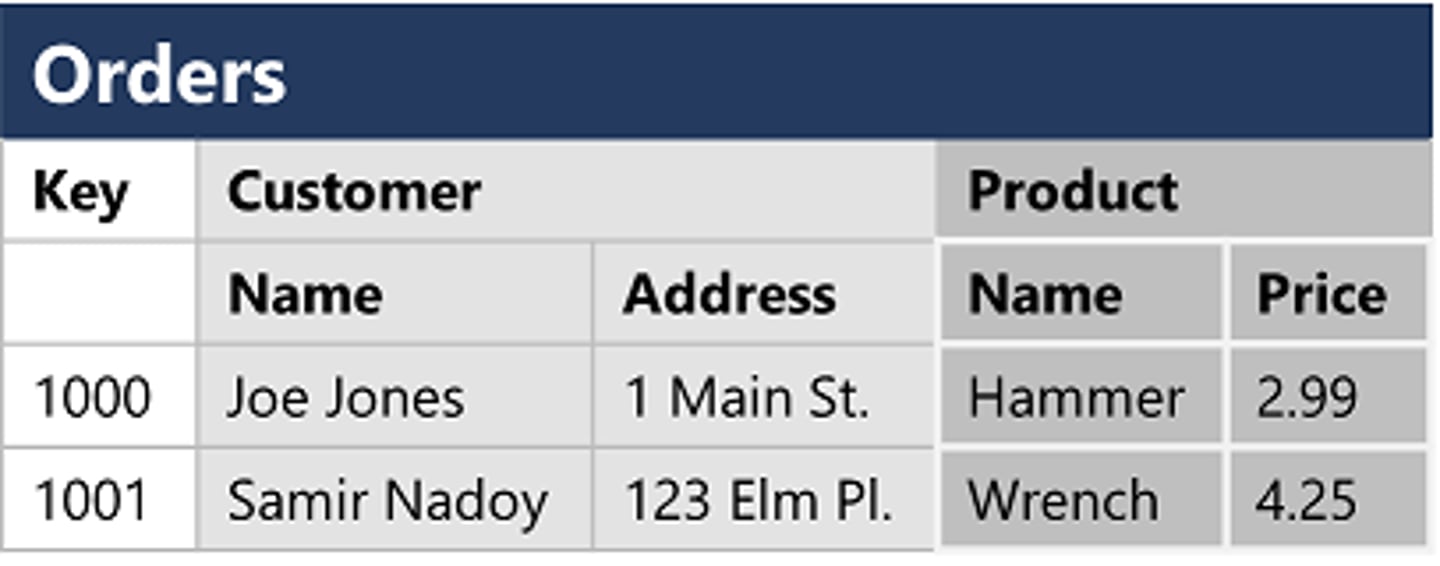
Normalization Process
Objective is to ensure that each table conforms to the
concept of well-formed relations
- Each table represents a single subject
• No data item will be unnecessarily stored in more than one table
• All NONPRIME attributes in a table are dependent on the primary key
• Each table is void of insertion, update, and deletion anomalies
First Normal Form (1NF)
every row in a table is unique and every column contains a unique value.
Second Normal Form (2NF)
After 1NF: In addition to each row being unique, 2NF applies an additional rule stating that all nonprimary key values must depend on the entire primary key.
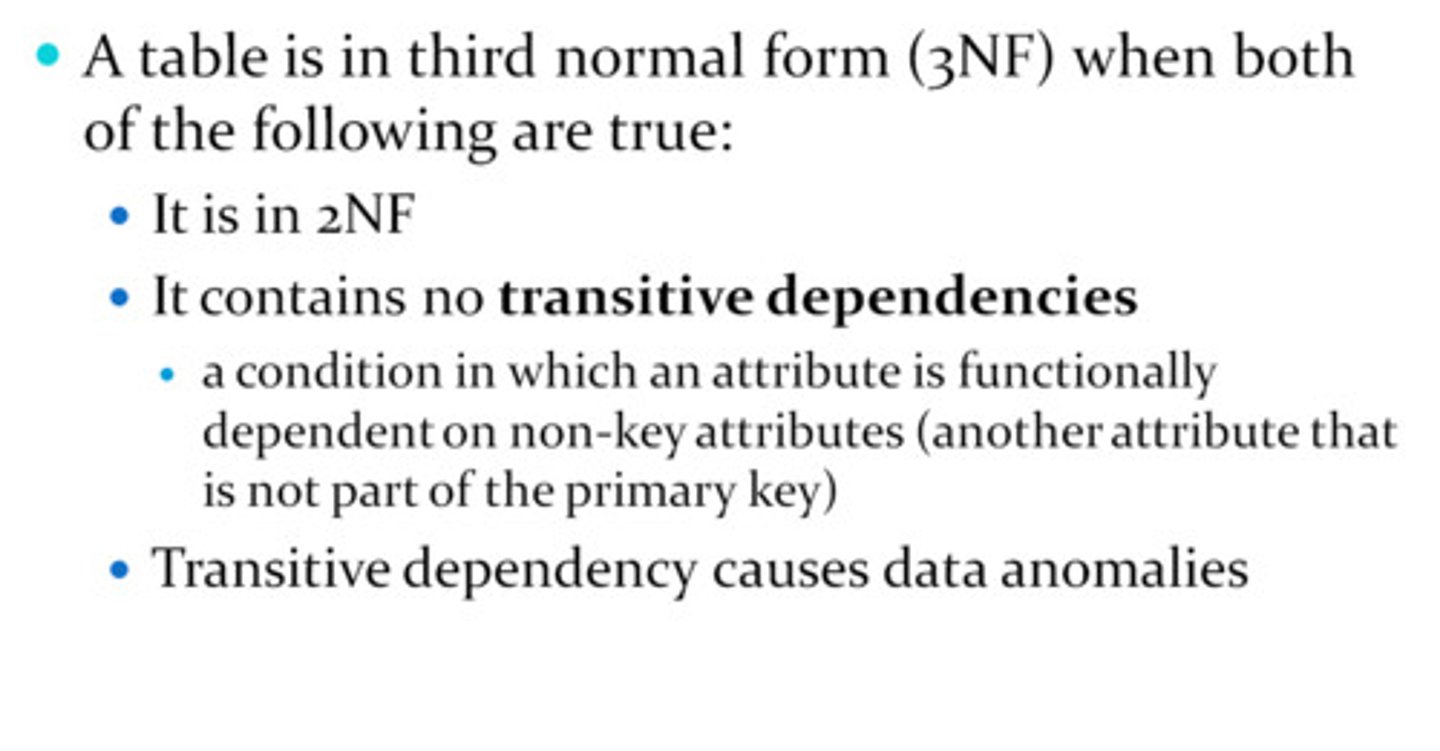
Third Normal Form (3NF)
builds upon 2NF by adding a rule stating all columns must depend on only the primary key.
DB Storage Space
amount of storage a database needs decreases as a function of the degree of normalization. OLTP databases are highly normalized, whereas OLAP databases are denormalized.
ETL & ELT
One key difference between ETL and ELT is the technical component performing the transformation. With ETL, the data transformation takes place external to a relational database, using a programming language like Python. ELT uses SQL and the power of a relational database to reformat the data.
Whether you choose ETL or ELT for loading your data warehouse, you don't have to write transformations by hand. Many products support both ETL and ELT.
Qualtrics Surveys
Instead of designing a custom application to collect survey data, several survey products let you design complex surveys without worrying about building a database. Qualtrics is a powerful tool for developing and administering surveys.
What makes Qualtrics so compelling is its API, which you can use to integrate survey response data into a data warehouse for additional analysis.
Data manipulation in SQL
CRUD (Create INSERT, Read SELECT, Update, Delete)
Common SQL aggregate functions
COUNT MIN MAX AVG SUM STDDEV
Parametrization
using variables in query
DB Index
database index can point to a single column or multiple columns. When running queries on large tables, it is ideal if all of the columns you are retrieving exist in the index. If that is not feasible, you at least want the first column in your SELECT statement to be covered by an index.
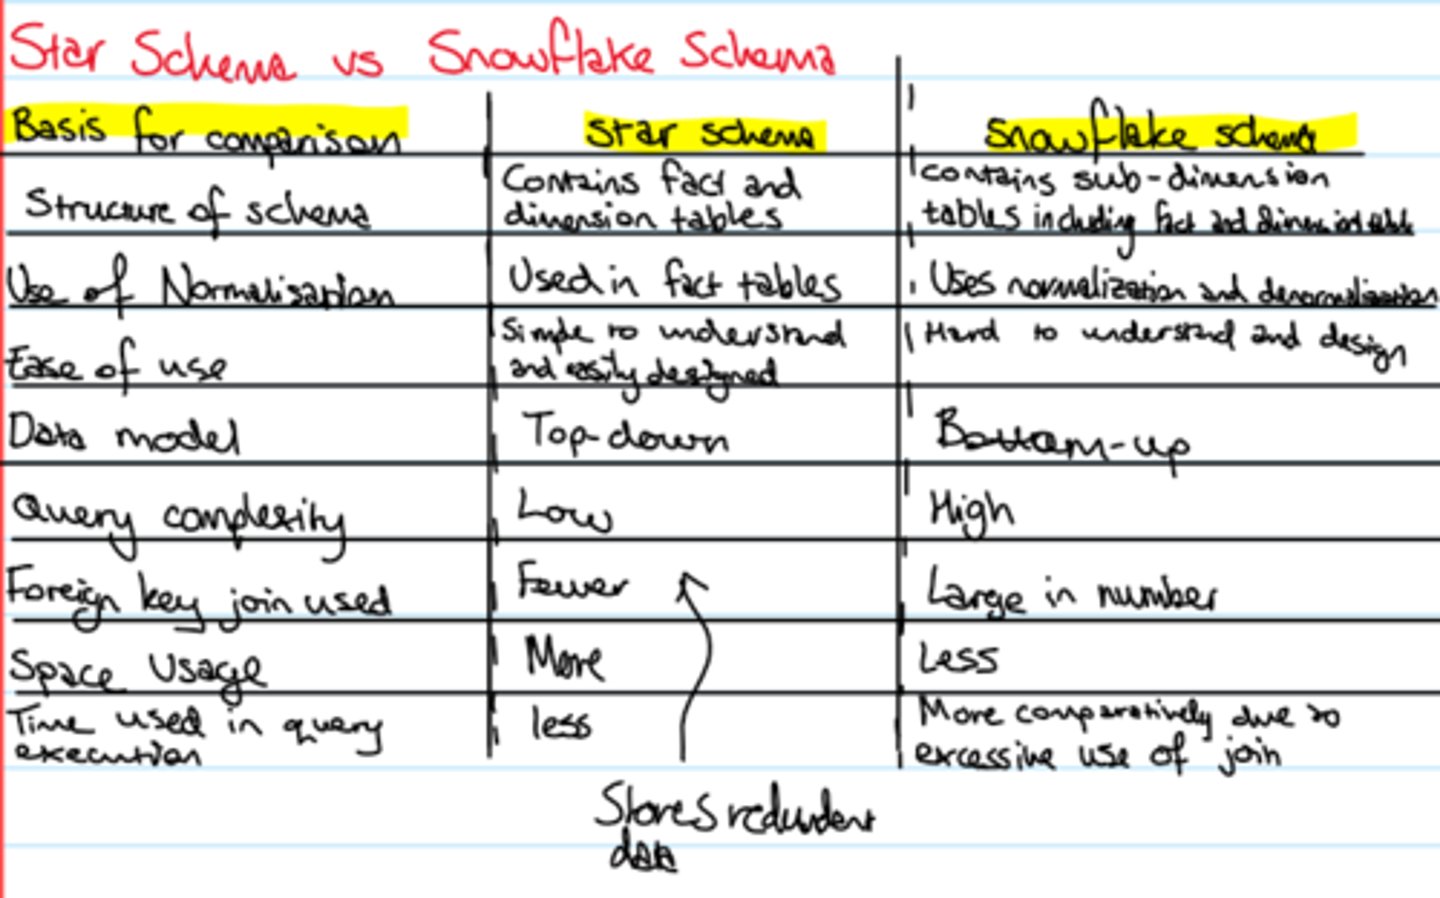
Star and Snowflake Schema
analytical databases prioritize reading data and follow a denormalized approach. The star and snowflake schema designs are two approaches to structuring data for analysis. Both methods implement dimensional modeling, which organizes quantitative data into facts and qualitative data into dimensions.
Historical Analysis
Although an effective date approach is valid, the SQL queries to retrieve a value at a specific point in time are complex. A table design that adds start date and end date columns allows for more straightforward queries. Enhancing the design with a current flag column makes analytical queries even easier to write.
Specification Mismatch
occurs when an individual component's characteristics are beyond the range of acceptable values.
OR
specification mismatch occurs when data doesn't conform to its destination data type. For example, you might be loading data from a file into a database. If the destination column is numeric and you have text data, you'll end up with a specification mismatch. To resolve this mismatch, you must validate that the inbound data consistently map to its target data type.
Recoding Data
technique you can use to map original values for a variable into new values to facilitate analysis. Recoding groups data into multiple categories, creating a categorical variable. A categorical variable is either nominal or ordinal. Nominal variables are any variable with two or more categories where there is no natural order of the categories, like hair color or eye color. Ordinal variables are categories with an inherent rank.
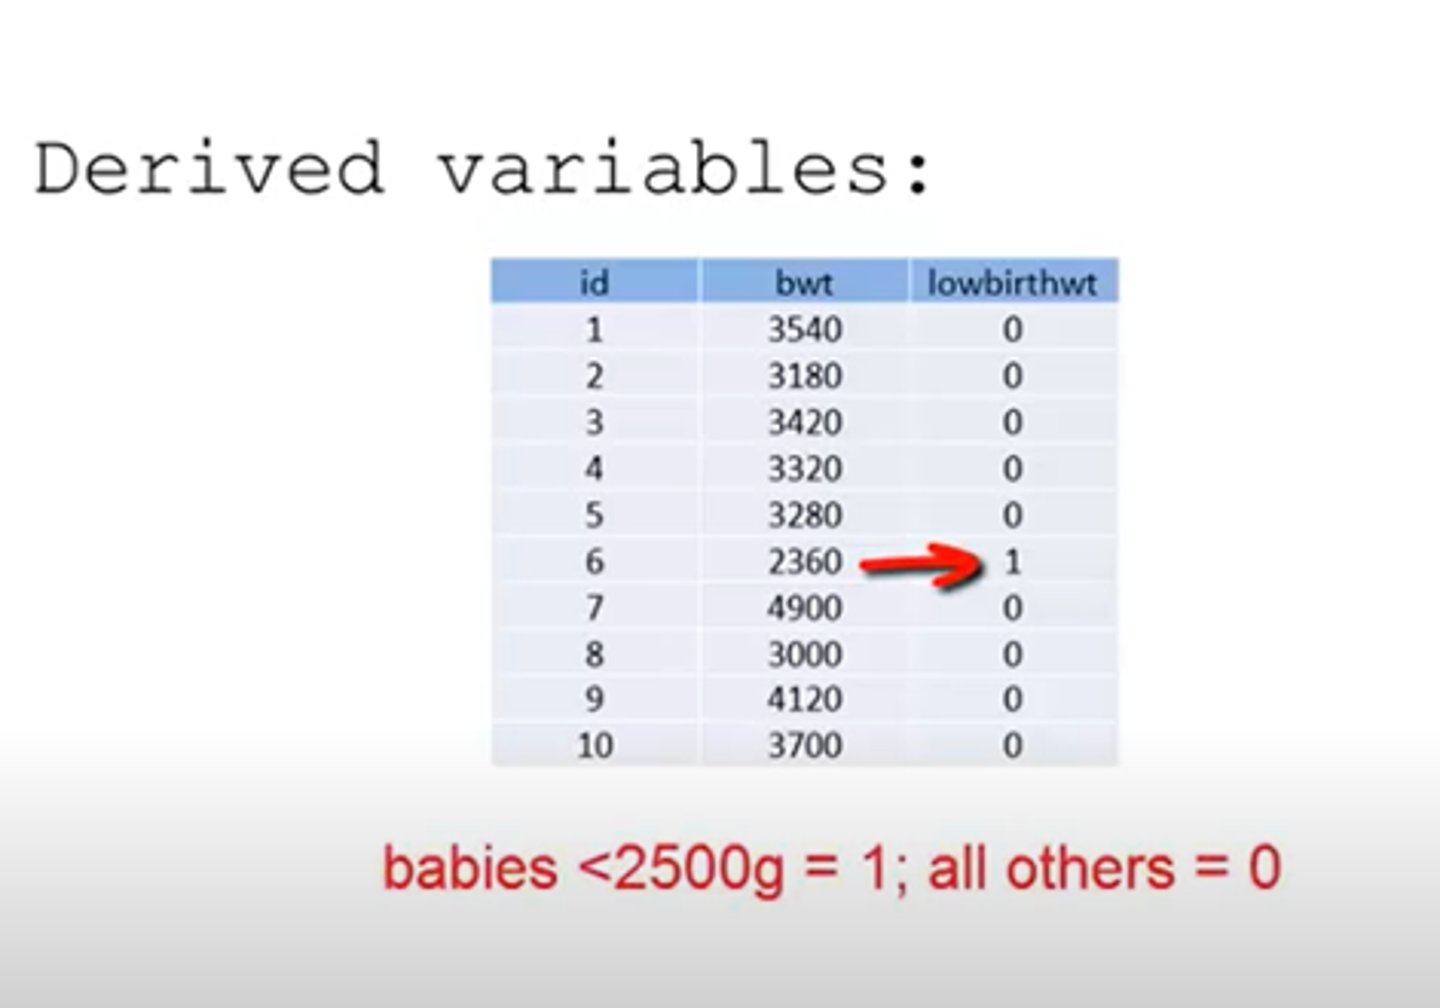
Derived Variable
new variable resulting from a calculation on an existing variable.
Data Merge
uses a common variable to combine multiple datasets with different structures into a single dataset. Merging data improves data quality by adding new variables to your existing data.
Data Blending
combines multiple sources of data into a single dataset at the reporting layer.
Data blending differs from ETL in that it allows an analyst to combine datasets in an ad hoc manner without saving the blended dataset in a relational database. Instead of the blended dataset persisting over time, it exists only at the reporting layer, not in the source databases.
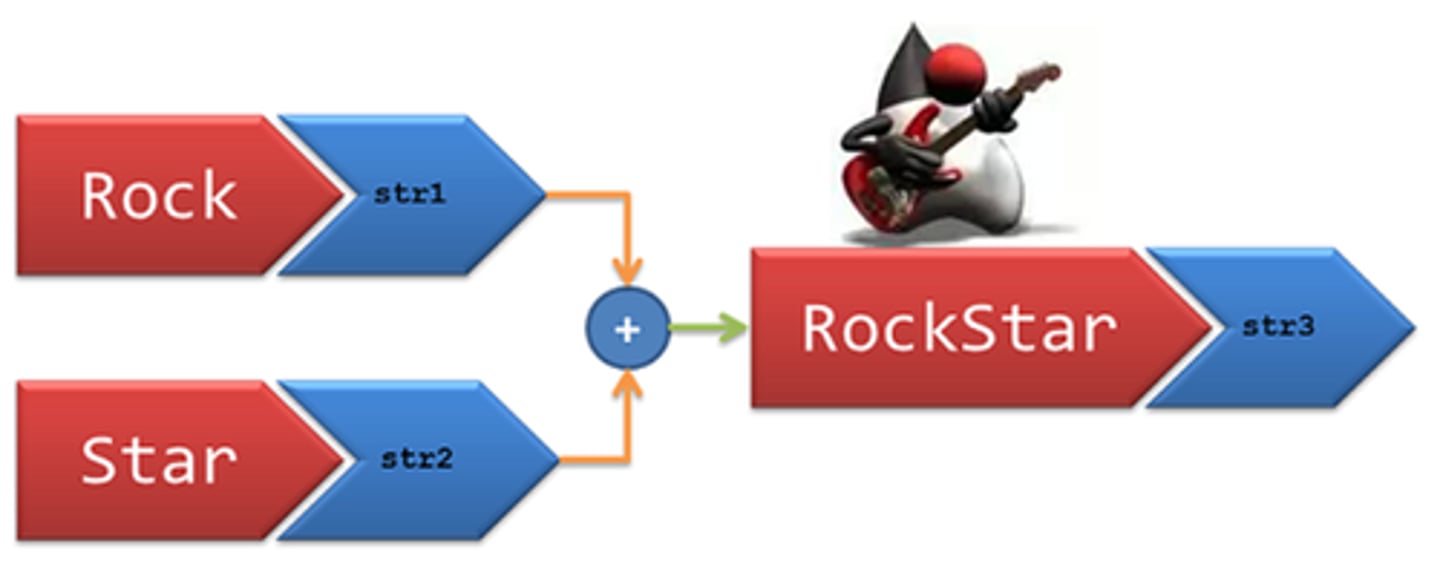
Concatenation
is the merging of separate variables into a single variable. Concatenation is a highly effective technique when dealing with a source system that stores components of a single variable in multiple columns.
Data Append
combines multiple data sources with the same structure, resulting in a new dataset containing all the rows from the original datasets. When appending data, you save the result as a new dataset for ongoing analysis.
Imputation
technique for dealing with missing values by replacing them with substitutes. When merging multiple data sources, you may end up with a dataset with many nulls in a given column. If you are collecting sensor data, it is possible to have missing values due to collection or transmission issues.
Reduction
process of shrinking an extensive dataset without negatively impacting its analytical value. There are a variety of reduction techniques from which you can choose. Selecting a method depends on the type of data you have and what you are trying to analyze. Dimensionality reduction and numerosity reduction are two techniques for data reduction.
dimensionality reduction removes attributes from a dataset.
numerosity reduction reduces the overall volume of data.
Aggregation
summarization of raw data for analysis.
OR
also a means of controlling privacy.
Transposition
Transposing data is when you want to turn rows into columns or columns into rows to facilitate analysis.
Data Profiling
statistical measures to check for data discrepancies, including values that are missing, that occur either infrequently or too frequently, or that should be eliminated. Profiling can also identify irregular patterns within your data.
Data Audits
look at your data and help you understand whether or not you have the data you need to operate your business. Data audits use data profiling techniques and can help identify data integrity and security issues.
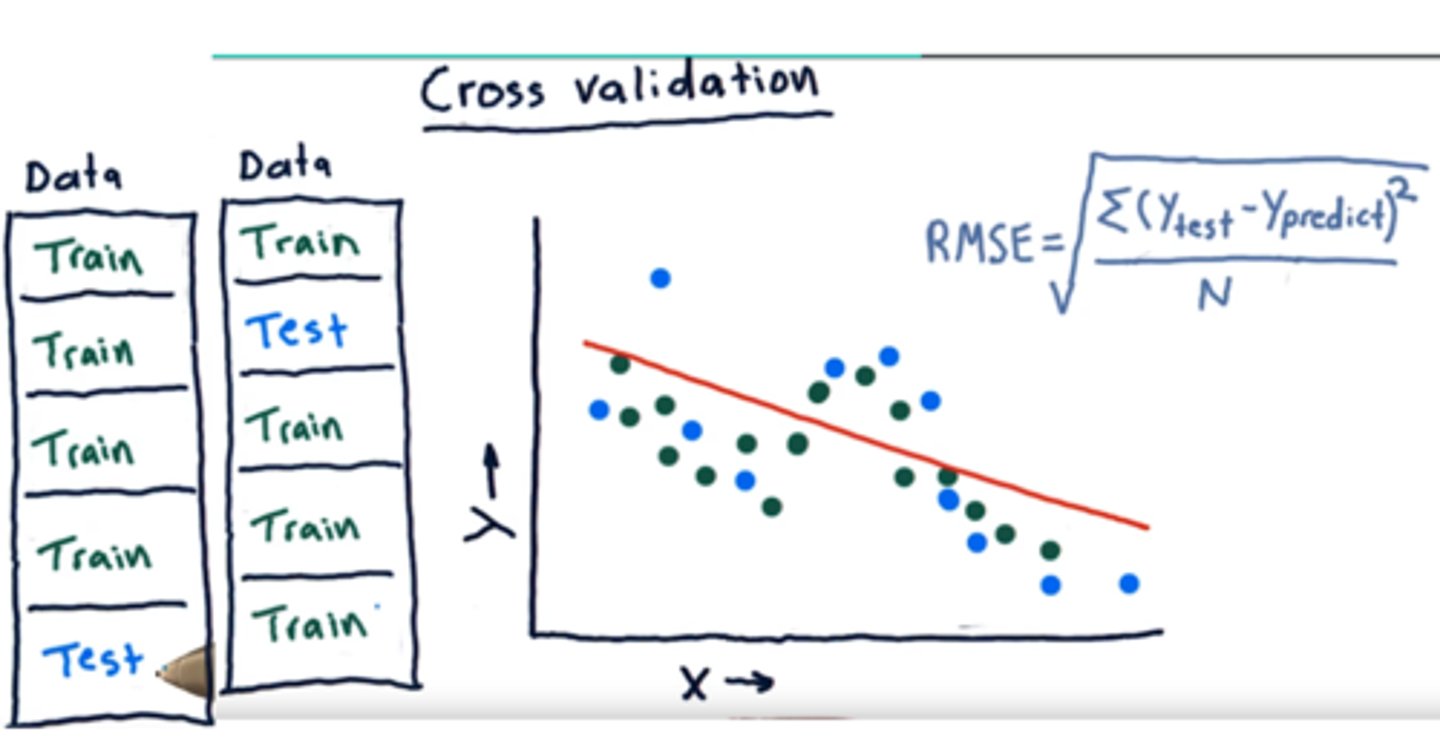
Cross-Validation
statistical technique that evaluates how well predictive models perform. Cross-validation works by dividing data into two subsets. The first subset is the training set, and the second is the testing, or validation, set. You use data from the training set to build a predictive model. You then cross-validate the model using the testing subset to determine how accurate the prediction is. Cross-validation is also helpful in identifying data sampling issues.
Cross-validation can help identify sampling bias since predictions using biased data are inaccurate.
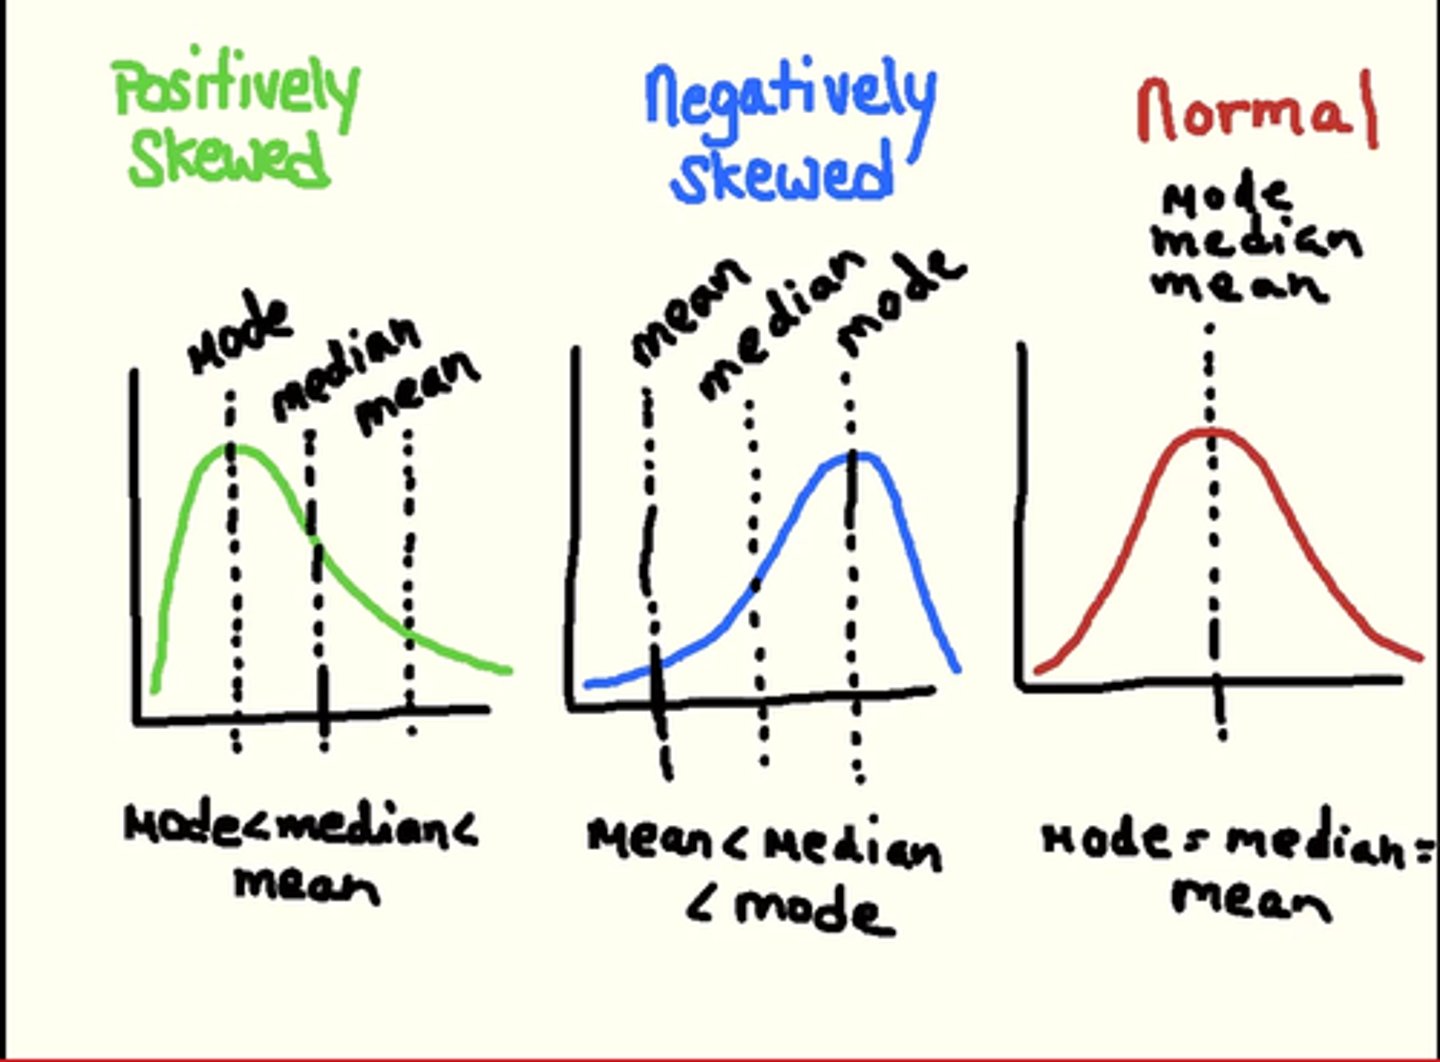
Skewed Distribution
has an asymmetrical shape, with a single peak and a long tail on one side. Skewed distributions have either a right (positive) or left (negative) skew. When the skew is to the right, the mean is typically greater than the median. On the other hand, a distribution with a left skew typically has a mean less than the median.
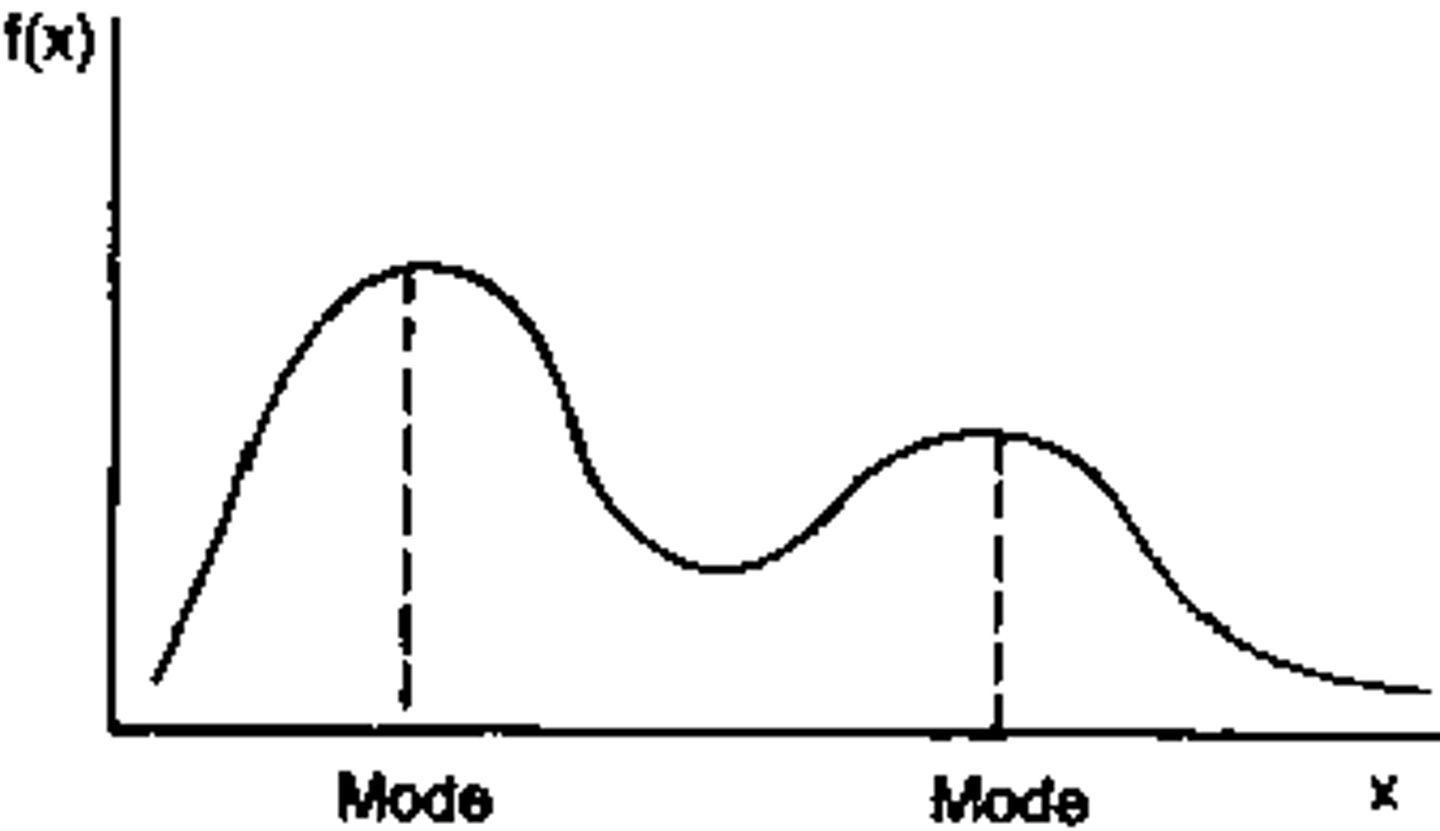
Bimodal Distribution
has two distinct modes, whereas a multimodal distribution has multiple distinct modes. When you visualize a bimodal distribution, you see two separate peaks. Suppose you are analyzing the number of customers at a restaurant over time. You would expect to see a large numbers of customers at lunch and dinner.
Standard Normal Distribution (Z-distribution)
a special normal distribution with a mean of 0 and a standard deviation of 1. You can standardize any normal distribution by converting its values into -scores. Converting to the standard normal lets you compare normal distributions with different means and standard deviations.

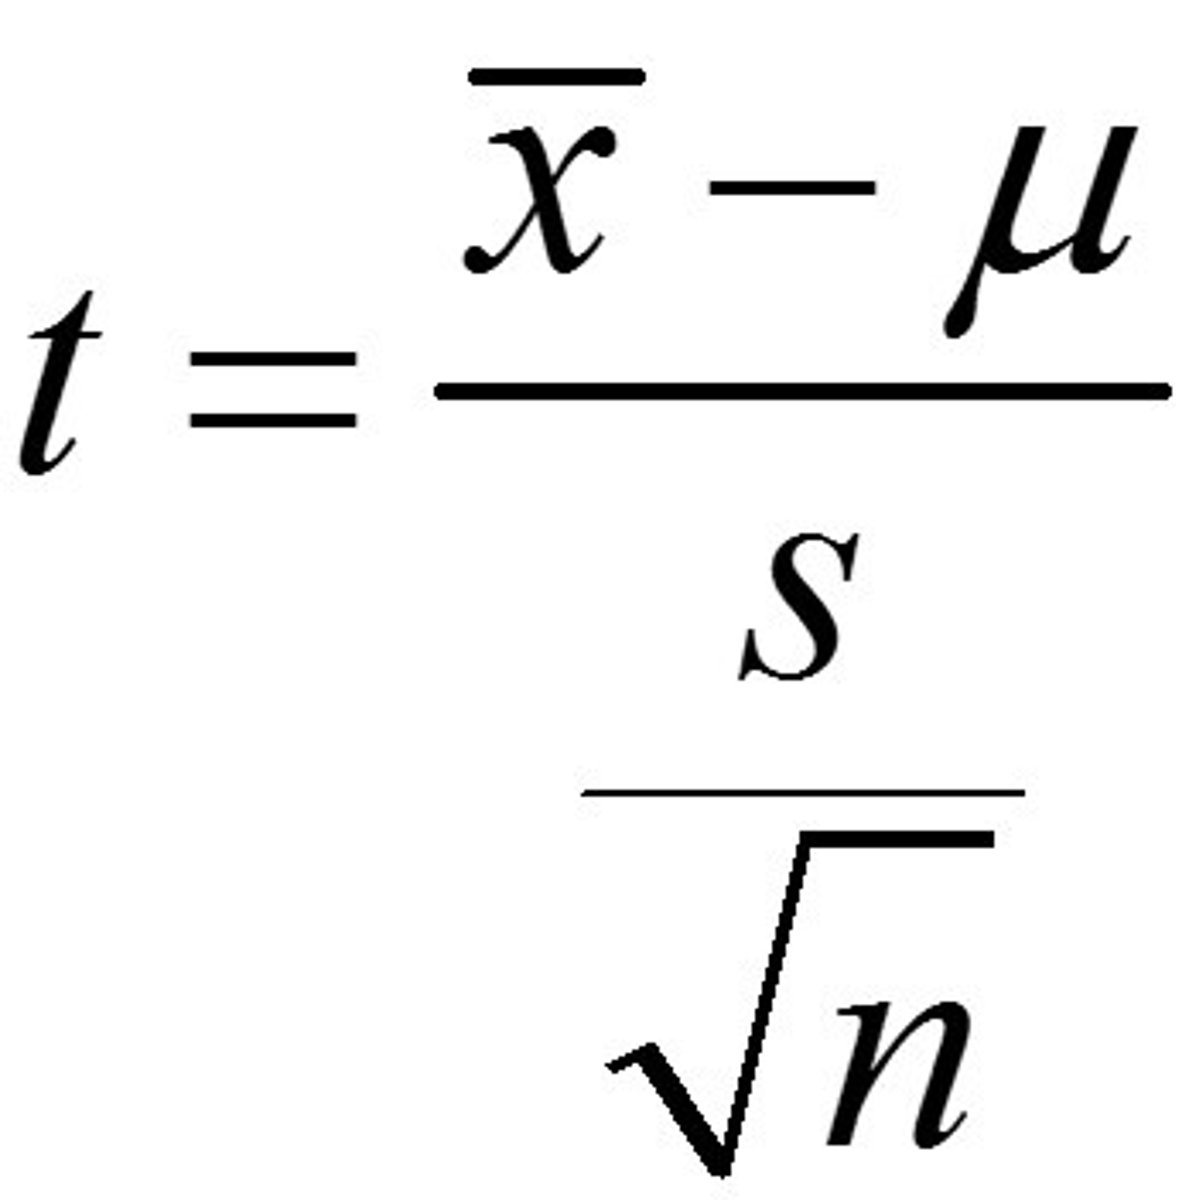
Student's t-distribution
similar to the standard normal distribution in that it has a mean of 0 with a bell-like shape. One way the t-distribution differs from the standard normal distribution is how thick the tails are since you can use the t-distribution for sample sizes of less than 30.
Quartile
The first quartile is the group that starts with the minimum value, whereas the fourth quartile is the group that ends with the maximum value.
Interquartile Range (IQR)
combination of the second and third quartiles and contains 50 percent of the values in the data. When exploring a dataset, recall that outliers can have a significant impact on mean and range. Using the IQR as a dispersion indicator, in addition to the range, improves your perspective since the IQR excludes outliers.
Significance Level (alpha)
probability of rejecting the null hypothesis when it is true.

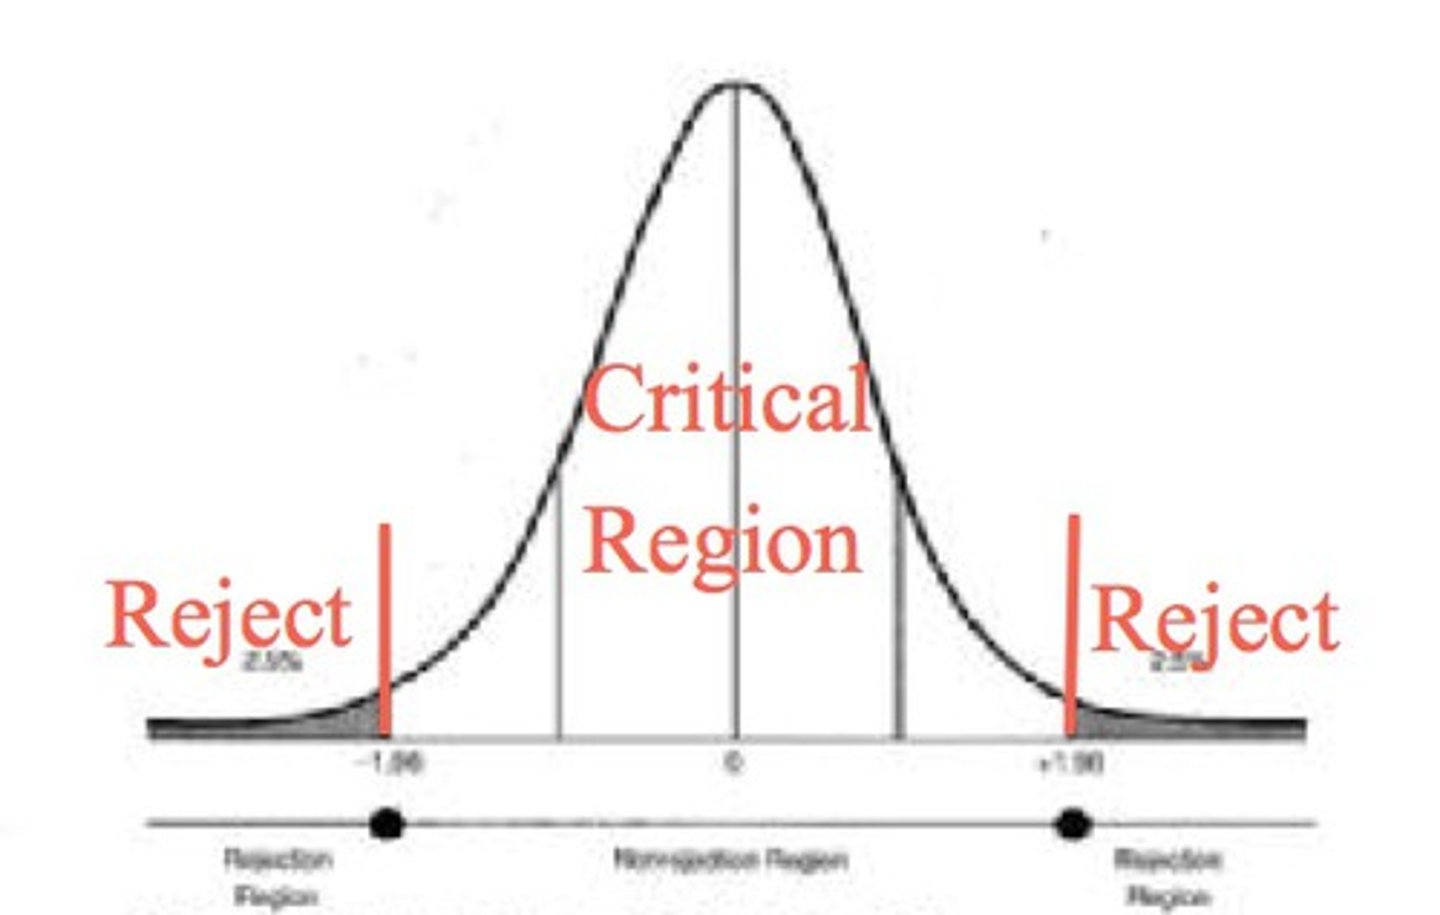
Critical Region
contains the values where you reject the null hypothesis. If your test statistic falls within a critical region, there is sufficient evidence to reject the null hypothesis. Since the area of the critical regions combined is alpha, each tail is half of alpha.
Statistical Analysis Software
Statistical analysis software provides access to advanced statistical environments that are accessible through a graphical user interface and/or a built-in scripting language.
Packages covered on the Data+ exam include IBM SPSS, SAS, Stata, and Minitab.
Machine Learning Software
Machine learning packages offer a set of graphical tools designed to help analysts build machine learning models without requiring them to actually write the code to do so. These machine learning tools aim to make machine learning techniques more accessible. Analysts may still tune the parameters of their models but do not necessarily need to write scripts to do so.
Packages covered on the Data+ exam include IBM SPSS Modeler and RapidMiner.
Data Analytics Suites
Data analytics suites provide powerful capabilities that cross all phases of an analytics process. These tools allow analysts to ingest and clean data, perform exploratory statistical analysis, visualize their data, produce models, make predictions, and communicate and report their results.
Packages covered on the Data+ exam include IBM Cognos, Microsoft Power BI, MicroStrategy, Domo, Datorama, AWS QuikSight, Tableau, Qlik, and BusinessObjects.