Part 2: Inferential Statistics
1/4
There's no tags or description
Looks like no tags are added yet.
Name | Mastery | Learn | Test | Matching | Spaced | Call with Kai |
|---|
No analytics yet
Send a link to your students to track their progress
5 Terms
Confidence Interval
What is a Confidence Interval?
A confidence interval is a range that likely contains the true population mean. Think of it as a gap between two points that shows where the true value is most probably found.
Why Do We Need Confidence Intervals?
Sampling from a population
In statistics, we use a sample (a small group) to estimate characteristics of the population (the whole group).
But samples are not perfect—they don’t exactly represent the population.
Sampling variation
Each sample gives slightly different results. This is called sampling variation—the idea that one sample's mean (average) is unlikely to exactly match the population's true mean.
Example: If you measure the average height of RTR students using Sample 1, Sample 2, and Sample 3, the results will vary. The sample means will not exactly equal the population mean.
How Does a Confidence Interval Help?
Because of sampling variation, we create a range (the confidence interval) where we believe the true population mean is located.
This range gives us a high probability that the population mean falls within it.
Example: If the true population mean is 5.5, the confidence interval might say the mean lies between 5.3 and 5.7.
Key Points About Confidence Intervals:
Definition: A confidence interval is the range of possible values where the true population mean is likely to be.
Components: It always has:
A lower limit: The smallest plausible value.
An upper limit: The largest plausible value.
Formula: The range is typically calculated as:
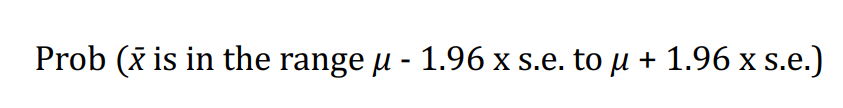
Confidence Interval=μ±(1.96×standard error) (Picture)
Here, μ is the sample mean, and 1.96 corresponds to a 95% confidence level.
Confidence Level vs. Confidence Interval
Confidence interval: The actual range (e.g., 5.3 to 5.7).
Confidence level: The probability that this range contains the true mean (e.g., 95%).
Confidence Level
What is a Confidence Level?
The confidence level tells you how sure you are that the true population parameter (like the mean) lies within the confidence interval.
Key Points:
Percent Probability:
The confidence level is expressed as a percentage (e.g., 95% confidence level).
This means you are 95% confident that the true population mean is within the calculated range (confidence interval).
Definition:
The confidence level is the probability that the population parameter will fall within the specified confidence interval.
Example:
If the confidence level is 95%, it means there’s a 95% chance that the population mean is in the confidence interval (the remaining 5% accounts for possible error).
Formula Recap:
For a 95% confidence level:
Confidence Interval=μ±(1.96×standard error)
Here:
μ: Sample mean.
1.96 A constant used for 95% confidence levels.
standard error Measures the variability of the sample mean.
Simplified Example:
If the average height of a sample is 5.5 feet and the confidence interval is calculated to be 5.3 to 5.7 feet, you can be 95% confident that the true average height of the population is between 5.3 and 5.7 feet.
Continue
Confidence Interval for a Normal Distribution
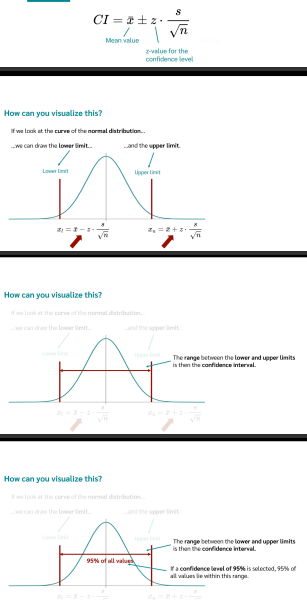
When your data follows a normal distribution, the confidence interval for the mean can be calculated using this formula:
(Refer to the Picture)
Where:
xˉ: Sample mean
z: Z-value corresponding to the confidence level (e.g., 1.96 for 95%)
s: Standard deviation
n: Sample size
Visualizing Confidence Intervals:
If we look at the normal distribution curve:
The curve represents the distribution of data.
Red bars in the image mark the upper limit and lower limit of the confidence interval.
The upper limit is usually greater than the true population mean.
The lower limit is usually less than the true population mean.
Common Question: Do the limits need to be positive or negative?
No, the limits do not need to be strictly positive or negative.
The upper limit and lower limit are simply points on the number line.
Depending on your data:
Both limits can be positive (e.g., if you're measuring height in centimeters).
Both limits can be negative (e.g., if your data represents temperature deviations below zero).
One limit could be negative, and the other positive, depending on the data's distribution and range.
Area Under the Curve and Confidence Interval:
The area under the curve between the upper limit and lower limit represents the confidence interval.
For a 95% confidence level:
95% of the values in the data lie within this interval (the shaded region in the image).
This means you are 95% confident that the true population mean is within this range.
Key Takeaways:
Confidence intervals give a range where the true population mean likely falls.
In a normal distribution, this range is calculated using the formula and visualized as the shaded area under the curve.
The confidence level (e.g., 95%) shows how confident you are that the interval contains the true mean.
So for the confidence level of 95% the z value is 1.96, what is the z value?
this is also known as the standard normal deviation.
The formula that we will use for determining our confidence interval is this one.
Please refer to the PPT for the derivation of formula
For smaller sample CI, we use Students t distribution