Ecology exam 2
1/118
There's no tags or description
Looks like no tags are added yet.
Name | Mastery | Learn | Test | Matching | Spaced | Call with Kai |
|---|
No analytics yet
Send a link to your students to track their progress
119 Terms
Evolution
Change in frequency of alleles from one generation to the next
Is a population phenomenon
Requires variation to exist
Modeled mathematically
“decent with modification”
Talking about changes in the gene pool
Fitness
An individual’s genetic contribution to subsequent generations
Often measured indirectly- survival and reproduction
Where does evolution take place?
Selection acts on individuals
Evolution happens at the population scale
Evolution happens because genetic variation exists in natural populations
Variation within populations arises from:
Genetic mutation
Recombination
Gene duplications
Gene flow among pops
Mechanisms of evolutionary change
Mutation
Genetic drift
Gene flow
Selection
Genetic drift
Random fluctuations in frequencies of alleles
Gene flow
Genetic connectivity among populations
Can bring beneficial alleles
Can reduce effects of selection
Selection
Any process that results in differential survival and/or reproduction among the members of a population
Selection
Natural selection
Favors traits that increase survival and reproduction
Selection
Sexual selection
Favors traits that increase reproductive success, but do not necessarily increase survival
Selection acts on traits
Selective agent
The thing exerting force of selection on an organism
Selection acts on traits
Target of selection
The feature being acted upon by the selective force
Selective forces typically act in three general ways
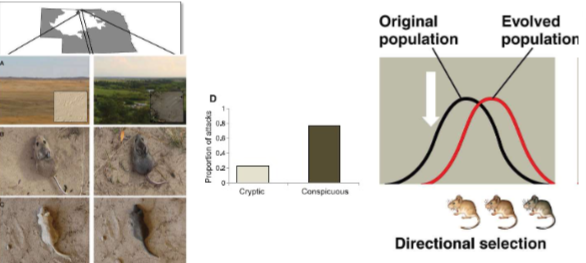
Directional selection
Favors individuals at one end of the phenotypic range
Selective forces typically act in three general ways
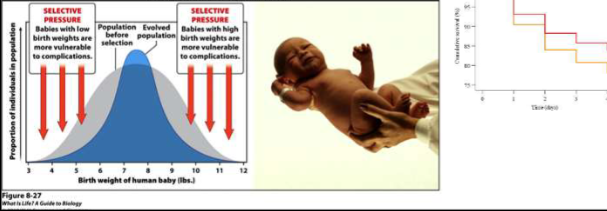
Stabilizing selection
Favors intermediates and acts against either end of extreme variation
Birth weight
Aposematic organisms
Selective forces typically act in three general ways
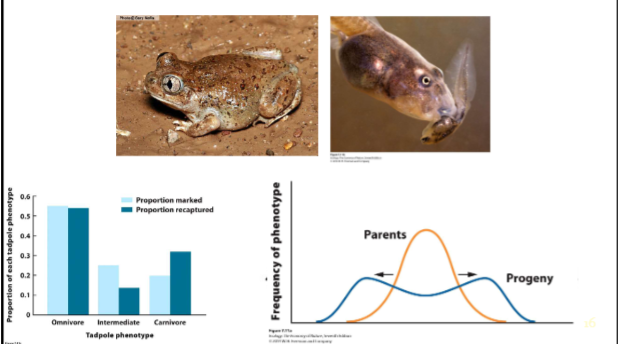
Disruptive selection
Favors individuals at both extremes of the phenotypic range
Strength of selection varies and can be measured
Differences between the mean of a phenotypic distribution before and after selection, measured in units of standard deviation
- Mean swallow mass before selection = 100g; standard deviation = 10g
- Mean swallow mass after selection = 115g
- = (115-100)/10 = 1.5
Regression techniques
Depends on heritability of trait
Selection varies over space and time
Clines
Selection can vary in a patchy manner
Clines
Generally continuous variation in a trait across geographic space
Melanization
Body size
Adaption
An inherited characteristic that enhances an organism’s survival and reproduction
Results from selection
Not everything is an “_____”
- Plasticity
- Pleiotropy can be a cause for a trait
- Some traits are product of genetic drift
Adaptations are not perfect (evolution is not a perfecting process)
Lack of genetic variation
Evolutionary history
Ecological trade-offs
Ecology can influence evolution
Biotic and abiotic factors impose selective forces on individuals → pop. genetic change
Selection on ecological traits can cause reproductive isolation → speciation
Red queen hypothesis
Coevolution
Red queen hypothesis
Organisms have to continuously evolve because their environment and interactions with other species change over time
Coevolution
Reciprocal evolution between species because of their interactions
Behavioral ecology
Study of how behavior is influenced by genetics and the environment
Behavioral ecology
Ecological
Does this behavior influence dist. and abundance
Behavioral ecology
Evolutionary
Are there fitness benefits?
Animal behaviors can be explained at different levels:
Proximate cause
Or how the behavior occurs
Animal behaviors can be explained at different levels:
Ultimate causes
Why the behavior occurs; the evolutionary and historical reasons
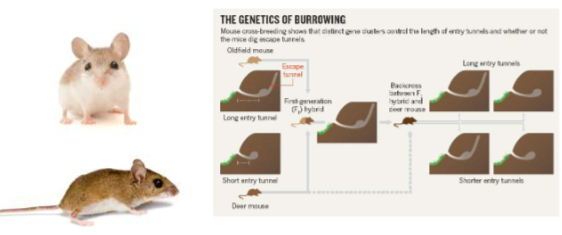
Behaviors reflect underlying genetic architecture
Behaviors can be adaptations
Also influenced by environment
sexual selection
Results from differential reproductive success due to variation among individuals in success at getting mates
Selection for traits that increase fitness, but do not necessarily increase survival
Breaks down into intra and inter sexual selection
Many times females are choosy about their mates
Could be tied to gamete size
Energy invested in reproduction
Benefits of choosiness:
- Good genes
- Resources
Arbitrary or bias
Ecological factors can affect mating decisions
Choosiness can be altered by # of potential mates
Quality of mates
Availability of food
Presence of predators
Presence of competitors
Visual environment
If foraging behavior is an adaptation to limited food supplies, then it must benefit survival and reproduction
Seek to maximize energy intake
Seek to reduce energy spent
- Finding prey
- Handling prey
- Consuming/digesting prey
Seek to reduce vulnerability
Marginal value theorem
Food availability is usually patchy and animals should forage in the most profitable patch until the rate of energy declines to a point
Giving up time - when the point is reached
Distance influence
Assumptions and predictions
Foraging decisions represent trade-offs
Predators affect foraging decisions
Environmental factors also influence
Dietary trade-off’s to maintain defenses
Life history
The lifetime pattern of growth, development, and reproduction for an organism
Optimal maximizes fitness
Life history characteristics include:
Age and size at sexual maturity
Amount and timing of reproduction
- Fecundity- # of offspring per reproductive episode
Survival and mortality rates
Differences exist among individuals, but can look at species average
Types of reproduction
Asexual reproduction
Parthenogenesis - where offspring develop from unfertilized eggs
Clones, ramets, genets
Types of reproduction
Sexual reproduction
Advantage is genetic variation
Disadvantages…
- Parent transmits only ½ its genes
- Males…
Favorable gene combinations disrupted
Complex vs. simple life cycles
Complex life cycles have at least two stages that differ morphologically and ecologically
Simple have direct development
Selection pressured can be different from one life stage to the next in either complex or simple life cycles
Predation vulnerability
- Defensive compounds
Dispersal capability
Dormancy
Thermoregulation
Timing of metamorphosis
Parity
The # of reproductive episodes
Semelparous
Iteroparous
Semelparous
Reproduce only once
Iteroparous
Reproduce multiple times
Parental Investment
Provisioning
Amt of yolk or endosperm
Parental Investment
Parental care
Investment of time and energy in protecting and feeding young
The r-K selection continuum
r-selection
Selection for high population growth rates
Small organisms
Short lifespans
Low parental investment
Rapid development
Most insects, small vertebrates such as mice, weedy plant species
The r-K selection continuum
K-selection
For slower growth
Longer lived
Develop slowly
Greater investment
Lower reproductive rates
Allocation drives trade-offs
Energy and resources are limited
Natural selection favors max fitness
Energy budgets and sexual maturity
Reproductive effort - proportion of energy devoted of reproducing
Trade-off: Lifespan and reproduction
Survival increases age maturity
Delay reproduction: grow faster and reach larger size - benefit?
But reproducing early guarantees offspring
Trade-off: Size and number of offspring
Larger offspring = smaller # of offspring
Seen in many organisms, but not all
Trade-off: Offspring # vs. offspring survival
As offspring # increases, the amount of care per offspring decreases → decreased survival
Lack clutch size - Maximum number of offspring a parent can successfully raise to maturity
Trade-off: Parental care vs. parental survival
More offspring = more work
Parental survival decreases
Inter-specific interactions can drive changes in trade-offs between life history characteristics
Trinidadian guppy work experimentally demonstrated predation can affect life history traits
Species have geographic ranges
All the areas the species occupies
Determined by abiotic and biotic factors
Fundamental niche
Multiple populations
Species not uniformly dist.
Small-scale variation in the environment creates geographic ranges that are composed of small patches of suitable habitat
Endemic
Cosmopolitan
Niche modeling
Fundamental niche
Range of abiotic factors required by a species for its persistence
Endemic
Species that live in a single, often isolated, location
Cosmopolitan
Species with very large geographic ranges that can span several continents
Niche modeling
A model that predicts a specie’s distribution based on abiotic factors (usually)
Where to find something
Invasive species
Historical geographic range
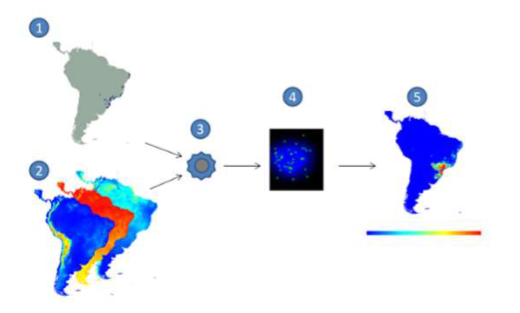
How niche modeling works 101:
Find specimens
Get all of the relevant data to where the species is living (climate, precipitation, temp, humidity, etc.)
Computer calculates and creates a heat map
Population
Group of interacting individuals of the same species living in a particular area at the same time (interbreed)
Multiple populations exist across a species distribution
Fundamental unit of evolution
Metapopulations
Metapopulations
Populations that are made up of groups of interacting subpopulations
World is patchy place
Sources
Sinks
Sources
Pops. in high quality habitats with high growth rates
Sinks
Pops in low quality habitats where growth is low
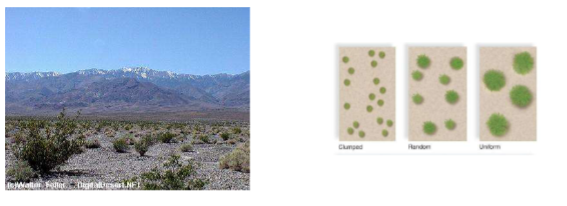
Dispersion
The spacing of individuals with respect to one another
Uniform
Random
Clumped
Uniform
Individuals spread out evenly throughout an area
Competition for space or resources
Random
Dispersal
Clumped
Individuals are clustered in certain portions of the distribution
Resources scarce
Social behavior
Dispersion patterns can change over organism’s life
Mating
Env. Requirements
Example: Creosote bush
Abundance and density
Abundance
The total number of individuals in a population that exist within a defined area
Abundance and density
Density
In a population, the number of individuals per unit area or volume
Mark-Recapture is one method to assess population size
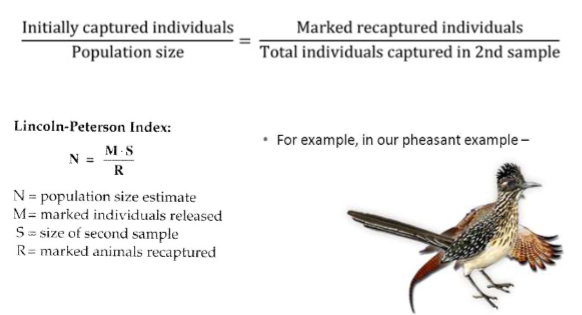
Assumptions for mark-recapture
Population size does not change during sampling period
Each individual has an equal chance of being caught
Marking does not harm individuals or alter their behavior
Marks are not lost over time
Dispersal - the movement of individuals from one area to another
Not migration!
Movement between suitable habitats
Colonize new areas
Population ecology
Explored how biotic and abiotic factors influence populations
Population ecology
What are characteristics of a population?
Density, distribution, size, and age structure of populations
Population ecology
Four factors affect all characteristics of a population
Birth
Death
Immigration
Emigration
One of the ecological maxims is:
“No population can increase in size forever”
What factors affect population size?
What can we measure?
Demographics
Is the study of the vital statistics of a population and how they change over time
Demographics
Vital statistics
The conditions affecting life and the maintenance of population
Birth rates, death rates, survival
Demographics
Study techniques
Life tables
Survivorship curve
Fecundity sched.
Age distribution
Life table
Is a summary of how survival and reproductive rates vary with age
Life Table
Cohort table
Made by following a cohort through life
Life Table
Static life table
Survival assessed from a death assemblage
Life Table
Age class
A category that includes individuals of, or between, a certain age
Life Table
Age structure
Proportion of the population in different age classes
Mortality and reproduction differs in each age class
Parts of a life table concerning survival
x = the age/stage class
n0 - # of original individuals born
nx - # of individuals alive at age class x
sx = survival rate: proportion of individuals that survive to next age class (=nx+1/nx)
dx - # of individuals that die in age class x
qx - age class specific mortality rate (= dx/nx)
lx = survivorship: Proportion of individuals that survive from birth to age x (=nx/n0)
Survivorship curve
Plot survivorship with survivorship on Y axis and age on X axis
Survivorship curve
Type 1:
Most individuals survive to old age (Dall sheep, humans)
Smaller litter
Parental care
Large organisms
Long lifespan
Survivorship curve
Type 2:
The chance of surviving remains constant throughout the lifetime (some birds)
Survivorship curve
Type 3
High death rates for young; those that reach adulthood survive well (species that produce a lot of offspring)
Lots of offspring, low parental care, high predation
Reproductive potential can also be included in life tables (sometimes reproductive tables)
Reproductive potential differs from one age group to the next
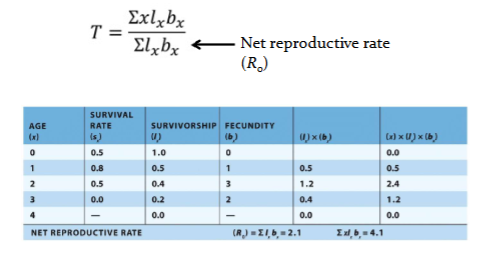
Fecundity= bx (in book = Fx)- Average number of female offspring a female will have at age x
Net reproductive rate
Net reproductive rate
The total number of female offspring that we expect an average female to produce over the course of her life
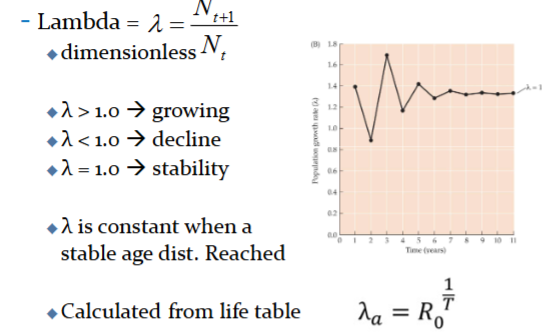
Ro >1: increase
Ro =1: stable
Ro <1: decrease
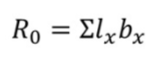
Using survival and reproductive data allows us to look at reproductive rate
Generation time (T)
The average time between the birth of one generation to birth of next gen
We can model population growth and change in age distribution over time
# individuals that will survive to the next time period
# offspring those survivors will produce in the next time period
Stable age distribution
When the age structure of a population does not change over time
Occurs when survival and fecundity of each age class stays constant over time
Sudden change in environmental factors can change birth or death rates
Population growth
Refers to how the number of individuals in a population increases or decreases over time
Open vs. closed populations
Growth rate = #b - #d
Two continuously accelerating growth models
Classic exponential
Continuous reproduction
Generations overlap
Population changes in size by a constant proportion at each instant in time
r= intrinsic growth rate
Two continuously accelerating growth models
Geometric
Discrete breeding seasons
Lambda (λ) = geometric growth rate or per capita finite rate of increase
Details: Geometric growth