CH 7 Derivatives (Done)
1/48
There's no tags or description
Looks like no tags are added yet.
Name | Mastery | Learn | Test | Matching | Spaced | Call with Kai |
|---|
No analytics yet
Send a link to your students to track their progress
49 Terms
BSM Model Takeaways
For American options, the BSM model price rarely matches the price on the option chain.
Instead, the real benefit of the model is backing out (implied) volatility and the Greeks.
“Pricing” isn’t actually a thing for many professionals, outside of market making (which isn’t exactly the same either).
Many traders don’t trade price or directionality but instead trade volatility.
Many traders don’t trade price or directionality but instead trade _________.
volatility
Historical volatility measures how much an asset’s price actually fluctuated in the past.
It is calculated using price data over a specific period of time and is expressed as the annualized standard deviation of returns.
Historical volatility is backward-looking and objective; it is a statistical measurement of what has already happened.
Implied volatility represents the market’s expectation of future volatility.
It is derived from the current prices of options on an asset. The implied volatilities from all the options from all the maturities can be used to construct a volatility surface.
Implied volatility reflects supply and demand for options and incorporates market sentiment about upcoming events or uncertainty.
Higher implied volatility means options are more expensive.
Realized volatility is the actual volatility that occurs over a specific future period.
It is identical to historical volatility in the way it is calculated, but the key difference is the context.
Realized volatility is always compared to implied volatility. When traders compare “realized” versus “implied” volatility, they’re typically looking at whether the volatility that actually happened matched what the options market predicted would happen.
A key limitation of the BSM model is that it assumes volatility is constant. Because volatility is not “given”, it ends up being the most important factor.
And because the BSM model requires a volatility input that isn't directly observable, traders focus on whether the market's implied volatility accurately predicts what volatility will actually be (i.e., realized vol).
Since volatility must be estimated rather than directly observed, traders look for opportunities where implied volatility is mispriced relative to future realized volatility.
Traders compare implied volatility (what the options market expects) to their own volatility forecasts to identify mispricing opportunities.
They look to see if volatility is mispriced because it is “easier” than trying to forecast a stock’s future price and direction.
Suppose you go long volatility; regardless of where the stock’s price ends up, you profit as long as the stock experiences a lot of price movement in either direction.
Greek Letters
Greek letters are the partial derivatives with respect to the model parameters that are liable to change
Usually traders use the Black-Scholes-Merton model when calculating partial derivatives
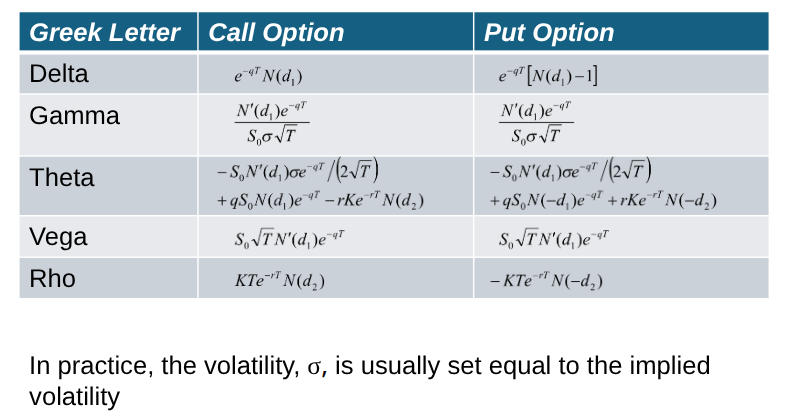
The volatility parameter in BSM is set equal to the implied volatility when Greek letters are calculated. This is referred to as using the “practitioner Black-Scholes” model
First-order Greeks
Greek | Definition |
Delta | Rate of change of option value with respect to the underlying asset price |
Vega | Rate of change of option value with respect to volatility |
Theta | Rate of change of option value with respect to time (time decay) |
Rho | Rate of change of option value with respect to interest rates |
Lambda | Percentage change in option value for a percentage change in underlying |
Epsilon | Percentage change in option value per percentage change in underlying dividend yield |
Delta
Rate of change of option value with respect to the underlying asset price
Vega
Rate of change of option value with respect to volatility
Theta
Rate of change of option value with respect to time (time decay)
Rho
Rate of change of option value with respect to interest rates
Lambda
Percentage change in option value for a percentage change in underlying
Epsilon
Percentage change in option value per percentage change in underlying dividend yield
Second-order Greeks
Greek | Definition |
Gamma | Rate of change of delta with respect to the underlying price |
Vanna | Rate of change of delta with respect to volatility (or, alternatively, the rate of change of vega with respect to price) |
Charm | Rate of change of delta with respect to time (delta decay) |
Vomma | Rate of change of vega with respect to volatility |
Veta | Rate of change of vega with respect to time (vega decay) |
Gamma
Rate of change of delta with respect to the underlying price
Vanna
Rate of change of delta with respect to volatility (or, alternatively, the rate of change of vega with respect to price)
Charm
Rate of change of delta with respect to time (delta decay)
Vomma
Rate of change of vega with respect to volatility
Veta
Rate of change of vega with respect to time (vega decay)
Third-order Greeks
Greek | Definition |
Speed | Rate of change of gamma with respect to the underlying price |
Zomma | Rate of change of gamma with respect to volatility |
Color | Rate of change of gamma with respect to time (gamma decay) |
Ultima | Rate of change of vomma with respect to volatility |
Speed
Rate of change of gamma with respect to the underlying price
Zomma
Rate of change of gamma with respect to volatility
Color
Rate of change of gamma with respect to time (gamma decay)
Ultima
Rate of change of vomma with respect to volatility
The third-order Greeks are rarely used outside of sophisticated trading desks, as their practical impact is usually small and they're computationally intensive to hedge.
The third-order Greeks are rarely used outside of sophisticated trading desks, as their practical impact is usually small and they're computationally intensive to hedge.
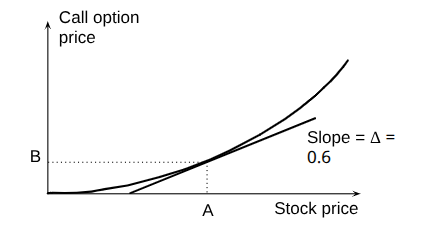
Delta (See Figure 19.2)
Delta (Δ) is the rate of change of the option price with respect to the underlying asset price
Delta Hedging
This involves maintaining a delta neutral portfolio
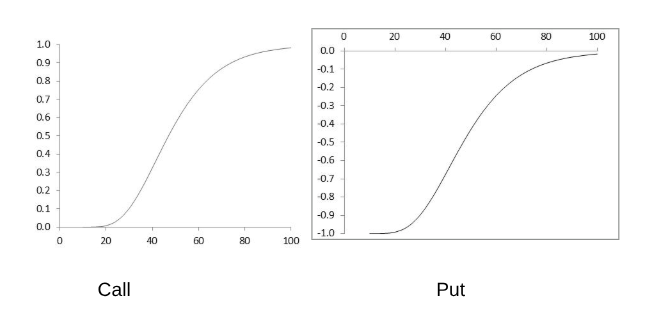
The delta of a European call on a non-dividend paying stock is N (d 1)
The delta of a European put on the stock is
N (d 1) – 1
Delta of a Stock Option (K=50, r=0, σ = 25%, T=2, Figure 19.3)
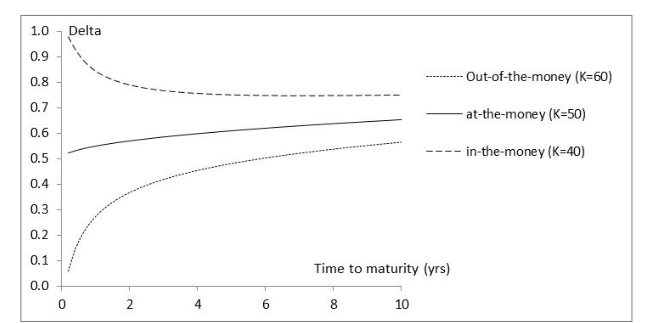
Variation of Delta with Time to Maturity(S0=50, r=0, σ=25%, Figure 19.4)
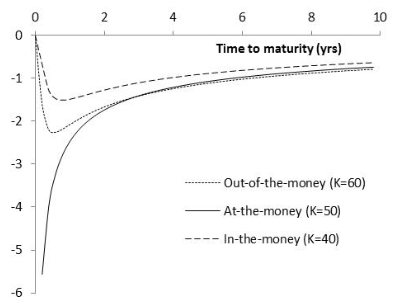
Theta
Theta (Θ) of a derivative (or portfolio of derivatives) is the rate of change of the value with respect to the passage of time
The theta of a call or put is usually negative. This means that, if time passes with the price of the underlying asset and its volatility remaining the same, the value of a long call or put option declines
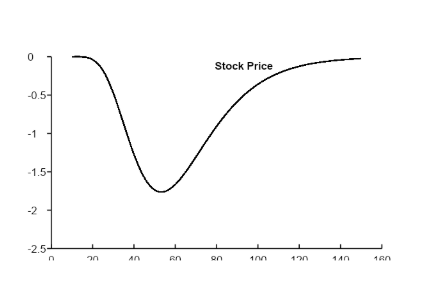
Theta for Call Option (K=50, σ = 25%, r = 0, T = 2, Figure 19.5)
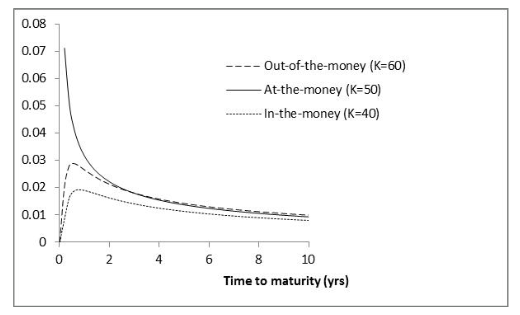
Variation of Theta with Time to Maturity (S0=50, r=0, σ=25%, Figure 19.6)
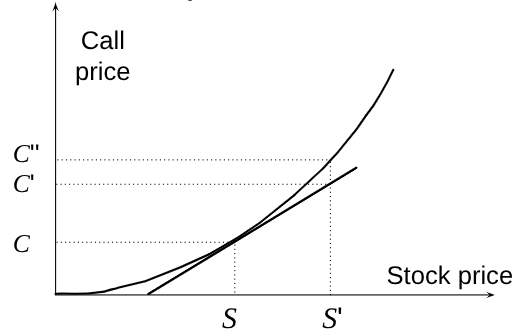
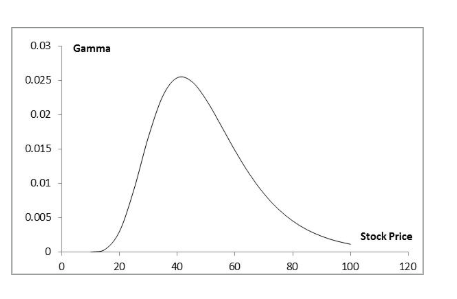
Gamma
Gamma (Γ) is the rate of change of delta (Δ) with respect to the price of the underlying asset
Gamma is greatest for options that are close to the money
Gamma Addresses Delta Hedging Errors Caused By Curvature (Figure 19.7)
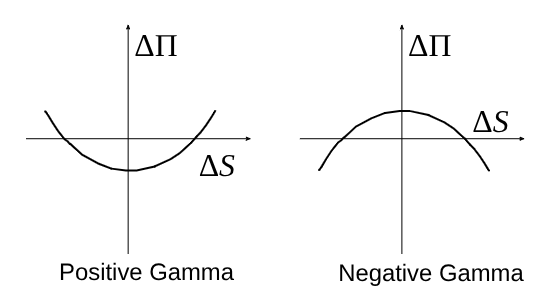
Interpretation of Gamma
For a delta neutral portfolio, ΔΠ ≈ Θ Δt + ½ΓΔS 2
Gamma for Call or Put Option: (K=50, σ = 25%, r = 0%, T = 2, Figure 19.9)
Variation of Gamma with Time to Maturity (S0=50, r=0, σ=25%, Figure 19.10)
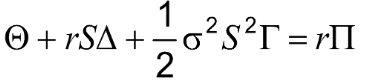
Relationship Between Delta, Gamma, and Theta (equation 19.4)
For a portfolio of derivatives on a stock paying a continuous dividend yield at rate q it follows from the Black-Scholes-Merton differential equation that
Vega
Vega (ν) is the rate of change of the value of a derivatives portfolio with respect to volatility
If vega is calculated for a portfolio as a weighted average of the vegas for the individual transactions comprising the portfolio, the result shows the effect of all implied volatilities changing by the same small amount
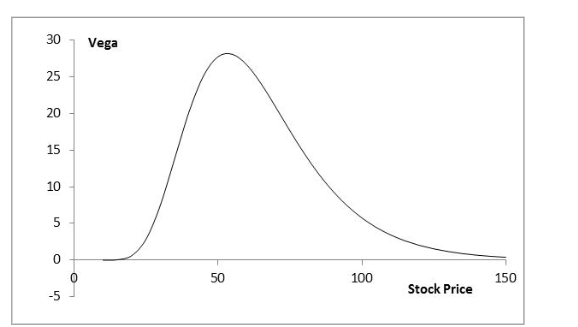
Vega for Call or Put Option (K=50, σ = 25%, r = 0, T = 2, Figure 19.11))
Managing Delta, Gamma, & Vega
Delta can be changed by taking a position in the underlying asset
To adjust gamma and vega it is necessary to take a position in an option or other derivative
Rho
Rho is the rate of change of the value of a derivative with respect to the interest rate
Hedging in Practice
Traders usually ensure that their portfolios are delta-neutral at least once a day
Whenever the opportunity arises, they improve gamma and vega
There are economies of scale
As portfolio becomes larger hedging becomes less expensive per option in the portfolio
Scenario Analysis
A scenario analysis involves testing the effect on the value of a portfolio of different assumptions concerning asset prices and their volatilities
Greek Letters for European Options on an Asset that Provides a Yield at Rate q (Table 19.6)
Futures Contract Can Be Used for Hedging
The delta of a futures contract on an asset paying a yield at rate q is e(r−q)T times the delta of a spot contract
The position required in futures for delta hedging is therefore e−(r−q)T times the position required in the corresponding spot contract
Hedging vs Creation of an Option Synthetically
When we are hedging we take positions that offset delta, gamma, vega, etc
When we create an option synthetically we take positions that match delta, gamma, vega, etc