Hilary ecology and evolution
1/61
There's no tags or description
Looks like no tags are added yet.
Name | Mastery | Learn | Test | Matching | Spaced | Call with Kai |
|---|
No analytics yet
Send a link to your students to track their progress
62 Terms
what are large scale patterns in diversity?
what are species-area curves and what processes explain them? how can this be used in conservation?
species-area curves are a trend in macroecology, the distribution os species across the Earth
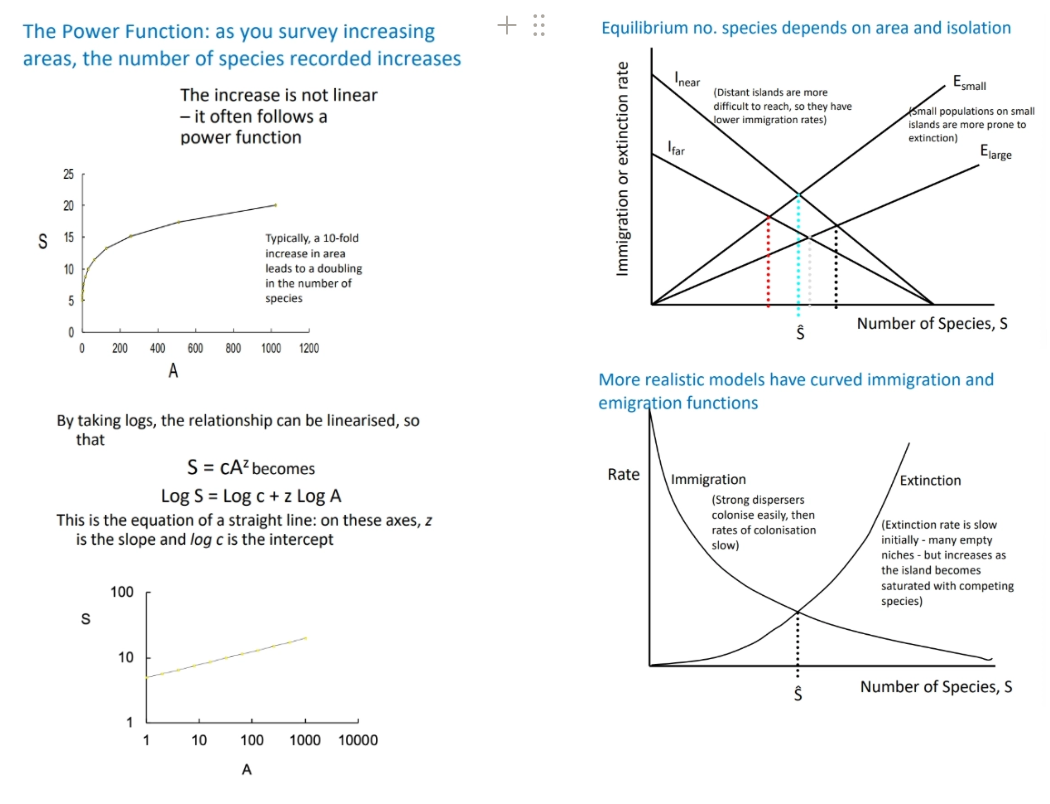
as we survey increasing area sizes, the number of species recorded (species richness) increases with a non-linear (normally power) function S = cAz
we can linearise this relationship by log-transforming the function into log(S) = log(c) + z logA
hypotheses for the mechanisms:
habitat diversity hypothesis- a greater area likely has a wider range of habitat types, supporting a wider range of species
passive sampling hypothesis- the probability that an individual occurs on an island is proportional to island area, independent of other factors- fails to explain diversity on small islands, doesn’t predict species turnover
equilibrium hypothesis- islands closer to the mainland will have more species than further islands because of greater immigration, and larger islands have more space + resources so have lower extinction rates (most realistic models have non-linear immigration + extinction curves), predicts high species turnover
we can use this to predict how many extinctions will occur following area reduction, dependent on z (gradient), and suggest the best ways to slow this (assuming species richness is our conservation interest, and area is the main cause of variations)
we can also use it to design nature reserves- whether it is better to have a single large reserve or several small ones (SLOSS debate), this depends ‘beta diversity’, the degree of species overlap between areas
what are latitudinal gradients and what processes explain them?
latitudinal gradients are a trend in macroecology, the distribution of species across the Earth
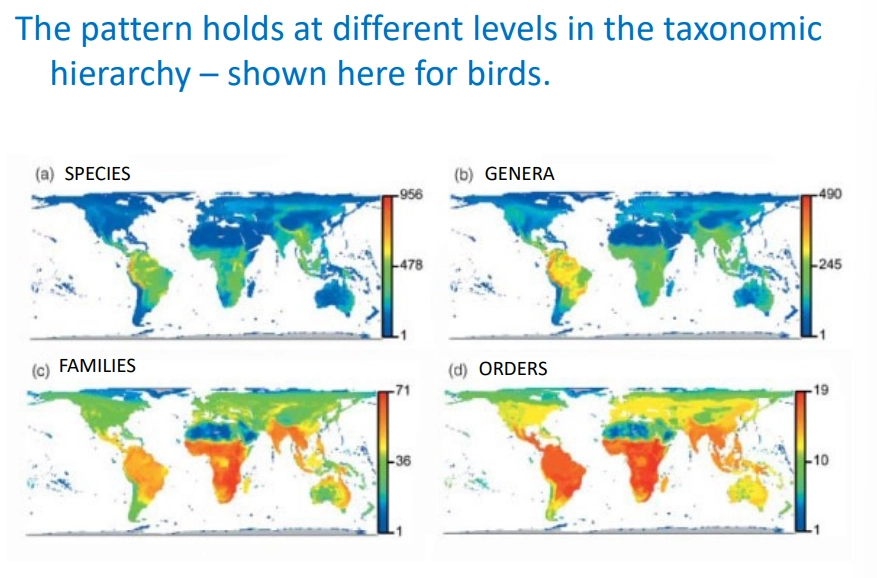
species richness increases with decreasing latitudes (highest near the tropics), both on land and in the sea
there are a few exceptions eg. penguins, but these are unique
competing explanations for the mechanism:
biotic explanations-
productivity- hot, humid places have greater net primary productivity, meaning there are greater resources to support species (doesn’t explain tropical seas + eutrophic lakes)
competition- increasing competition with consistency of climates means there is more niche specialisation
predation- strong top-down control depresses population sizes of prey, which prevents local dominance of any one species, so there is more coexistence
abiotic explanations
time + stability- fewer empty niches in tropical ecosystems because they are older, relatively constant, ecosystems (whereas temperate regions were more recently glaciated)
many of these explanations are circular or make similar qualitative predictions, so it is hard to explain the gradients
tropics also have a greater area, so species-area relationships might play a part, because a larger area means lower extinction rates and increased speciation rates (more geographical barriers)
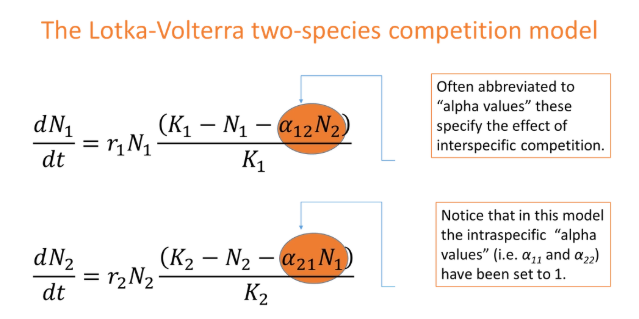
how can we adapt the continuous-time logistic model to account for interspecific competition?
alpha12 = the per capita impact of species 2 on an individual of species 1
alpha12 > 1 means species 2 has a greater relative effect on species 1 eg. larger/more aggressive/uses more resources
at equilibrium, dN1/dt = 0, which simplifies the equation to 0 = K1 - N1 - alpha12*N2
N1 = K1 - alpha12*N2 → y = mx + c (zero net growth isocline, ZNGI- we don’t expect the population to change at any point on this line)
the y intercept = K1, so when population 1 reaches equilibrium, in the absence of population 2, it will reach its carrying capacity
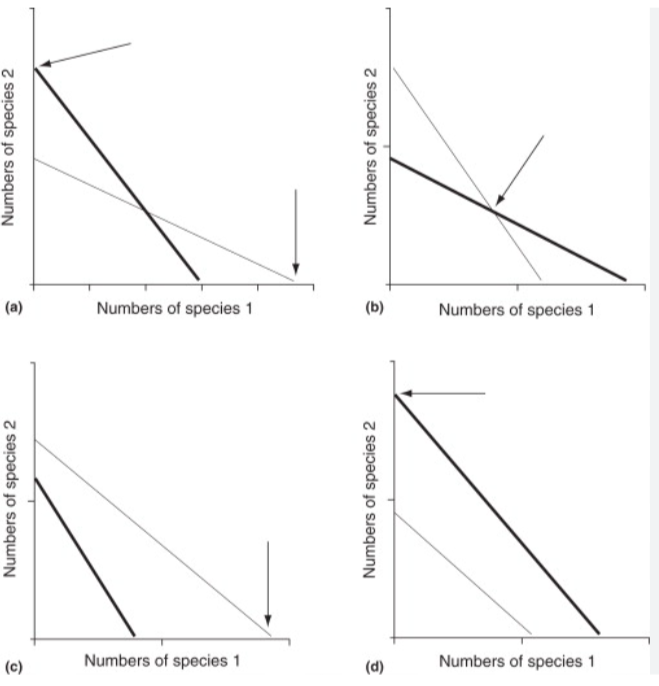
what are the four possible outcomes of the 2-species lotka-volterra competition model?
competitive exclusion- one species goes extinct (two options, dependent on which species is the superior competitor- isoclines don’t cross over)
stable coexistence- equilibrium, only possible if the species have different niches, so intraspecific competition is greater than interspecific competition
unstable equilibrium- one species outcompetes the other, dependent on initial conditions
what are the different continuous models for population growth and what are their limitations?
linear function:
N = mt + c
dN/dt = m
this means the population growth rate is independent of N, which isn’t sensible
negative values are also possible
exponential model:
Nt = N0 ert
dN/dt = rN
this means the absolute growth rate is proportional to the population size, which is sensible
exponential decay tends towards 0, so negative values aren’t possible
1/N dN/dt = r
the per capita growth rate is constant, no matter how big the population gets, so this doesn’t account for environmental constrictions
logistic model:
dN/dt = rN [(k-N)/k] where k is the carrying capacity of the environment, and r is the instrinsic rate of population increase
this model gives exponential growth in small populations, which decreases to 0 nearing the carrying capacity, which is sensible
1/N dN/dt = r [(k-N)/k)]
so when N is small, the per capita growth rate is equal to the intrinsic growth rate, but decreases linearly with increasing N
this takes into account (negative) density dependence
however this model is still basic
what determines r and k in population modelling?
r is the intrinsic growth rate, which is a life-history dependent trait (picture)
k is the carrying capacity (the maximum number of individuals that the environment can support)- this is not a life-history dependent trait
however it is environment dependent- due to weather, acorn masting events etc
k can then be made a random variable across a normal distribution

what is the discrete time logistic model?
(the continuous time logistic model is dN/dt = rN [(k-N)/k])
this is an iterative model, where the absolute growth rate = Nt+1 - Nt, and the per capita growth rate = (Nt+1 - Nt)/Nt
this can be modified so that K is a variable across a normal distribution, rather than a constant, to account for environmental stochasticity
this is a deterministic equation- if you know the values of Nt, k and r, you will obtain the same population prediction every time, which isn’t realistic
![<ul><li><p>(the continuous time logistic model is dN/dt = rN [(k-N)/k])</p></li><li><p>this is an <strong>iterative </strong>model, where the absolute growth rate = N<sub>t+1</sub> - N<sub>t</sub>, and the per capita growth rate = (N<sub>t+1</sub> - N<sub>t</sub>)/N<sub>t</sub></p></li><li><p>this can be modified so that K is a variable across a normal distribution, rather than a constant, to account for environmental stochasticity</p></li><li><p>this is a <strong>deterministic </strong>equation- if you know the values of N<sub>t</sub>, k and r, you will obtain the same population prediction every time, which isn’t realistic</p></li></ul><p></p>](https://knowt-user-attachments.s3.amazonaws.com/e7b50f57-088a-4e78-88eb-e8ba8a324456.png)
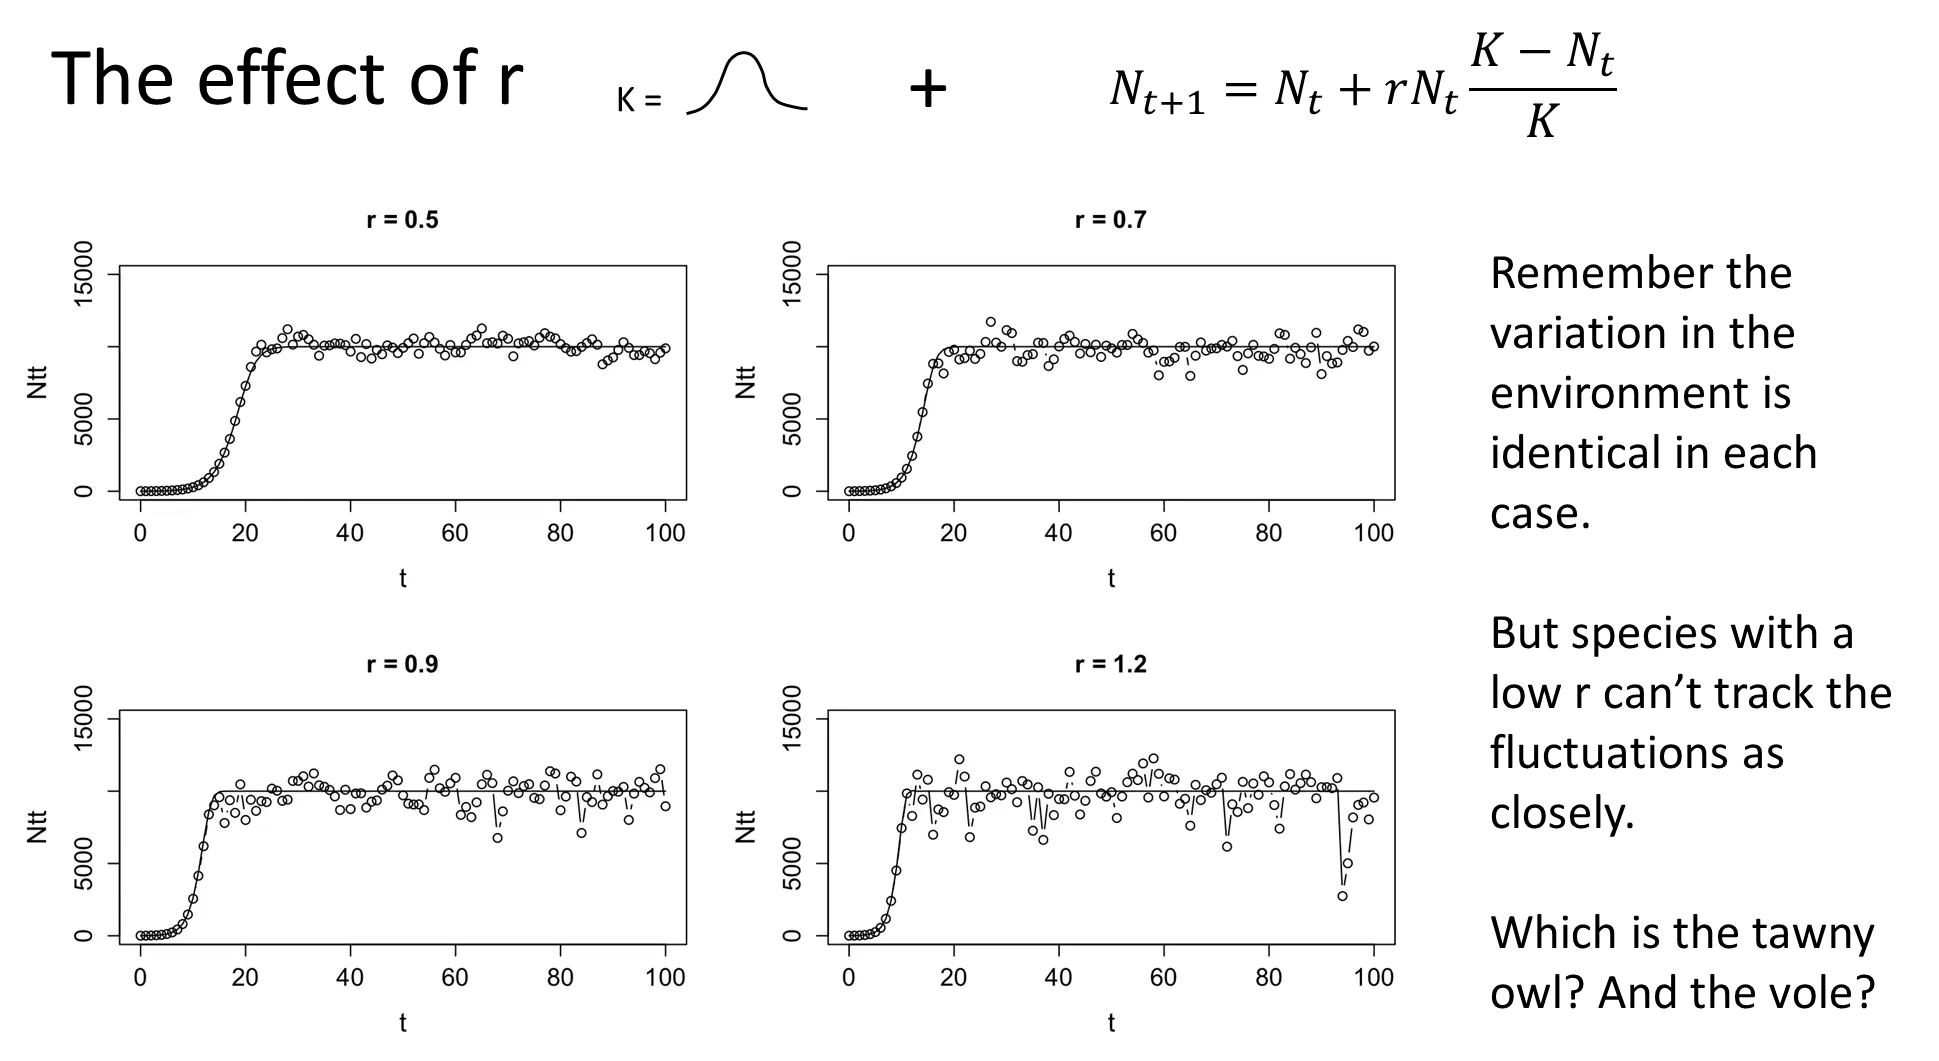
how does r affect the fluctuations in a population and its ability to recover from crashes?
as r increases, the ability of a population to track/follow stochastic variations in the environment increases, so the population fluctuates much more
species with low r are less affected by environmental stochasticity, and vice versa
as r increases, the ability of a population to recover from catastrophic events increases
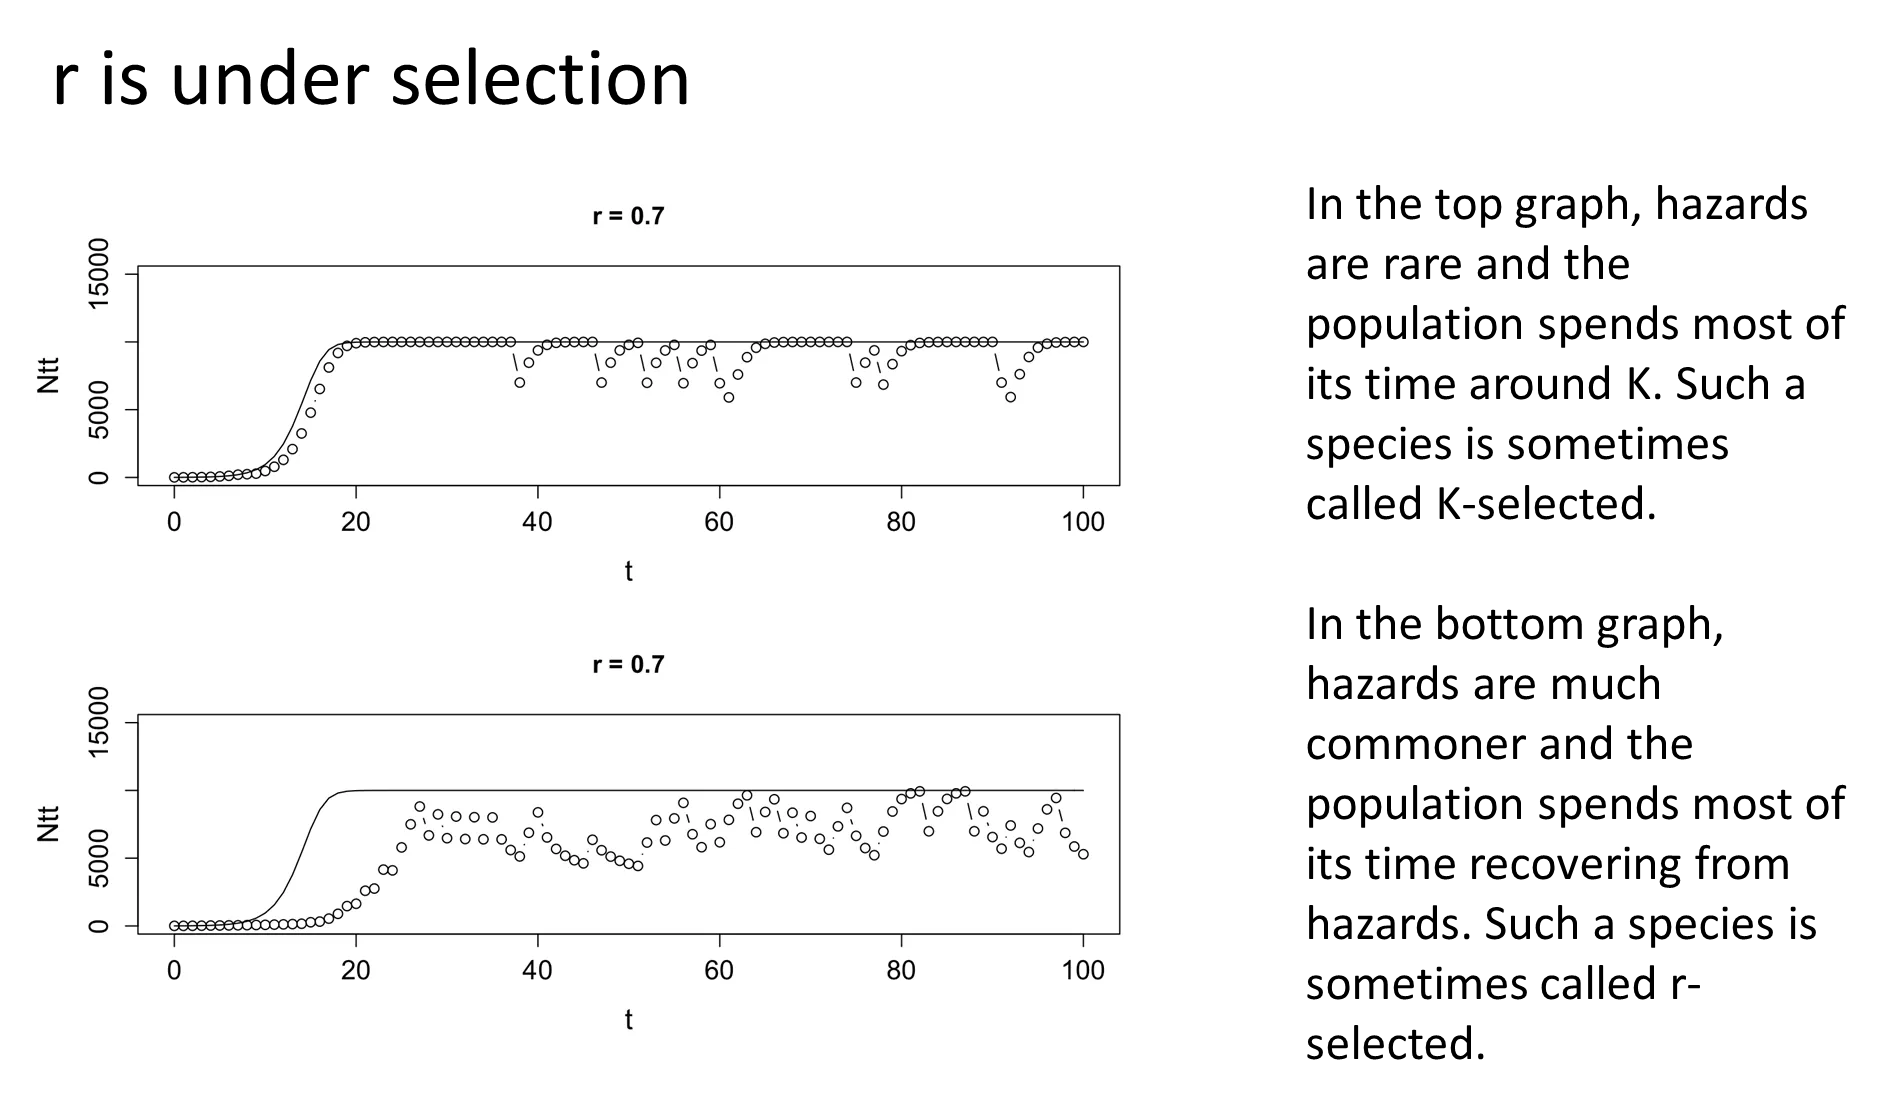
how do species evolve different r values?
r is selected based on the environment a population is in
when you live in a non-hazardous environment, your population is more dependent on stochastic variations of k, so a low r is favoured (k-selected):
resource competition favours large body size, late maturation and few, large offspring eg. seabirds, elephants + whales
when you live in a hazardous environment, your population spends more time recovering from crash events, so a high r is favoured to bounce back faster (r-selected):
recovery phases favours small body size, large, frequent litters and early sexual maturity eg. rabbits + rodents
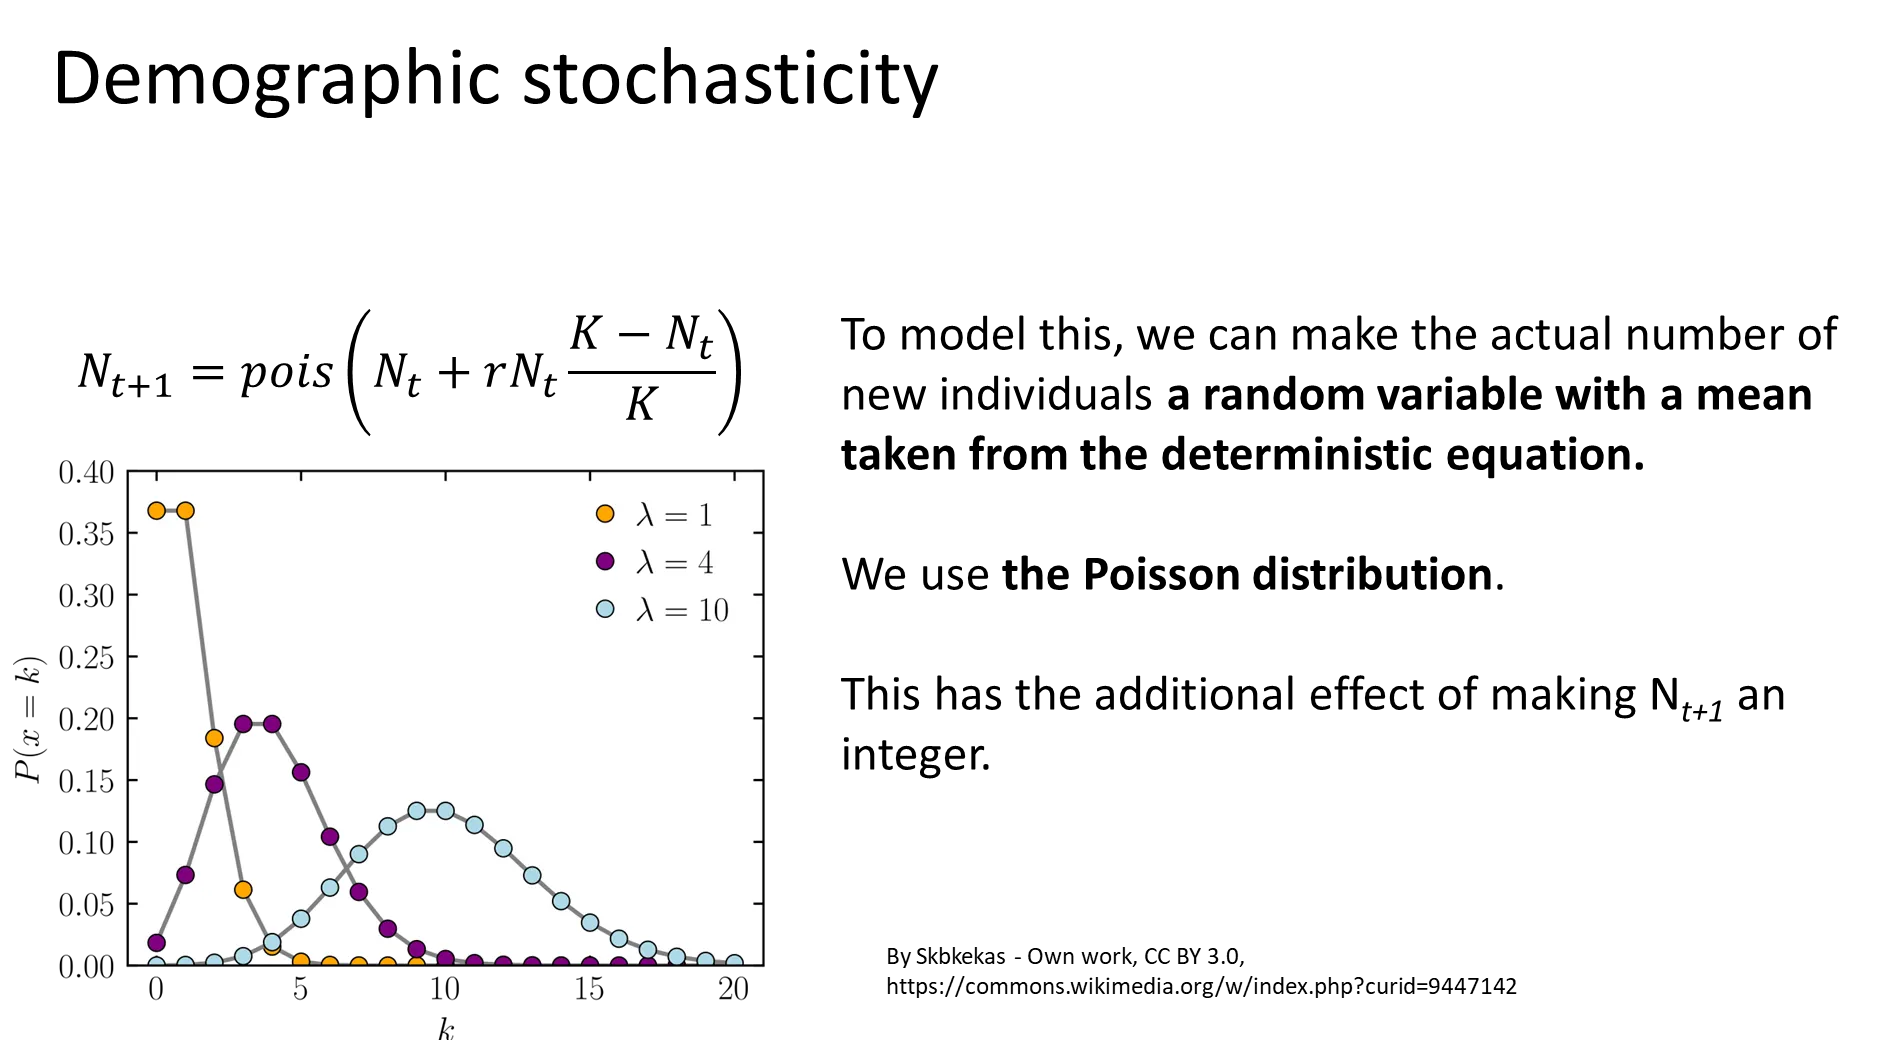
what is demographic stochasticity and why does it matter?
demographic stochasticity is fluctuations in population size that occur because the birth and death of each individual is a random, discrete and probabilistic event eg. can’t have 1.5 children
this is modelled by treating the number of new individuals as a random variable across a normal distribution, rather than as a deterministic quantity (so the same predictions won’t be attained each time)
a poisson distribution is used, because the values are integers and can’t be negative (bounded at 0)
the relative effect of demographic stochasticity is lower in large populations, but it is very influential in small populations, especially those with low r
this type of randomness is endogenous to the population- it's not imposed by the environment
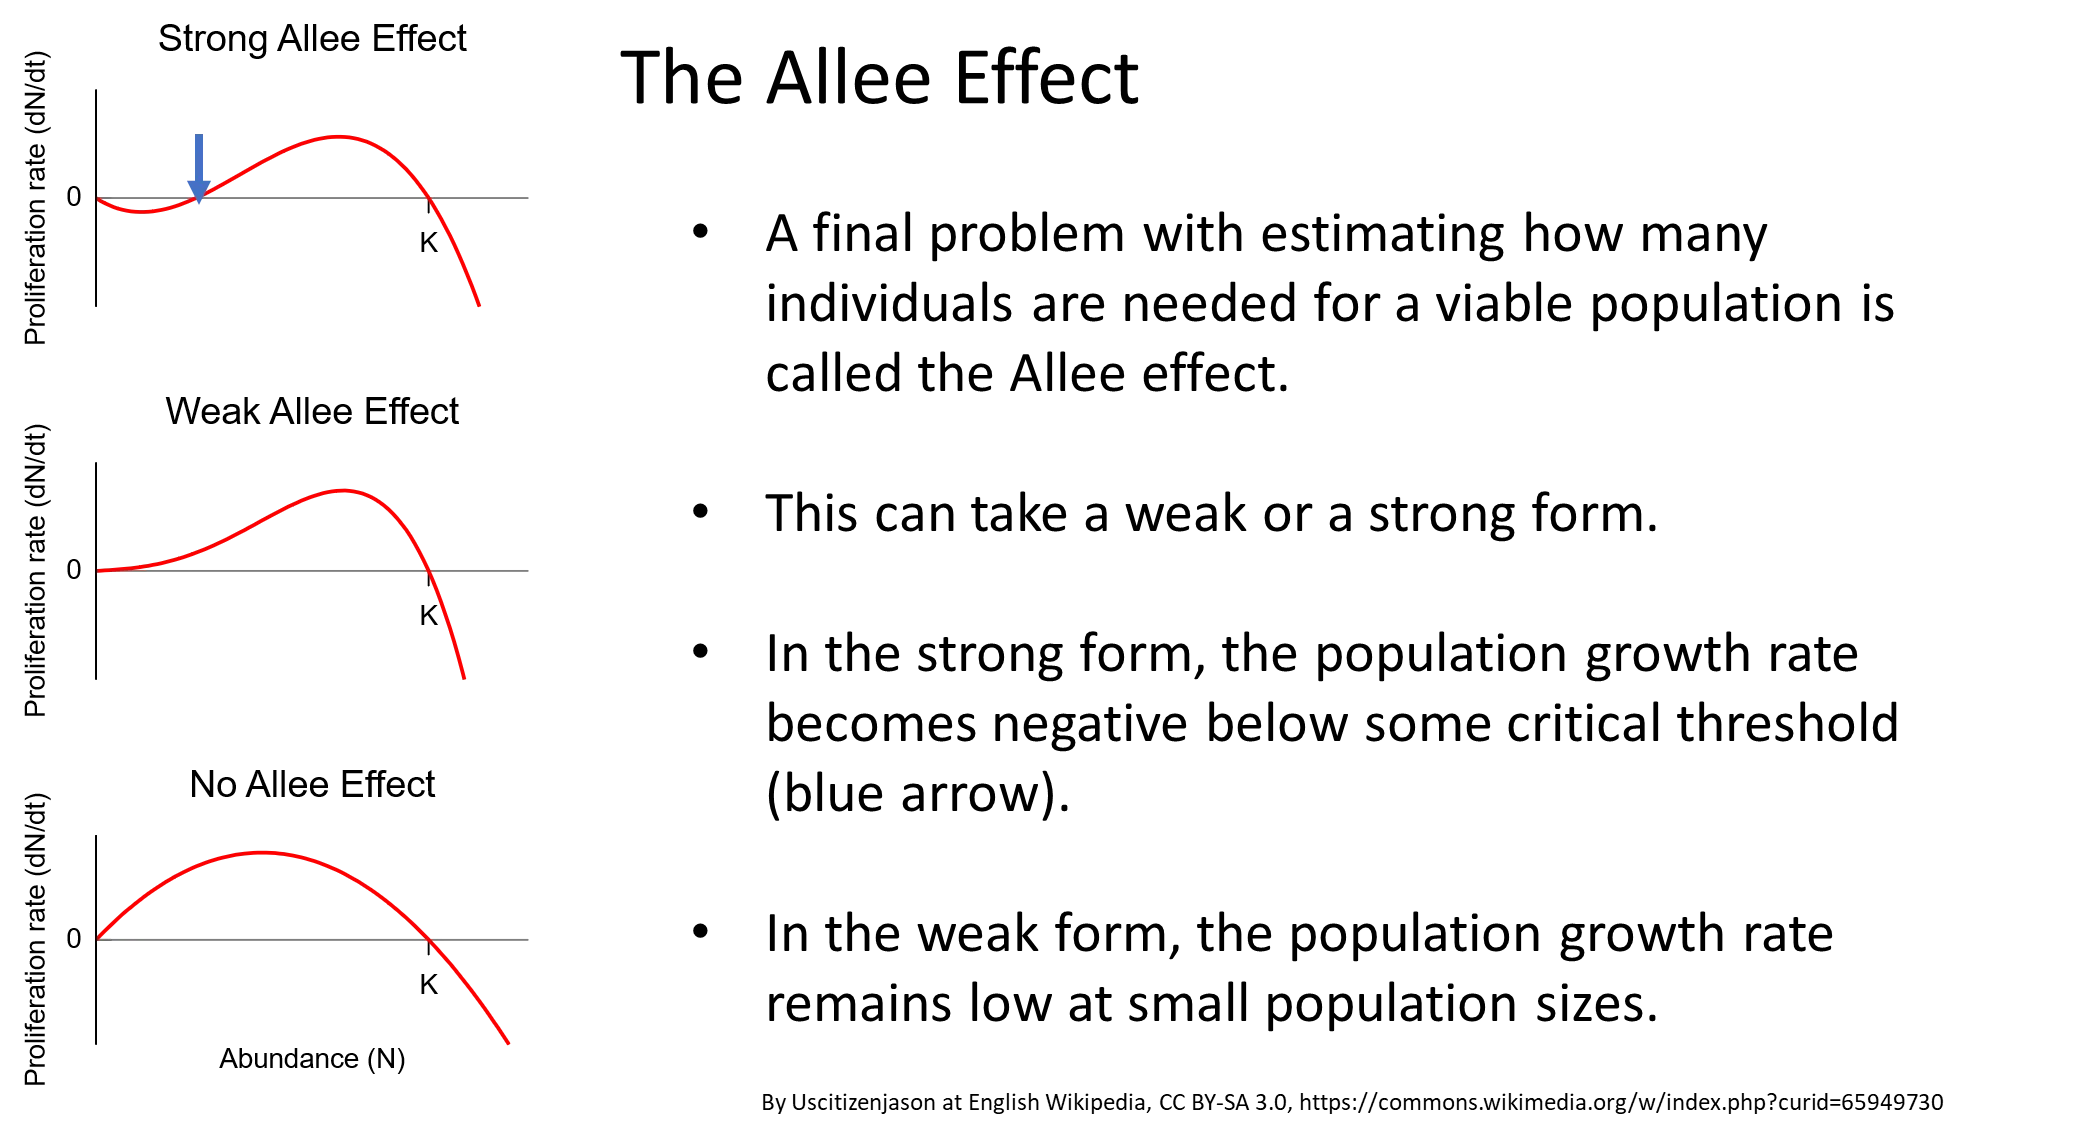
what is the allee effect? give examples
the allee effect states that special, hard to predict problems can occur in small populations, eg:
musk ox- the herd forms a defensive ring around calves to fend off wolves, but when the population becomes too small, they can’t surround the calves properly
african wild dogs- hunting is unsuccessful in small packs because they can’t attack prey that is much larger than they are, like usual
kakapos- females will only be attracted to males when they are in groups
when the allee effect is strong, the proliferation rate decreases, even to the point of causing negative growth rates
describe an example of a k-selected species
the kakapo is a large flightless parrot from new zealand
it is incredibly k-selected because it only breeds every 2-7 years, depending on masting years from its main food source, and adults live for decades
the introduction of mammals and hunting in new zealand devastated the populations
they were thought to have gone extinct, but a small island population was found, and intensive recovery programmes began, yet it is still under threat and vulnerable due to genetic erosion
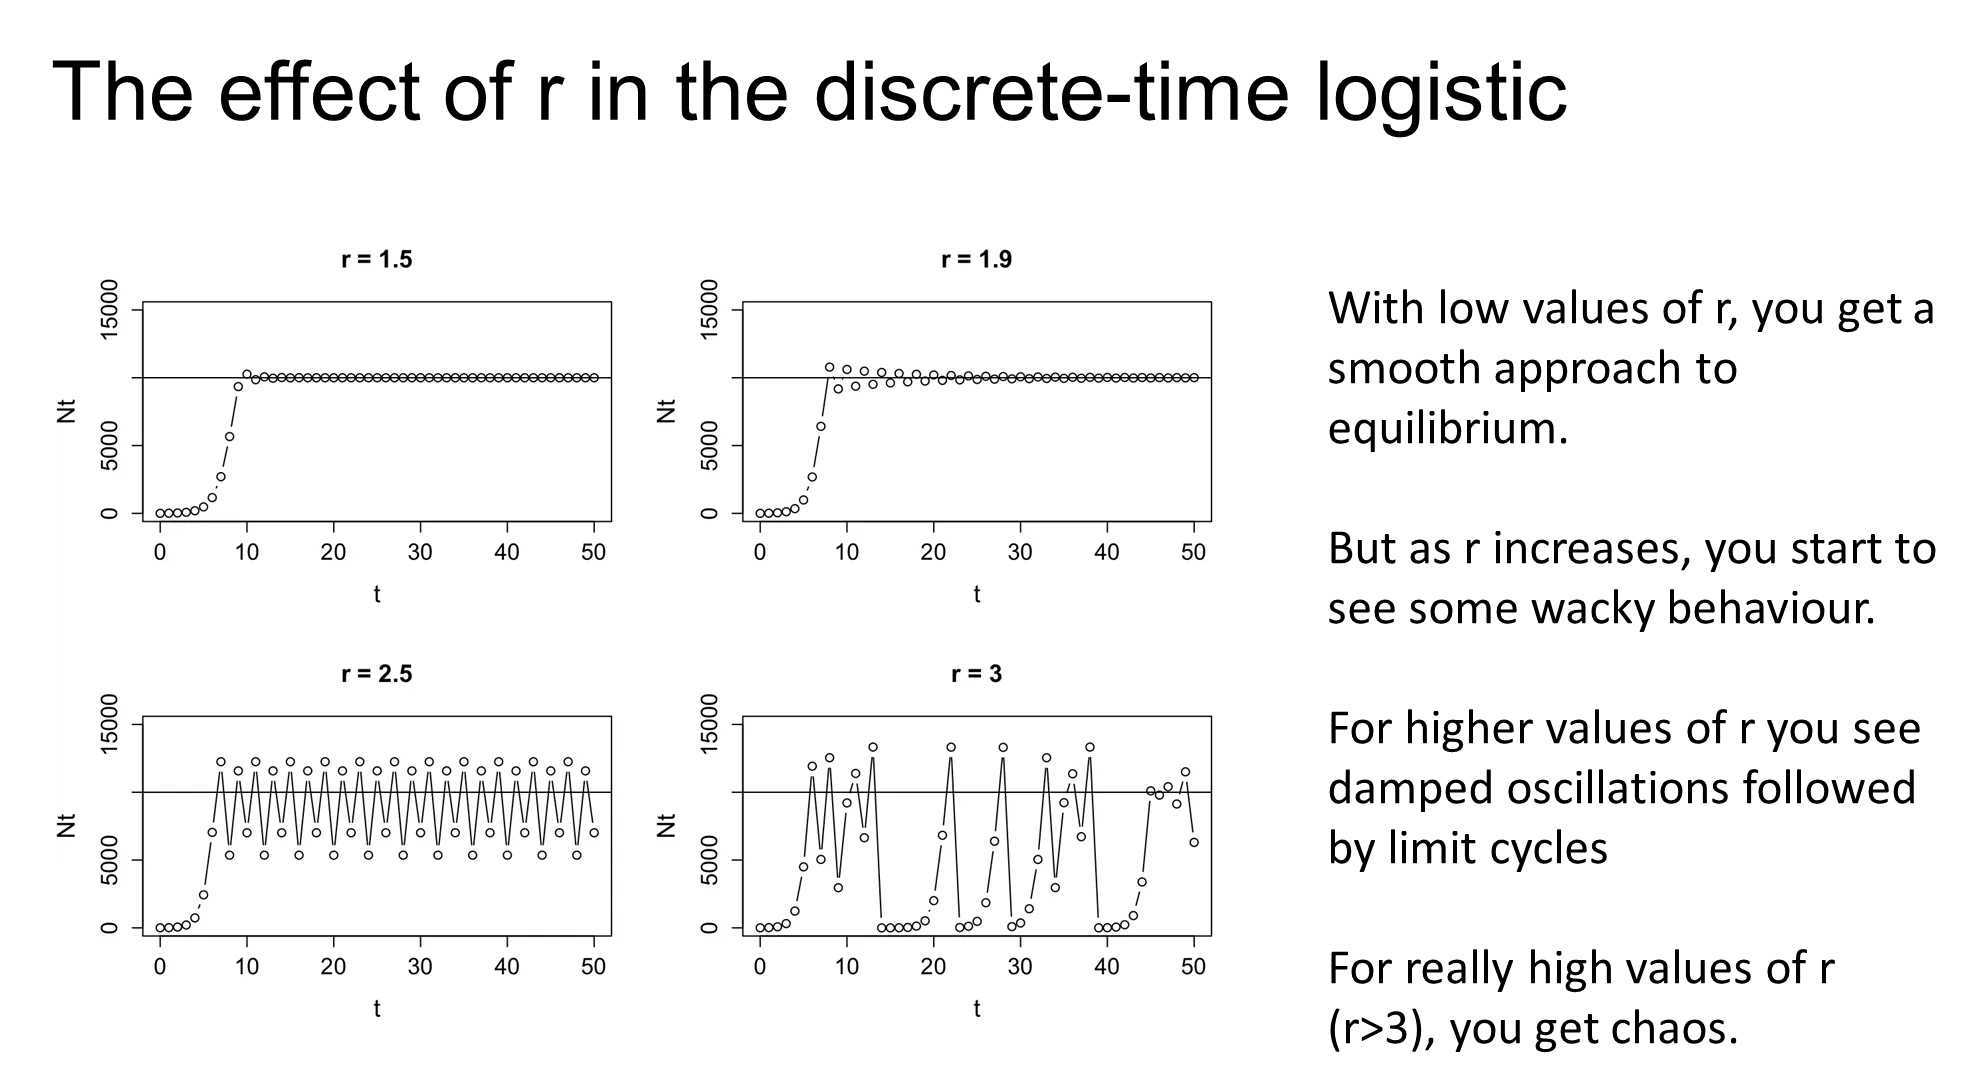
how do high r populations behave in a discrete time logistic model
damped oscillations and limit cycles can happen in high r populations
this is where the population is able to increase above the carrying capacity, which then brings the population right back down
this is overcompensating density-dependence, which can cause catastrophic die offs
in very high r populations, this causes chaos (deterministic not stochastic, but so unpredictable that it appears random)
this may not actually be present in real-life, it is just a phenomenon of the discrete time model
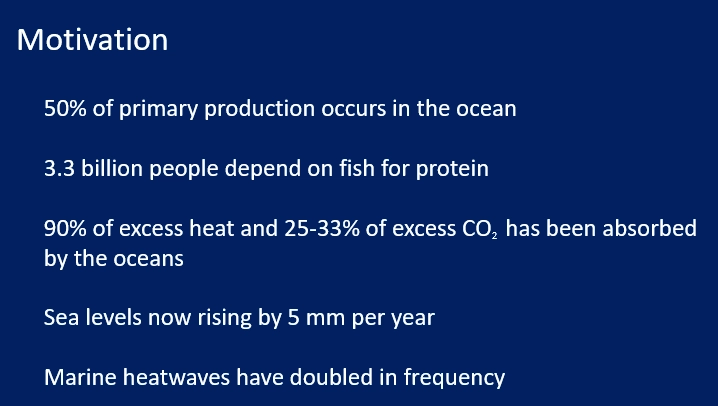
why should we study ocean habitats?
earth’s largest habitat
explain the typical oxygen and temperature profile of the ocean
oxygen is high near the surface but declines quite rapidly because oxygen is already low and diffusion is slow to replace oxygen used by the high levels of respiration
this increases again because there are lower respiratory demands at lower depths
temperature also rapidly declines in a thermocline
this is because there is a shallow surface layer of warm water, which is less dense and floats
there isn’t much vertical mixing between water of different densities, so the gradient is initially steep, then plateaus
this thermocline is stable year-round for tropical oceans, because the sun is always creating the warm shallow surface layer that prevents nutrient mixing
how and why is CO2 affecting the oceans?
anthropogenic CO2 is being absorbed by the oceans, which is causing its acidification (still alkaline, but less so)
this is because CO2 reacts with water to produce carbonic acid, which dissociates to release hydrogen and bicarbonate ions
acidification is an issue for ocean chemistry because many oceanic organisms have calcium carbonate skeletons
this relies on saturated carbonate ions, which get drawn out by reacting with excess hydrogen ions in acidification
how do currents move through the ocean?
surface currents are driven by friction from wind (ie. because hot air rises at the equator and sinks at the tropics)- rapid timescales
the great ocean conveyor belt is driven by the overall movement of water- slower timescales
warm surface water is driven by the gulf stream north towards the arctic, where it freezes, producing hypersaline water
this is more dense and sinks, driving a deep ocean current which flows south and rises again at other points, bringing nutrients to the surface (thermosaline circulation)
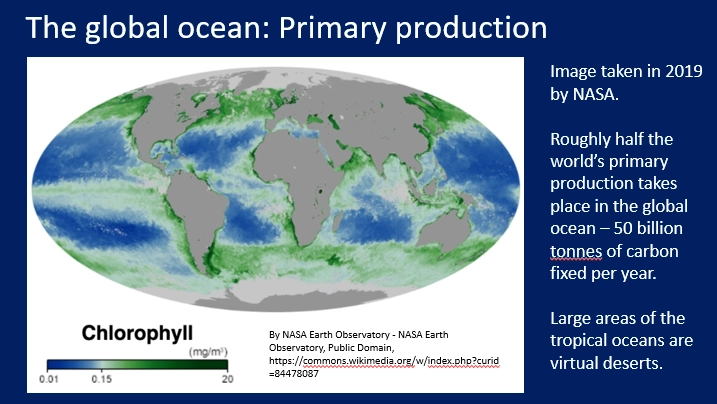
whats the distribution of primary production in the ocean? what carries this out?
primary production is higher at higher latitudes, and lowest in the tropical open oceans- this is surprising considering terrestrial primary production is highest at the tropics
tropical oceans have low, stable productivity year-round because of the sunlight hours producing a constant thermocline that prevents vertical mixing of nutrients (so surface waters are nitrogen-depleted)
temperate and polar oceans have no thermocline in the winter and experience more storms, so the water is nutrient-rich, allowing a spike of high primary productivity in the spring/summer when light isn’t limiting
there are also hotspots of primary production on the west side of continents
this is because of ‘upwellings’ of cold, deep nutrient-rich water (due to wind) up to the continental shelf at coasts that recycle nutrients
this is carried out by bacterioplankton (cyanobacteria) and phytoplankton (diatoms, dinoflagellates and coccolithophores)
kelp, a multicellular brown algae, is also responsible for high productivity at temperate coasts- it is an ecosystem engineer by supporting many other species (but not a carbon sequesterer)
how is primary productivity in coastal oceans controlled?
primary productivity at coasts is dependent on:
bottom-up control- ‘El Nino’ weather events, where the trade winds are periodically weakened, reduce upwellings of nutrient-rich water so that kelp, bacterioplankton and phytoplankton can’t photosynthesise
top-down control- kelp is grazed by sea urchins
the hunting of sea otters, which eat sea urchins, caused the loss of kelp forests by over-grazing
in north california, the combination of an El Nino event blocking upwellings and a disease of the sunflower sun star, which also eats sea urchins, caused the collapse of kelp forests
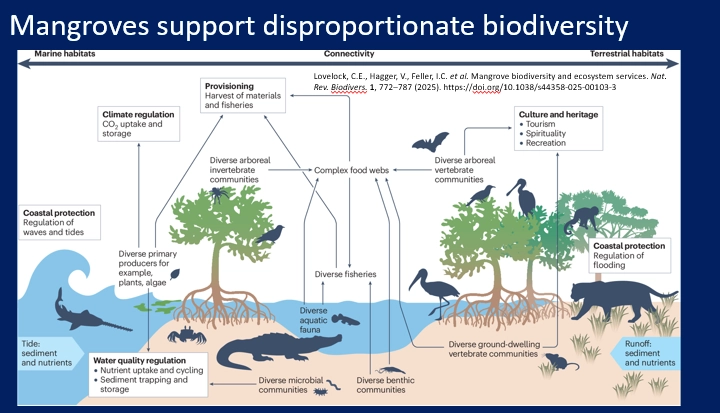
describe mangroves
mangroves are one of the three major tropical coastal ecosystems (with coral reefs + seagrass meadows), a polyphyletic group of salt-tolerant, woody flowering plants in riverine/estuarine habitats
their roots trap sediment to build soil
these roots are supported by lenticels/pneumatophores (aerial roots), which deliver oxygen into the anoxic soil
adaptations of the roots allow them to exclude salt, or some species can excrete salt through the leaves
high primary productivity + standing biomass, supports high biodiversity
long term carbon sinks- 40-70% of their fixed carbon is channelled into the roots, where the high turnover of roots and anoxic environment sequesters organic carbon
nutrients come from the tides, river outflows and local recycling of buried leaf litter by microbes
some bottom-up control, significant top-down control
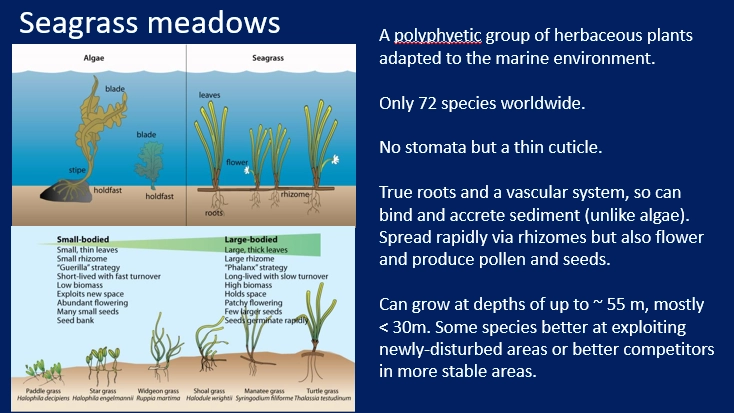
describe seagrass meadows
seagrass meadows are one of the three major tropical coastal ecosystems (with coral reefs + mangroves), a polyphyletic group of angiosperms (not algae) that adapted to marine environments
seagrass is properly rooted in the sediment by lateral roots + rhizomes (store carbon + trap sediment in anoxic soil)
high productivity but low standing biomass
long term carbon sinks- rhizomes sequester large amounts of organic carbon
support many herbivores eg. crabs, green sea turtles + sirenians/manatees
under both top-down and bottom-up control
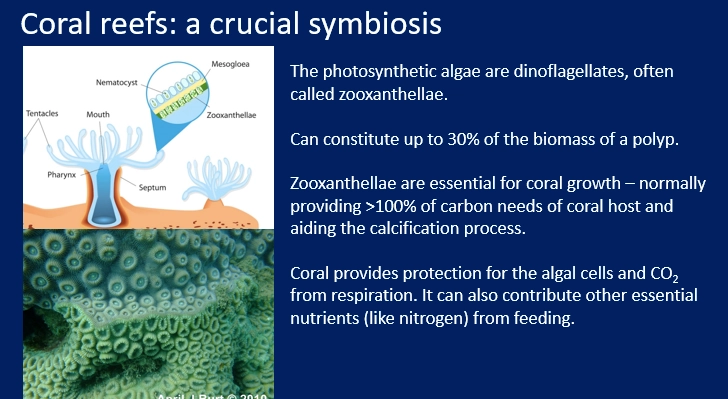
describe coral reefs
coral reefs are one of the three major tropical coastal ecosystems (with coral reefs + seagrass meadows)
require clear waters for high light intensity- consistent + low turbidity, so not near river outflows
reef-building corals are cnidarians, in single polyps or colonies, which secrete calcium carbonate skeletons
the ectoderm has stinging cnidocyte cells and the endoderm has a symbiosis with photosynthetic algae (dinoflagellates)- this symbiosis can break down under high nutrient concentrations because the algae are very good at nutrient uptake
this algae provides organic carbon and aids calcification, while receiving CO2 from coral respiration, protection, and nutrients from feeding
there is also independent filamentous red + green algae that are heavily grazed by herbivores (top-down control) but can dominate under high nutrient concentrations + fishing and cause ecosystem breakdown
high primary productivity, but very low standing biomass and most carbon is respired away, so the net ecosystem production is very low to zero
this means they are not carbon sinks, as calcification also releases CO2
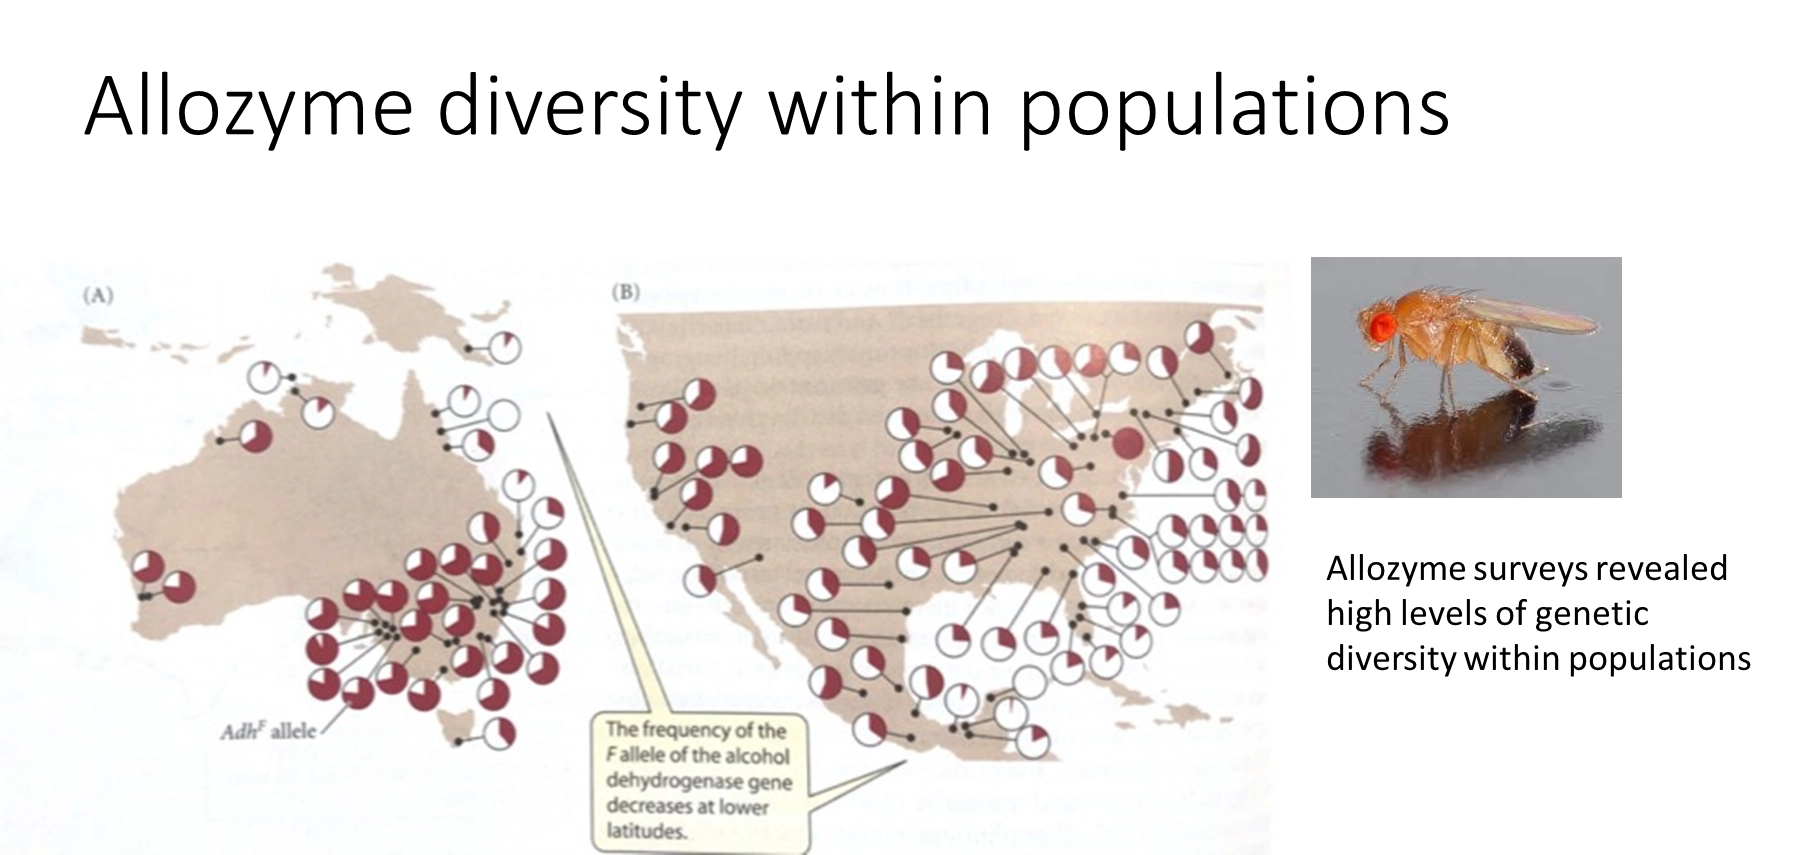
what is allozyme electrophoresis? what is an example, and what did this tell us about selection?
allozyme electrophoresis- protein sample run through electric current in gel
this was used to assay the polymorphism of genes in a population before sequencing was possible
this is because the proteins from two different alleles in a heterozygous individual will separate in electrophoresis
eg. used to study the distribution of the F allele of alcohol dehydrogenase in Drosophila
this showed that there was too much genetic diversity to be explained by selection (which generally decreases diversity)
selection was also challenged by the constant nature of the molecular clock- mutations accumulate at a constant rate, which challenges the idea of frequent selective sweeps due to environmental pressures
this led to the neutral theory of molecular evolution (neutral mutations steadily accumulate by genetic drift, independent of selection)
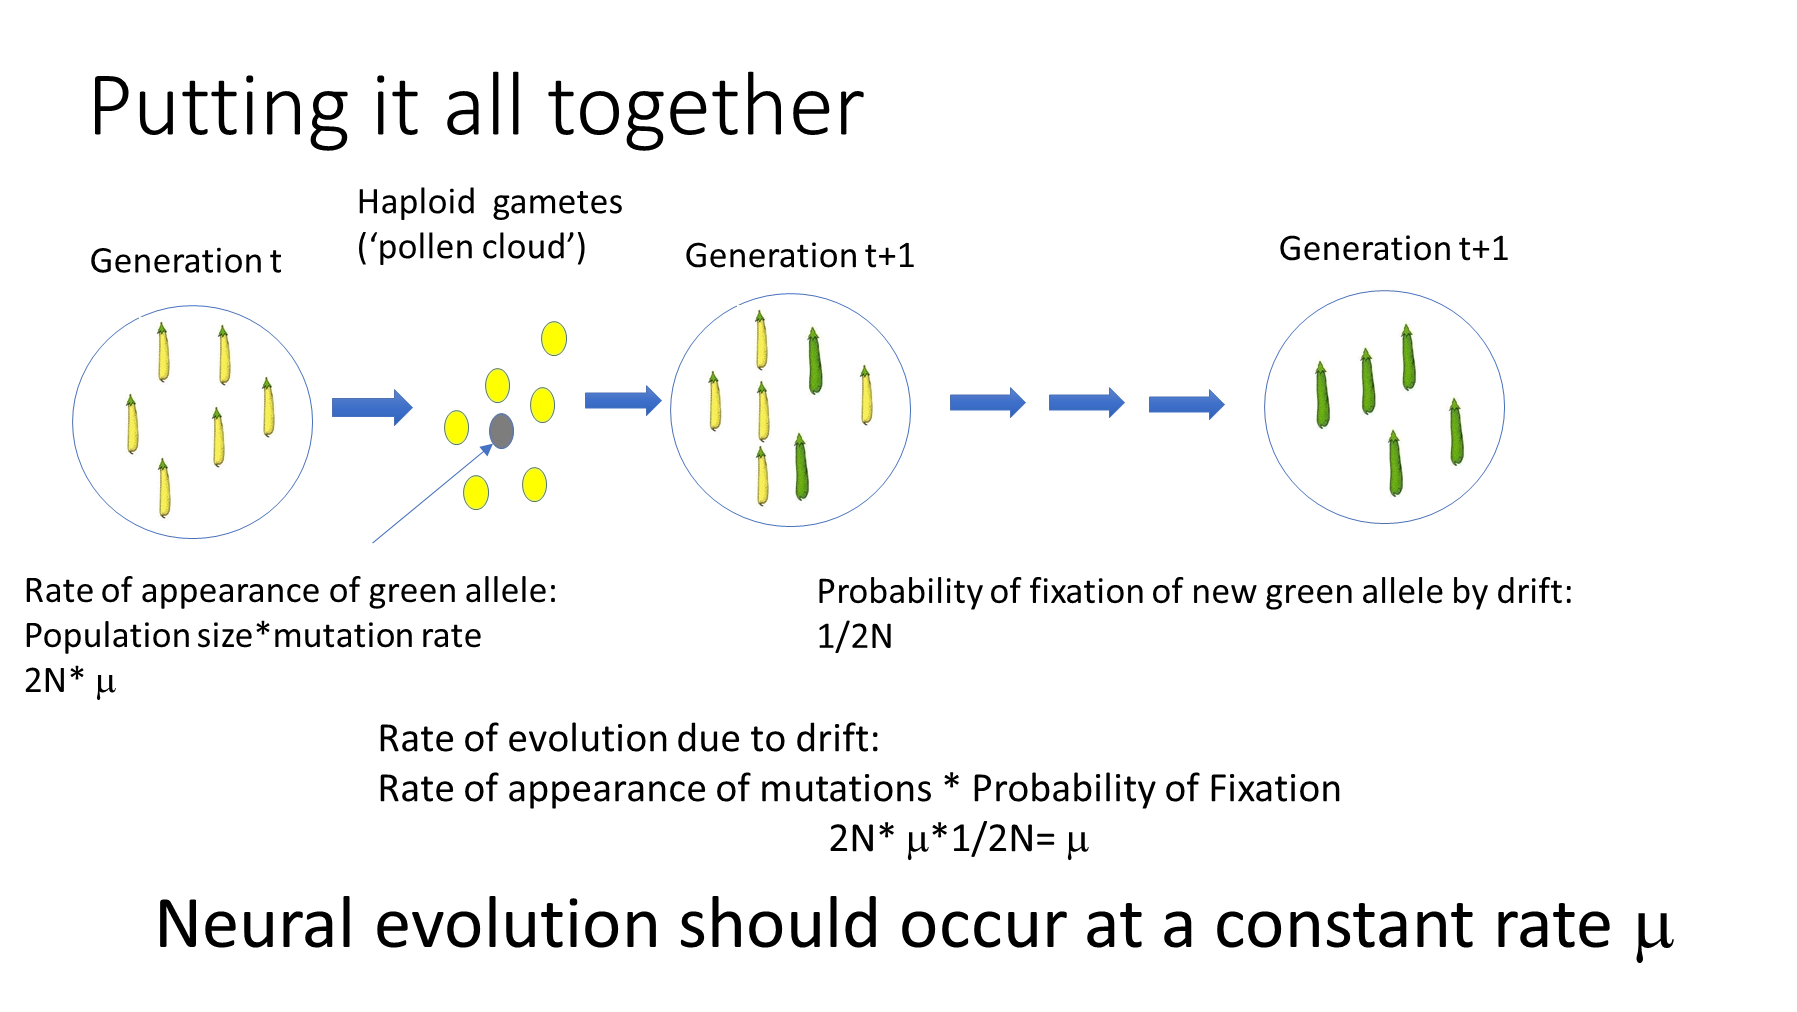
what is the neutral theory of molecular evolution? include the maths and why it was hypothesised
the neutral theory of molecular evolution states that variation within species and divergence between them is mainly the result of genetic drift acting on neutral mutations
selection still exists, but is mainly a purifying force removing deleterious alleles, as beneficial mutations are so rare
the rate of mutations appearing in a diploid population (= mu x 2N) x the probability of fixation of a neutral mutation (= 1/2N) is equal to mu, so the rate of evolution for a particular mutation will be constant at all population sizes
functionally important genes diverge more slowly because a mutation is more likely to be deleterious
this was hypothesised due to divergence and polymorphism challenging selection theory:
allozyme electrophoresis showed that there was too much genetic diversity to be explained by selection (which generally decreases diversity)
the constant nature of the molecular clock (mutations accumulate at a constant rate) challenges the idea of frequent selective sweeps due to environmental pressures
still two interpretations- selectionist/adaptationist vs neutralist
this is because neutral evolution should not result in parallel evolution (the same mutations in genes occurring multiple times, adaptation), unless every other mutation at a particular base is lethal, or certain mutations just have higher underlying rates
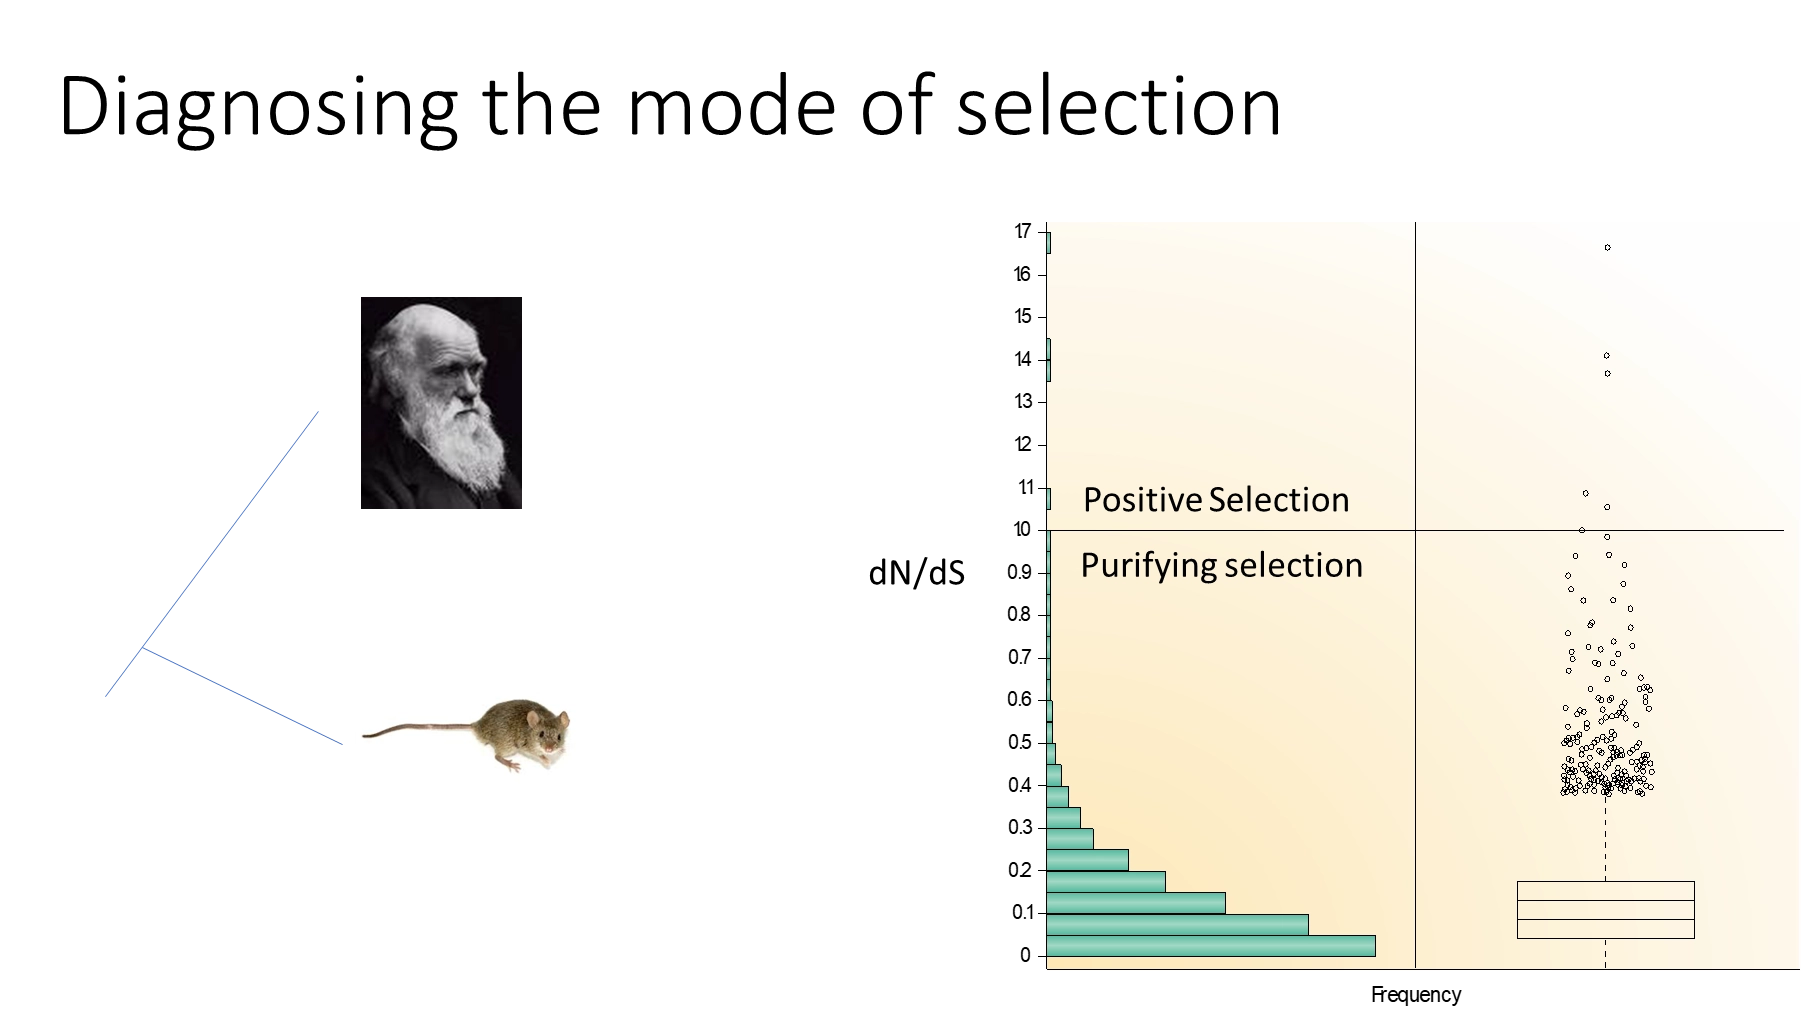
how can evolutionary rates be used to test the mode of selection?
due to the redundant nature of the genetic code, some mutations are synonymous and do not change the proteins, so are likely neutral and not under selection
non-synonymous mutations are more likely to be deleterious/beneficial and so under selection
we can test the mode of selection by comparing the rates of evolution at synonymous (dS) and non-synonymous (dN) sites:
no selection- dN/dS = 1
purifying selection (removing deleterious mutations)- dN/dS < 1
positive selection- dN/dS > 1
this is not foolproof, because when we compare distantly diverged species, positive selection events are masked because over a long time frame, additional neutral evolution events will push dN/dS lower
with distantly diverged species the overwhelming majority of data points are less than one, but this proportion decreases when comparing more recent diversions
how does innovation of new genes occur?
proteins are conformationally flexible and dynamic- some enzymes are functionally promiscuous and can catalyse multiple reactions
innovation often occurs by mutations that change which conformation is dominant
eg. flagella structural genes in Pseudomonas are activated by FleQ
after deletion of FleQ they have no flagella, but within a week, mutations in NtrC (a transcription factor for nitrogen assimilation genes) cause NtrC function to change to regulate flagellar genes
this is possible because NtrC had some initial promiscuity in its conformation
this requires the duplication of genes:
neofunctionalisation- one copy can be inactivated and accumulate mutations to change its function without losing the function of the initial gene
sub-functionalisation- the duplication of a multi-functional gene means that each copy can mutate to carry out just one function
new genes are also acquired by horizontal gene transfer and hybridisation/introgression following outcrossing
what are major evolutionary transitions? give examples
the continuum view of evolution isn’t always helpful- changing social behaviours often involves large revolutions
a major evolutionary transition involves a change in the way information is transmitted
this is commonly to do with transitions in individuality, where independent entities fuse into one large individual
non-inviduality:
RNA → DNA
asexual → sexual (E)
language and writing
individuality:
DNA → chromosomes (E)
endosymbiosis events eg. mutualism with bacteria/archaea → chloroplasts + mitochondria in eukaryotes (E)
unicellularity → obligate multicellularity eg. solitary algae to volvox with specialised cells for different purposes (F)
eusociality/colonies eg. solitary to social termite colonies where some individuals are sterile (F)
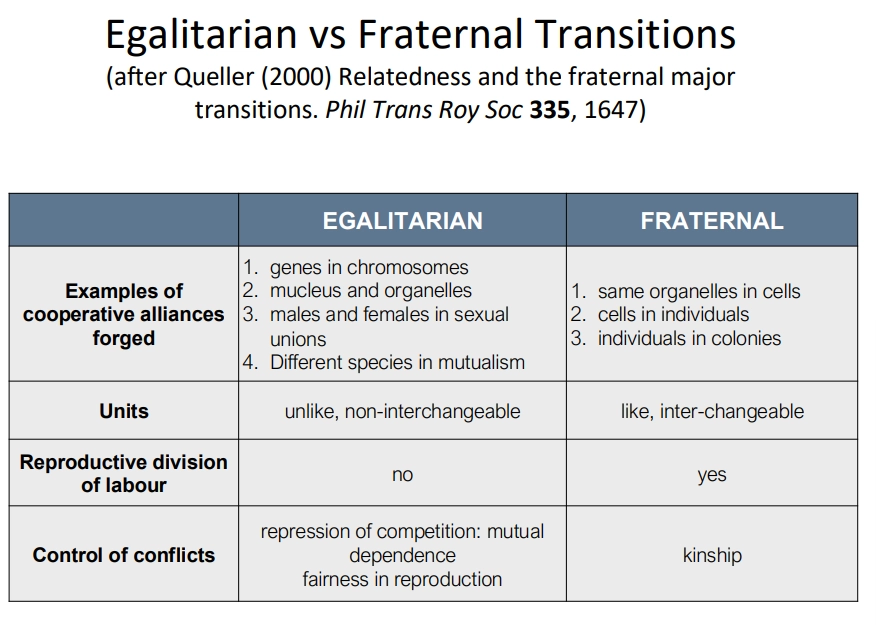
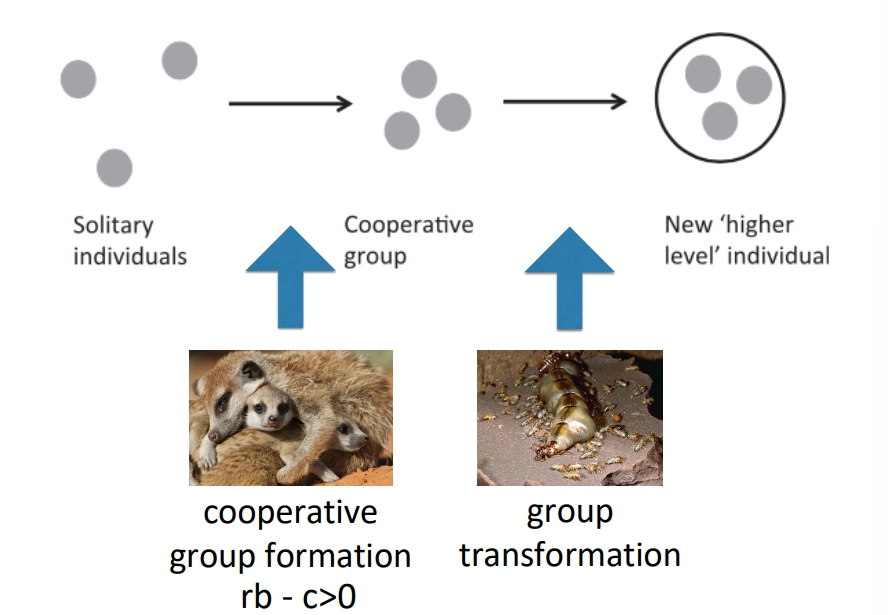
what are the three stages of evolutionary transitions in multicellularity? how can selection be eliminated within groups to allow this?
starting with solitary individuals
a cooperative group of individuals may be formed, dependent on whether it is favoured by hamilton’s rule
the second step is more difficult to achieve- the group transforms into a higher-level superindividual, such that some become unable to reproduce
this requires the elimination of selection between individuals in the group, so that all can become highly inter-dependent
this elimination of selection can be achieved by:
aligning genetic interests- increasing relatedness, particularly by cloning, means the reproductive values of individuals are the same
repression of competition- when individuals can no longer reproduce independently, they have a shared fate and neither can perform better than the other, even with genetic differences
eusociality can only evolve from a strictly monogamous ancestor
what are the two mechanisms of group formation in social insects/multicellular organisms?
subsocial (offspring)
queen lays eggs and her daughters stay with her
obligate multicellularity can only evolve from the cloning and clustering of a parent cell (so can facultative multicellularity)
semisocial (siblings)
sisters come together after being separated
facultative multicellularity is also able to evolve from the aggregation of non-clonal individuals
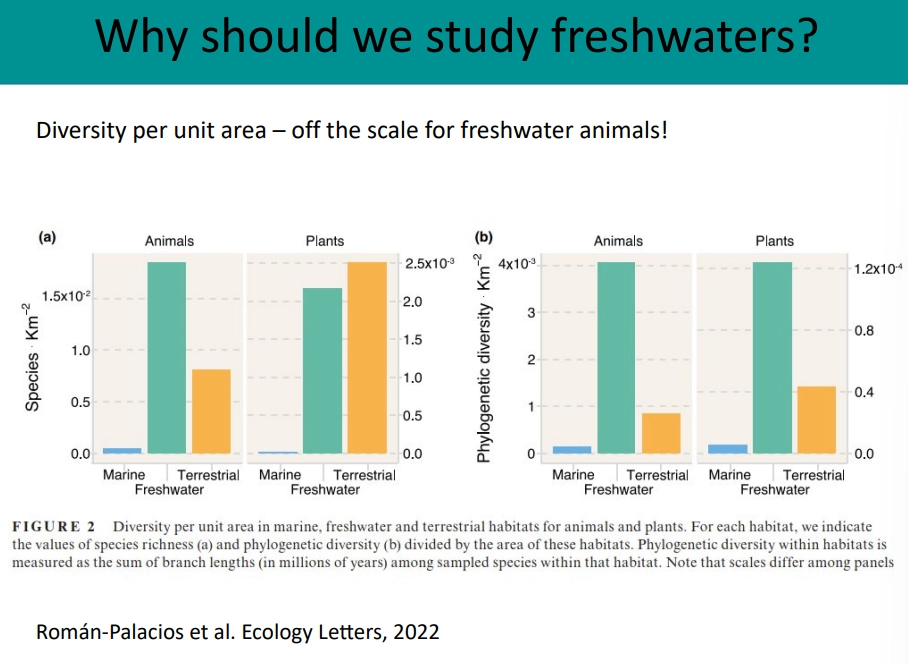
why should we study freshwater habitats?
rare- 0.8% of earth’s water volume, 2% of surface area
physically diverse and interesting
hotspots for diversity- much higher diversity per unit area than marine habitats
most threatened ecosystem on the planet
we need them for ecosystem services- drinking water, fishing, flood mitigation
how have organisms adapted to live in extreme/unusual freshwater habitats?
thermophiles in hot springs eg. hydrogenobaculum, brine flies
freshwater pools in caves eg. mexican tetra
darkness- reduced or no eyes
low food- no scales and low metabolism
low oxygen- increased red blood cells
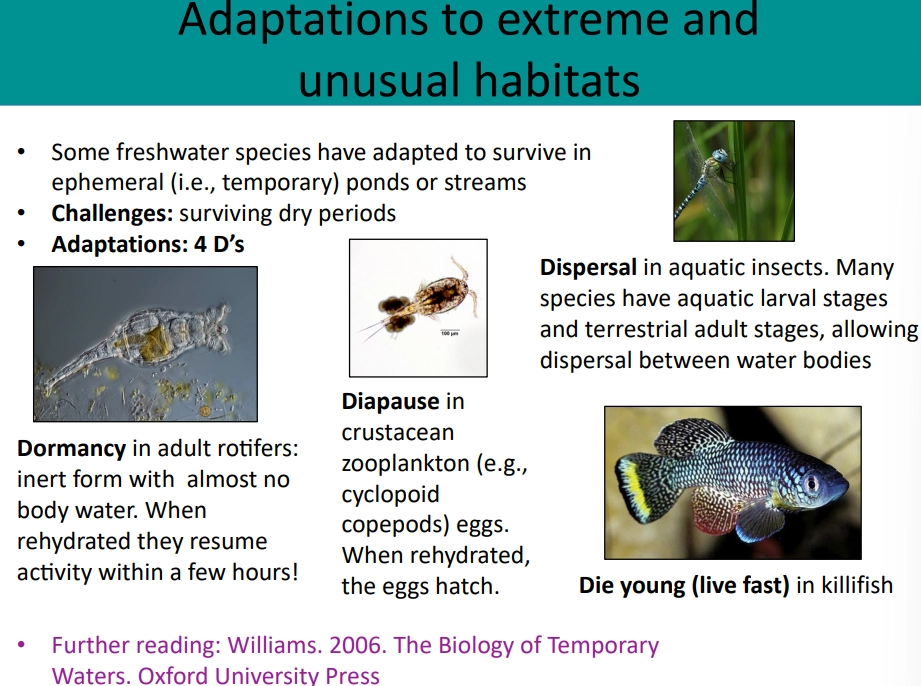
temporary/ephemeral ponds and streams
dessication-
dormancy (eg. rotifers)
diapause (eg. copepods)
dispersal with terrestrial adult stages (eg. dragonflies)
dying young and reproducing early (eg. killifish)
waterfalls eg. migratory fish
travelling upstream- sucker mouths eg. rock climbing goby
what threats are posed to freshwater habitats and why?
chemicals, mainly biocides
chemicals accumulate because they are the lowest point in landscapes
trophic cascades and biomagnification of toxins through tissues
organic pollution
from fertilisers and sewage, particularly after flooding events
eutrophication- increased nutrient levels cause algal blooms, creating hypoxic environments for the other organisms
habitat loss
dams- fragmentation of river habitat blocks sediment/nutrient transfer and migratory fish
exploitation
water use causing water scarcity/drought events
inland fisheries
invasions by non-native species
in the rivers/lakes themselves eg. invasive crayfish in uk rivers, and on the banks eg. rhododendron produces unpalatable leaf litter
climate change
some organisms have narrow thermal niches and temperature may affect behvaious
the fragmented nature of freshwater habitats reduces their ability to move
increased drought/flooding frequency changes nutrient and habitat dynamics
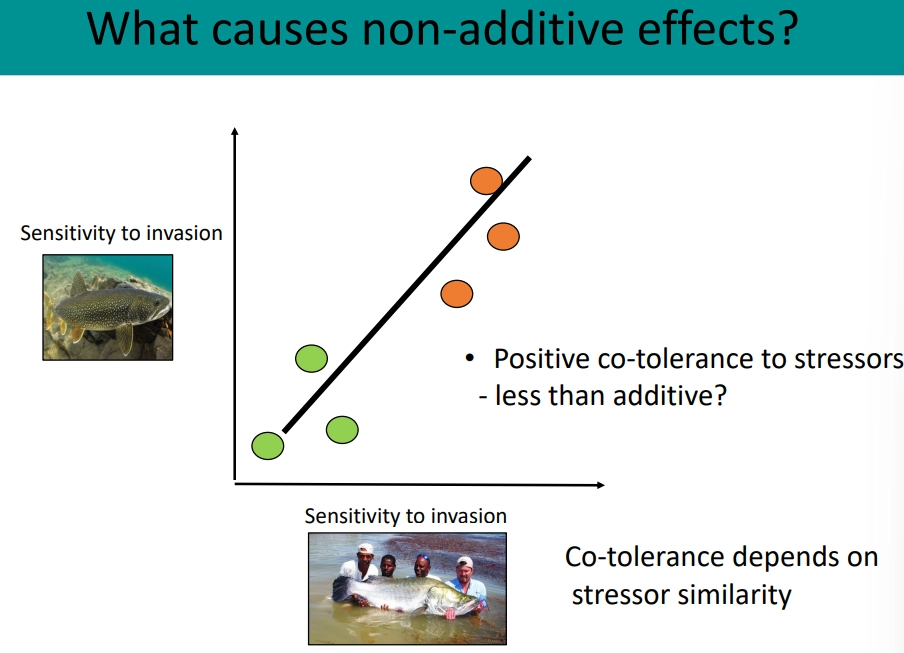
what causes non-additive effects of environmental stressors? include examples
different stressors can amplify (synergistic interaction) or mitigate (antagonistic interaction) each other’s impacts, rather than just adding together
lake victoria has many stressors, which interact through different methods, eg:
chemical/physical alterations- nutrient pollution promotes the spread of the invasive floating water hyacinth, warming increases/decreases the potency of pollutants
stressors can change species sensitivity- lower fitness of native fish due to pollution increases the likeliness of being caught
positive cotolerance- similar stressors affecting one species can have antagonistic effects because the species is at high risk either way
food-web interactions- perch invasion caused extinctions, so further stressors are impacting an already restructured food web
what is coevolution?
coevolution/collateral damage is when the administration of antibiotic A selects for antibiotic resistance against A, B, C and D, even if they aren’t chemically related
this is because antibiotic resistance genes move in clusters, so antibiotics select for co-resistance
even when common ‘access’ antibiotics (lower resistance potential) are being used, they are causing resistance against the broader spectrum ‘watch’ and last resort ‘reserve’ antibiotics
this can even happen when antibiotics aren’t being used
pollutants (eg. microplastics, hydrogen sulphide in polluted rivers, disinfectants) are viewed as toxins and cause bacteria to switch on stress systems that encourage DNA exchange
describe the 3 examples of the problems of antibiotic resistance
the ARGs are passive passengers of the plasmid, so they spread very quickly even when not selected for
eg. carbapenem resistance (by NDM-1 gene) on the IncX3 plasmid
AMR genes remain present in populations for long periods, and as soon as antibiotics are used, they will increase rapidly due to selection- even when used to treat livestock (same bacteria won’t necessarily infect humans, but can exchane plasmids)
eg. colistin resistance (by MCR gene)
AMR genes have spread and clustered together and are continuing to
eg. tigecycline resistance has joined up with 23 other resistance genes on one plasmid
what are toxin-antitoxin systems and why are they relevent in antibiotic resistance?
certain plasmids have small genetic modules that code for both a stable toxin protein and a corresponding unstable antitoxin
these are normally produced in the cell, where the antitoxin is able to neutralise the toxin as long as the gene is continually expressed
however if the plasmid is lost from the cell, the antitoxin will degrade much faster than the toxin, causing cell death
this means that any cell which loses the plasmid will die
this is a method of ensuring the bacteria can’t get rid of the plasmid
if antibiotic resistance genes are inserted into this plasmid, it means the cell can never lose them
what are life history traits? give the main examples
life history traits are characteristics that relate to the timing/variations of each of the life stages, eg:
size at birth
growth pattern (determinate vs indeterminate size)
age of sexual maturity
number and size of offspring
sex of offspring
lifespan
these are normally subject to trade-offs
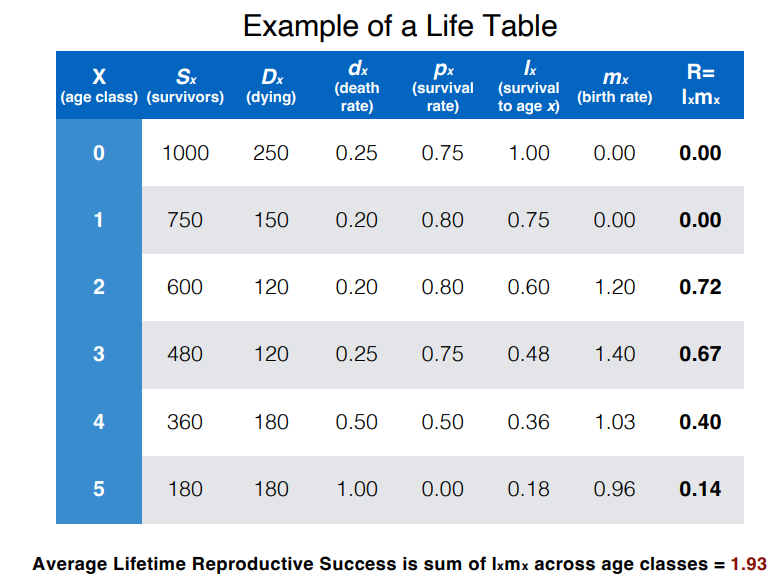
how can we calculate reproductive success at each age class and average success over a lifetime?
reproductive success of an age class = survival rate to this age x the birth rate at this age
the average lifetime reproductive success = the sum of the reproductive successes of each age class (average number of offpsring produced across lifetime)
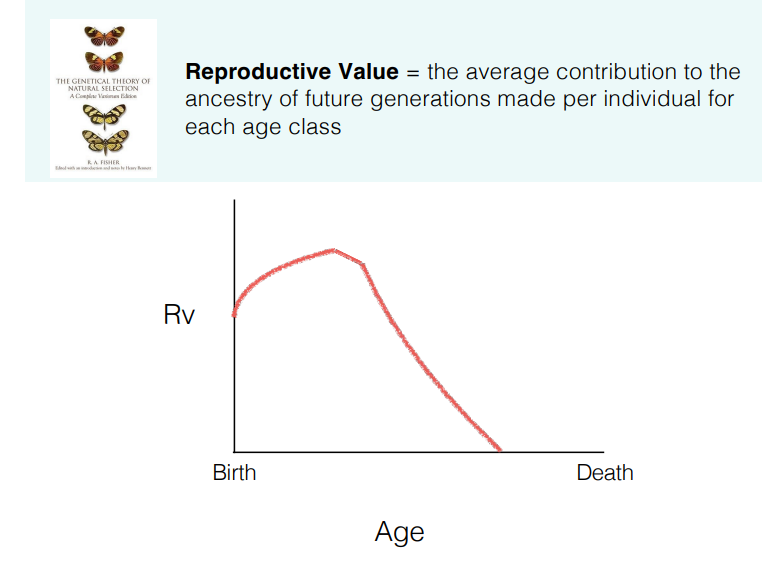
what is reproductive value?
the reproductive value is the expected contribution of an individual of a certain age to future generations, taking into account their chances of survival
eg. would be highest in newborns but they have lower survival rates → increases with age up to sexual maturity → decreases with age as reproduction frequency decreases and death rate increases
reproductive value can be compared against the different life history traits eg. across lifespan, between sexes (should be equal), at different offspring numbers
the reproductive value determines how natural selection acts, eg:
parents value older offspring more because they have higher reproductive value than newborns
species with lower reproductive value of offspring will tend to be less attentive parents
the strength of selection to remove deleterious mutations is at its highest at the age of greatest reproductive value, then decreases (cancers not selected against because they appear in later life, post-reproduction)
evolution might have favoured post-reproductive (menopausal) lifespan in order for grandparents to look after grandchildren and increase their reproductive value
f
what is the small world property of ecological networks? what are the implications of this?
the nodes of a network are typically very closely connected (by edges/links)
on average every species is two links apart, and 95% are within three links of each other
this is important because:
changes in the abundance of one species will propagate rapidly through the network
biodiversity loss, over-harvesting and species invasions may affect more species than previously thought
how can we quantify the connectedness of networks?
the connectance, C, of a network is equal to the number of links that occur, L, divided by the number of possible links, S
C = L/(S(S-1)/2)
S(S-1)/2 on the bottom, not S², because we aren’t considering interactions within species (same as S!, S factorial)
what is an issue with relying on observation for ecological network analysis?
studying patterns observed in previously published networks is somewhat problematic, because:
taxonomic bias (too little priority given to smaller organisms eg. bacteria/insects)
lumping (many individuals of one species being considered as one eg. plankton)
omnivory (feeding on more than one trophic unit)
this is why newer analyses use purpose built webs that don’t have these biases
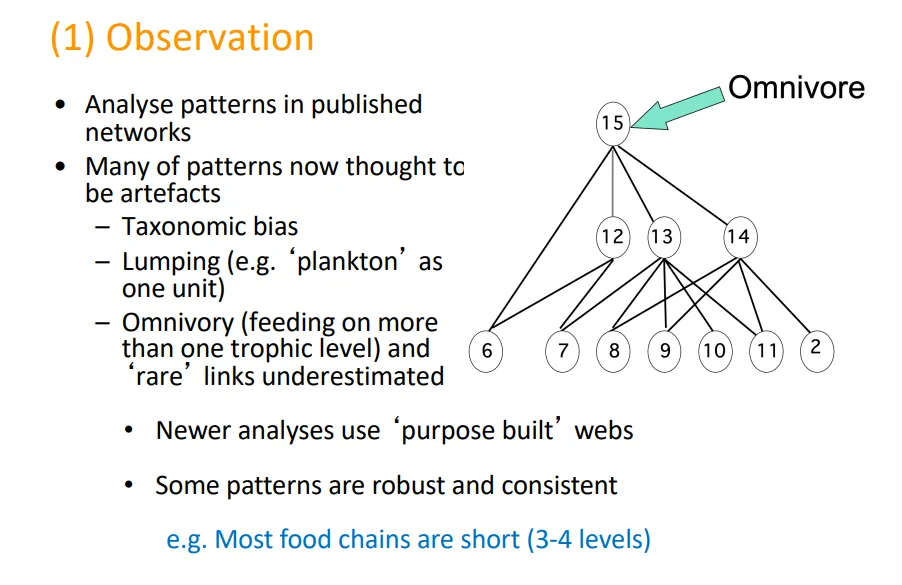
why are food chains short?
productivity:
energy is lost/wasted (eg. by respiration, incomplete digestion) at every trophic level, so there isn’t enough energy near the top for further levels to exist
communities which are more efficient should have longer food chains eg. ectotherm chains longer than endotherms
communities with more efficient primary production should have longer food chains
trophodynamics (instability of long chains):
lower trophic levels are dependent on the stochasticity of food availability, so the populations are variable
chance variations in population size are amplified up the food chain, so they become even more unpredictable for the top levels
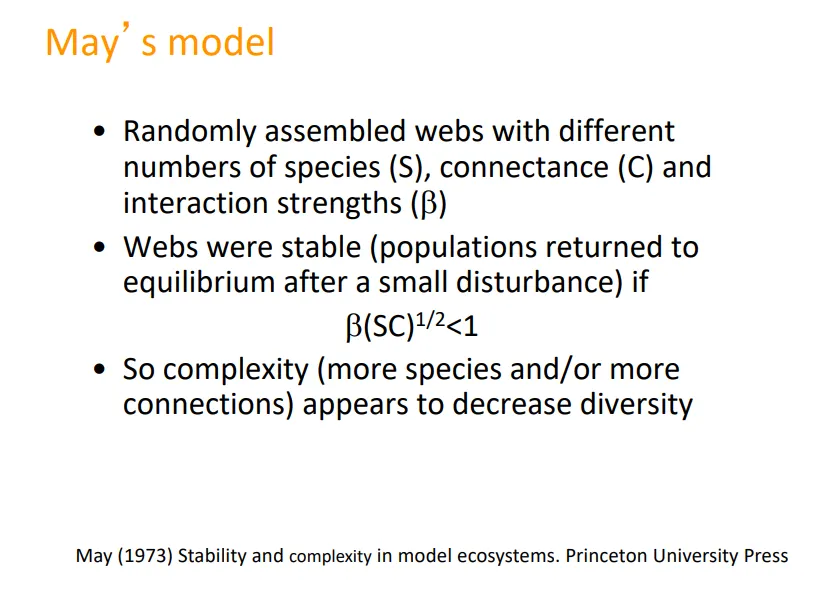
how does network complexity impact stability?
according to may’s model, randomly-generated webs were stable as long as B(SC)1/2 < 1, where:
B (beta) is the strength of interactions
S is the number of species
C is the connectedness
this predicts that increased network complexity reduces stability- this is because:
many components have to be balanced very precisely
there is more potential for trophic cascades
this goes against previous predictions (eg. elton) that increasing complexity would increase stability because there is more buffering against fluctuations
what factors are integral in defining the structure of ecological networks?
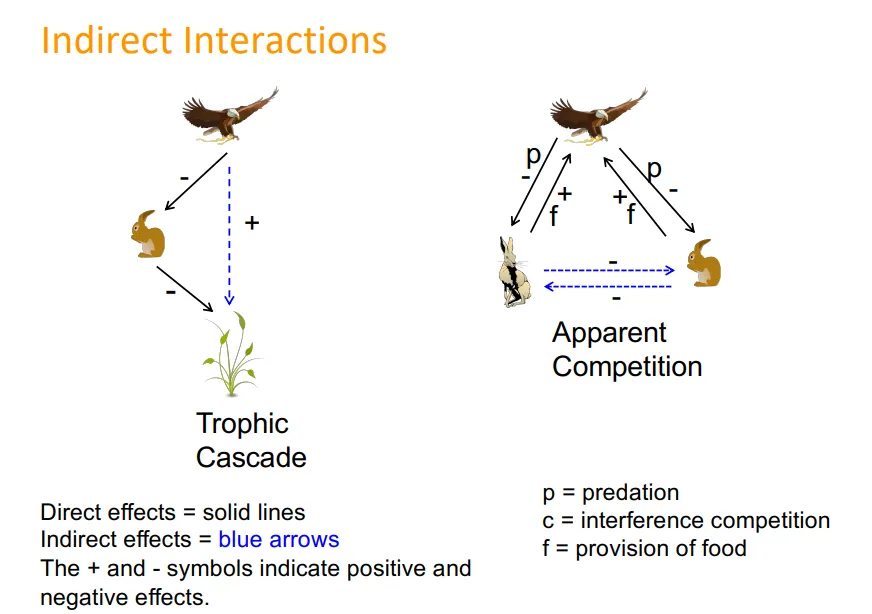
indirect interactions, eg:
between two species on one trophic level which have apparent competition for not being preyed upon, etc- eg. red vs grey squirrels with the squirrel pox virus
tropic cascades
keystone species:
species with much larger impacts on the ecosystem than might be expected from its abundance
if these were to go extinct, the effects will be widespread, often but not always predators

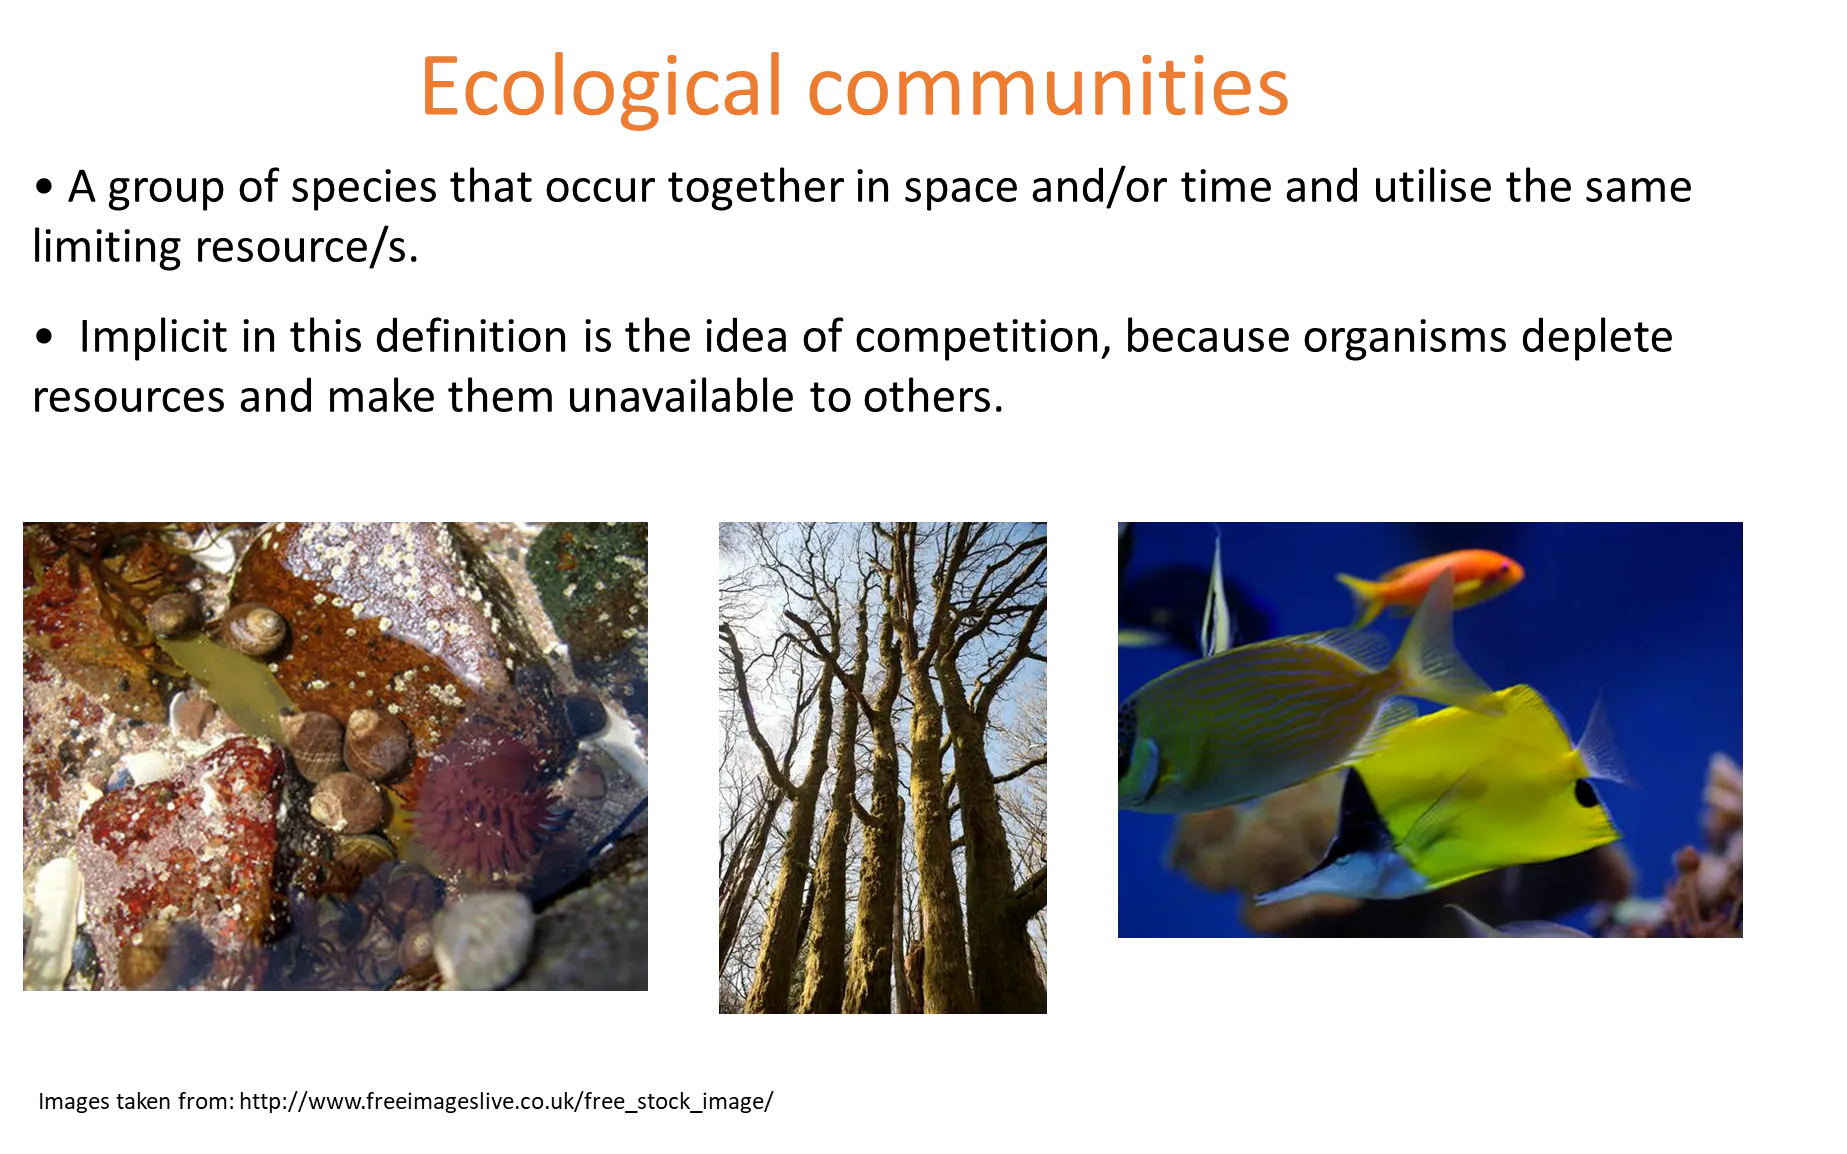
what is an ecological community?
a group of species that occur together in space and time and utilise the same limiting resource/s
implicit in this definition is the idea of competition, because organisms deplete resources and make them unavailable to others
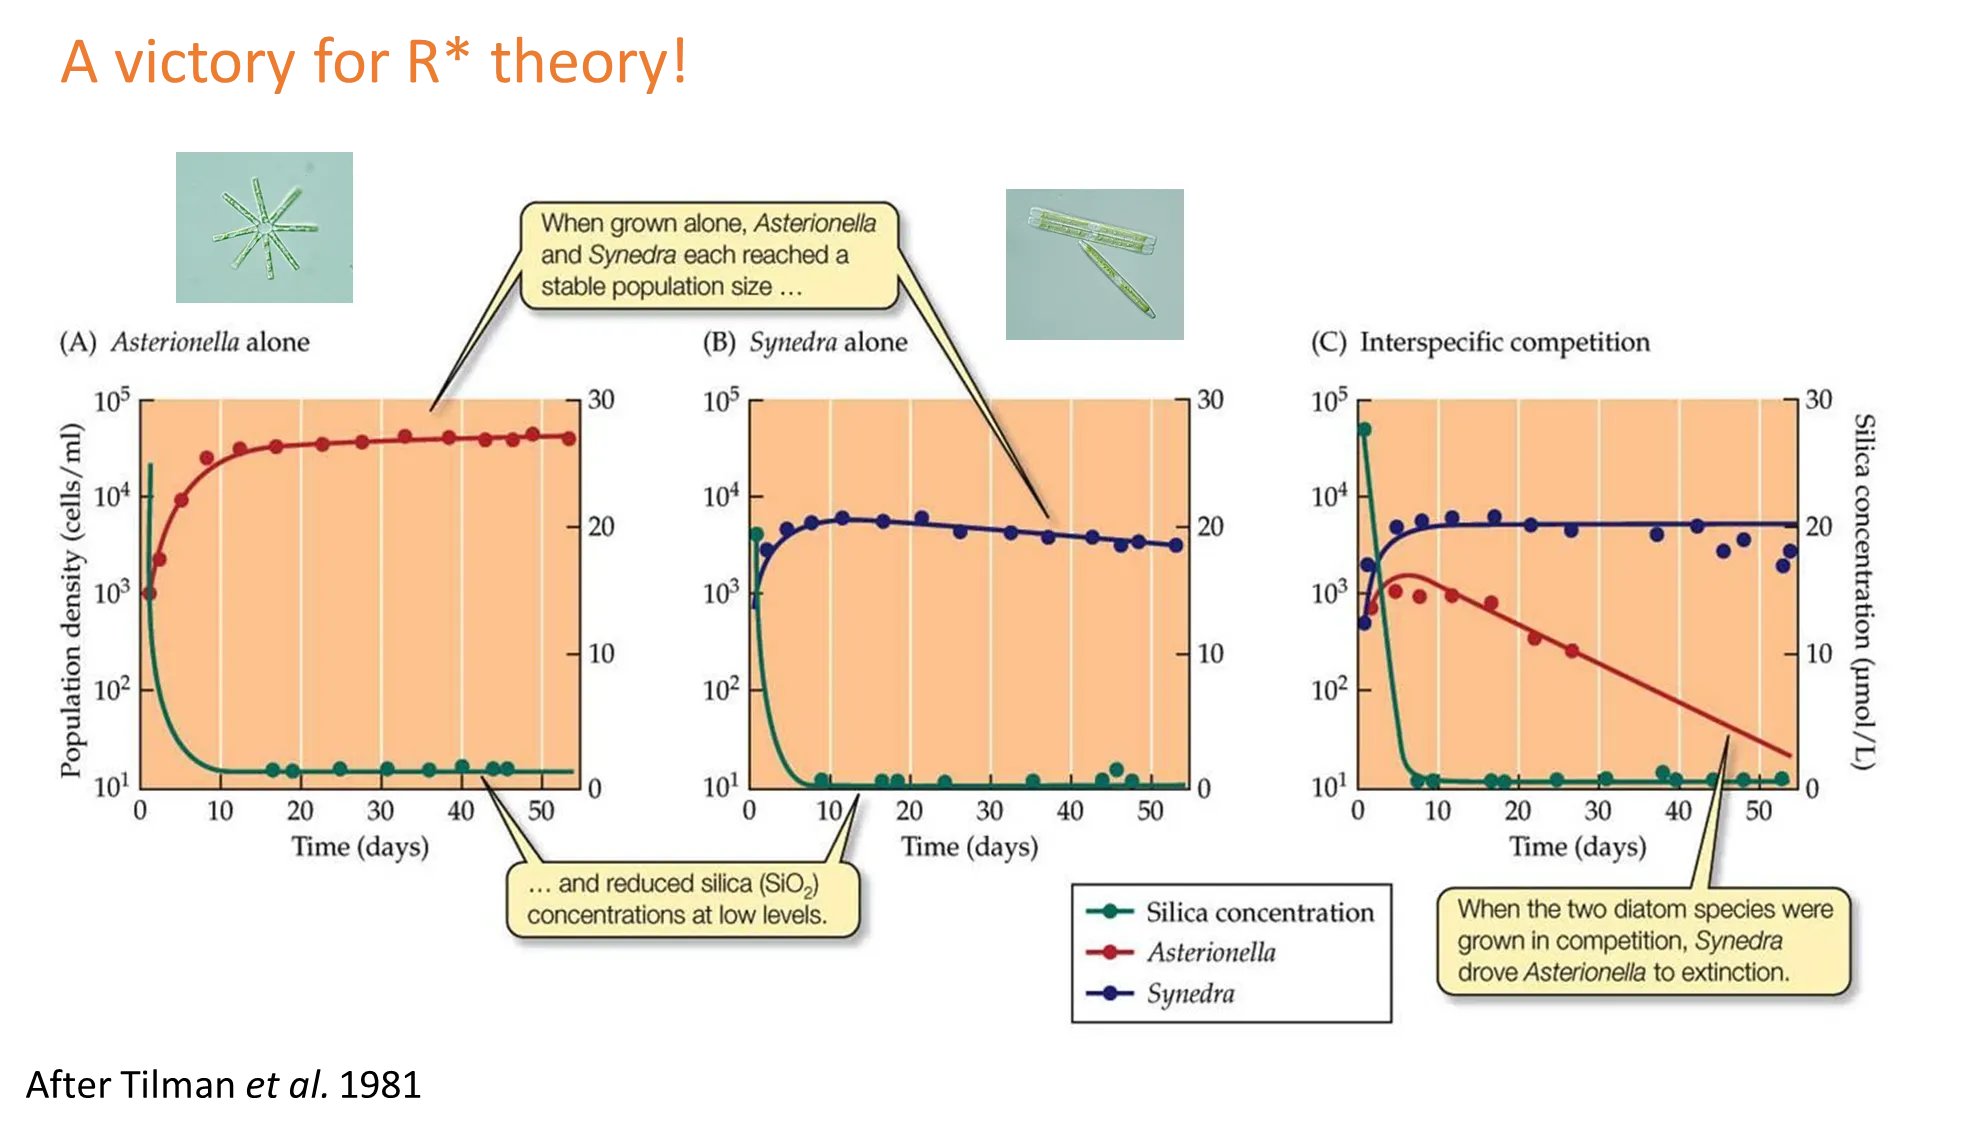
how can we learn from tilman’s diatoms?
diatoms are photosynthetic planktonic organisms that have a unique silica cell wall
two species can be grown in cultures where silica is the limiting growth factor, and their growth observed
when the concentration of silica is high, both populations increase rapidly
their growth depletes the silica, so the growth rates slow
the concentration of silica at the equilibrium is called R* (the minimum resource concentration for positive population growth)
because of this we can predict that the species with the lowest R* for the limiting resource is going to be the superior competitor, because it can survive on less of the resource (Synedra, the blue line)
the alternative theory was that it was based on biomass, but experiments using grasses in minnesota proved that R* holds true
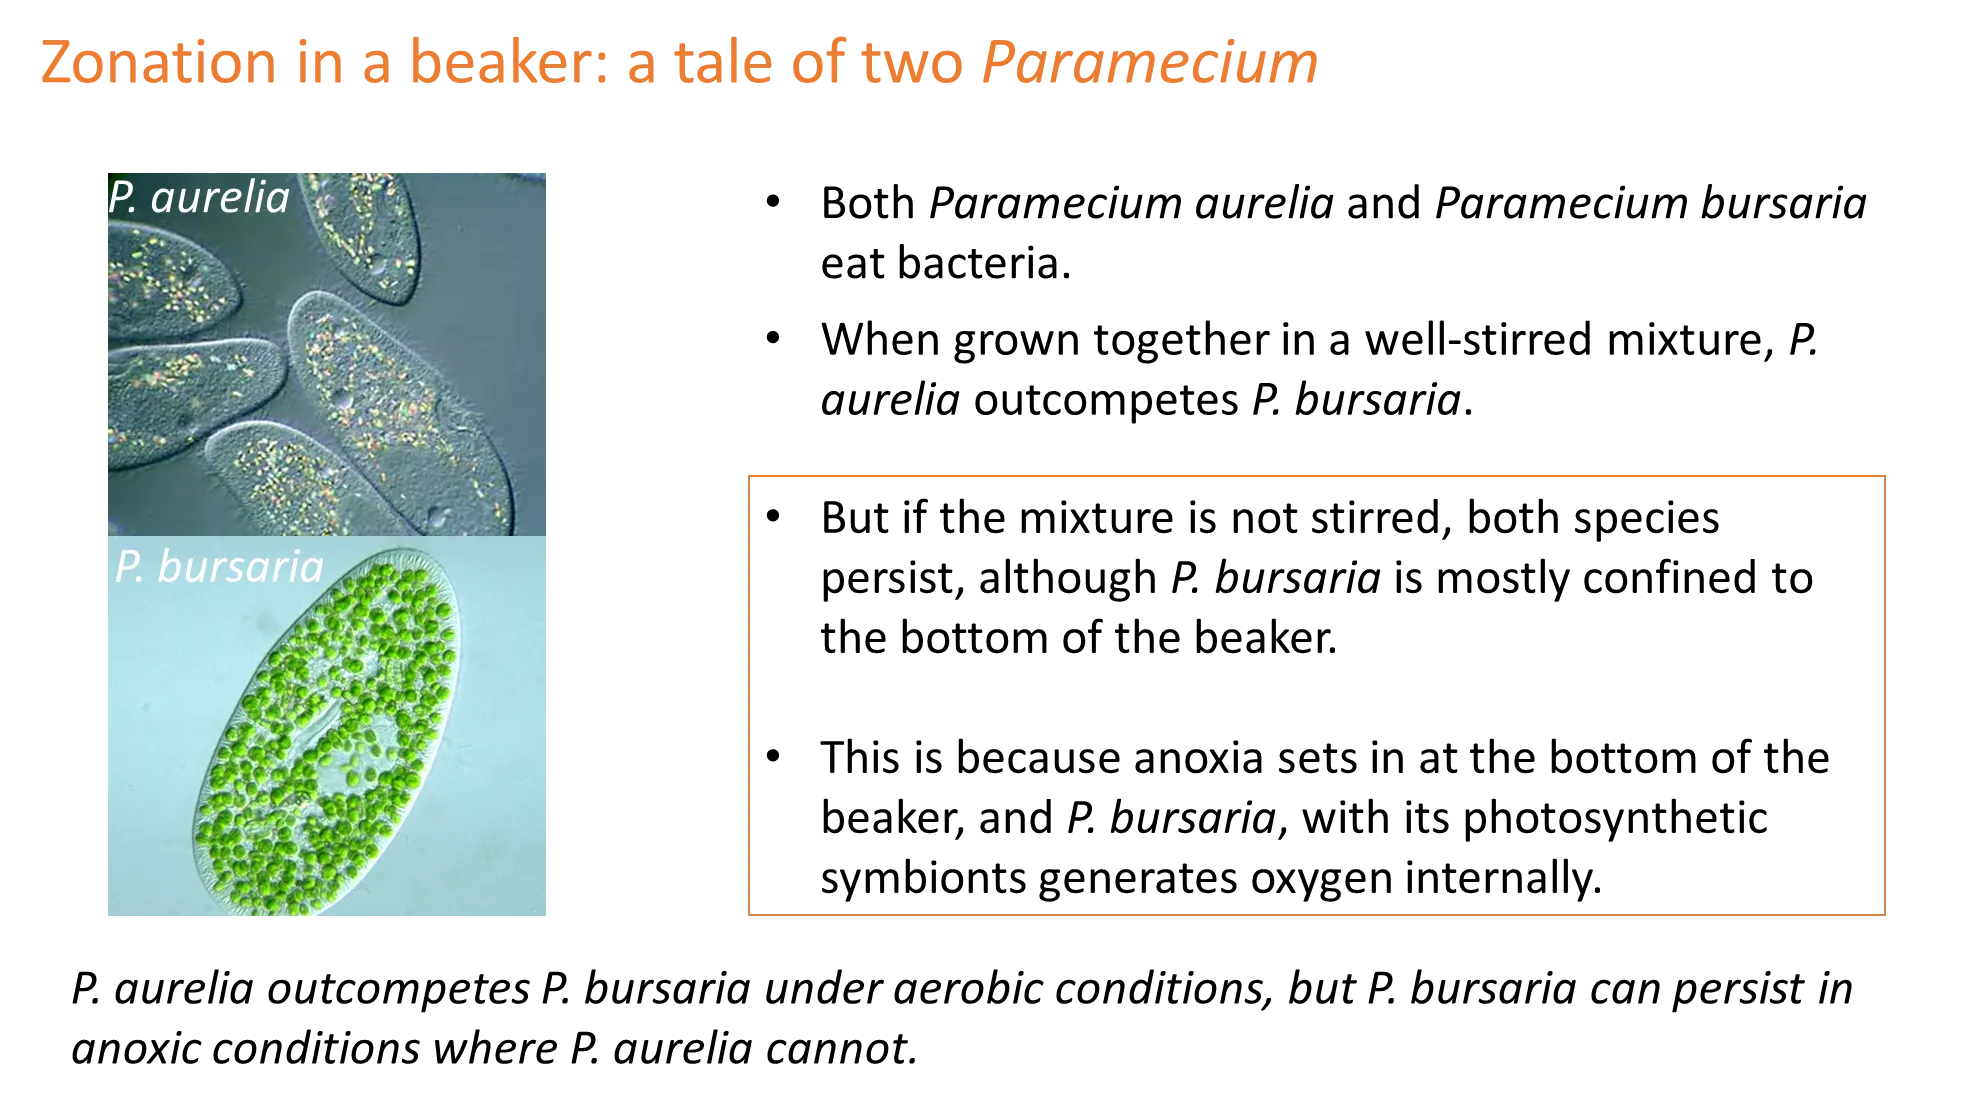
what is gause’s principle?
gause’s principle of competitive exclusion dictates that you won’t find two species coexisting on a single limited resource if other ecological factors are constant (one will always out-compete the other)
this is not necessarily obvious in natural systems (which have high diversity), but gause’s principle holds due to niche adaptation and trade-offs
eg. two barnacles in the same environment will adapt to living at different depths (upper shore species better at coping with dessication, lower shore species better at competing with other species)
eg. two paramecium species in the same beaker can survive if unstirred, because one has photosynthetic symbionts and can survive at the anoxic bottom of the beaker, whereas the other is better at competing for bacteria
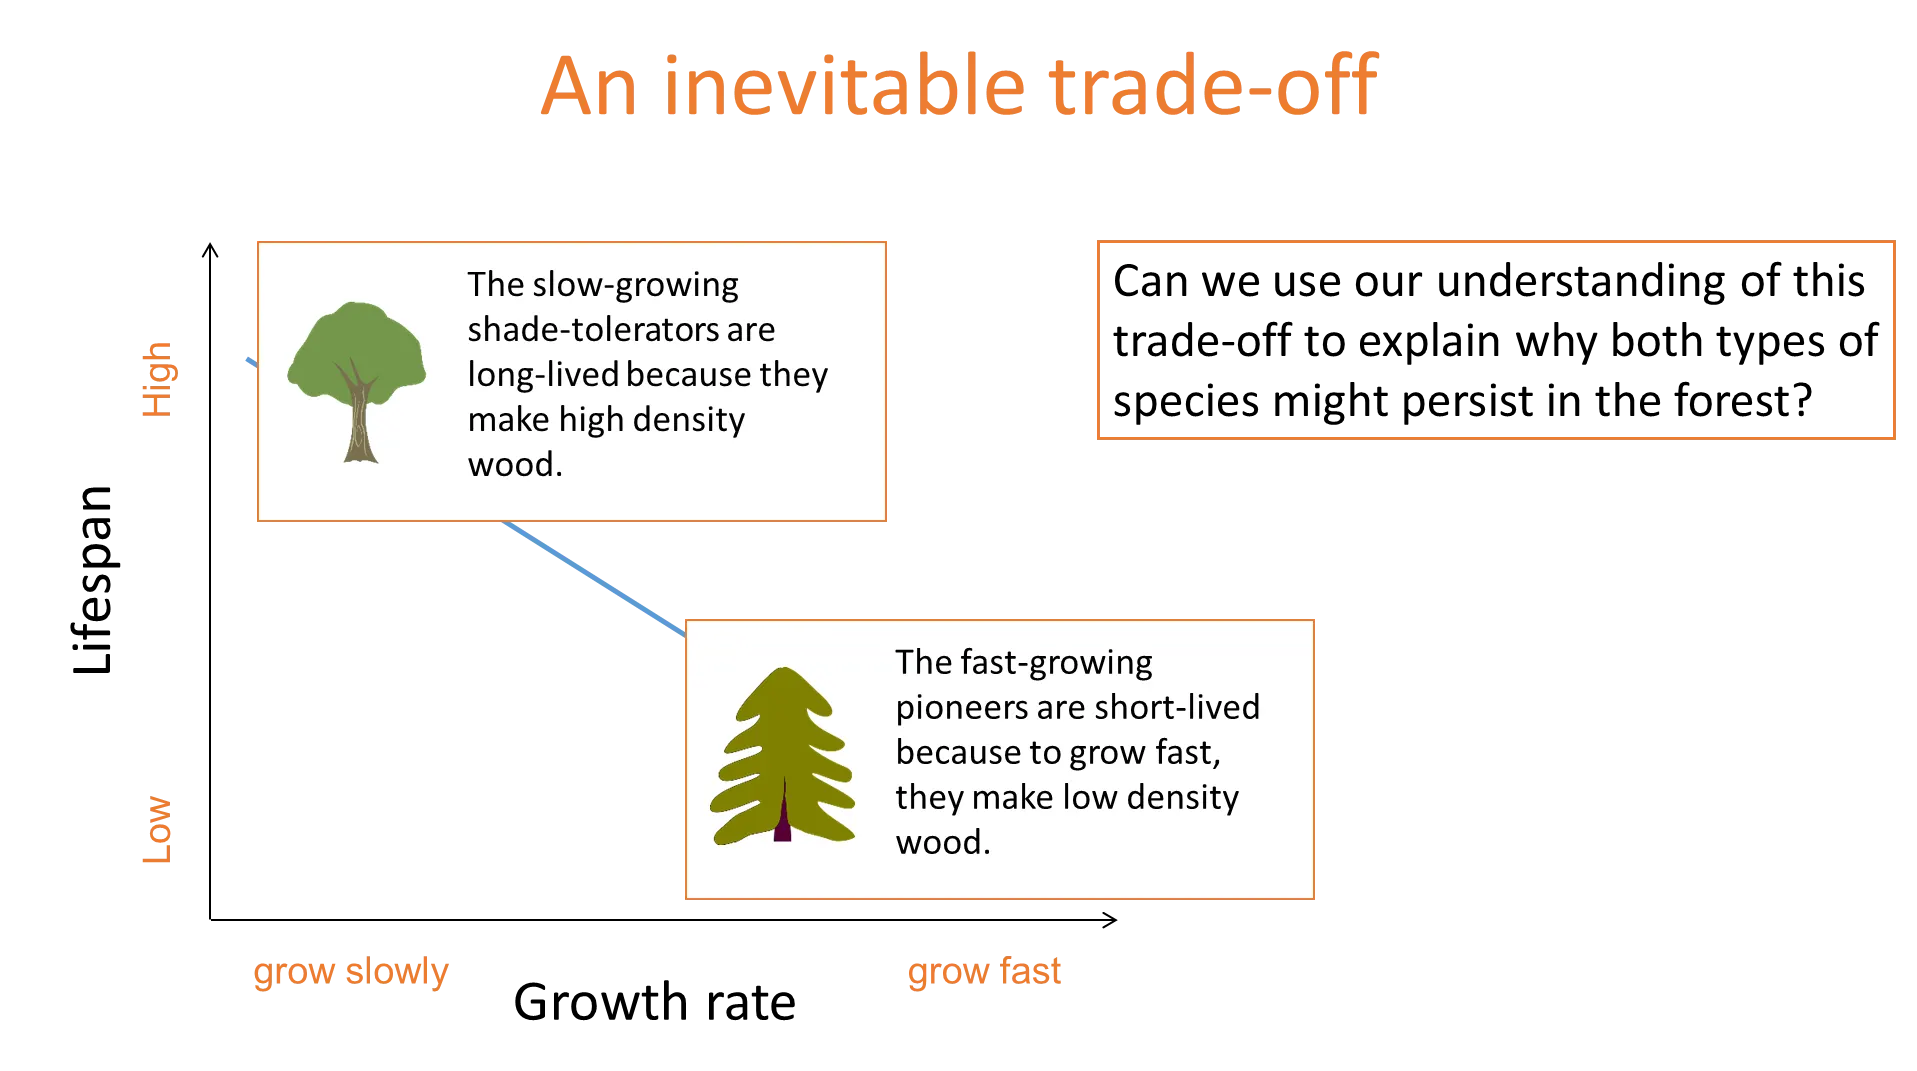
what is an example of a life history trade-off?
barro colorado island in panama (used to be a rainforest, isolated into an island when the river was damned)
there is a trade-off between growth rate in high light and survival in shade (lifespan)
shade tolerators survive well in the shade but aren’t fast growers in light gaps- because they produce high-density wood
pioneers grow quickly in gaps but don’t survive well in the shade- because they produce low-density wood
there is a negative correlation between these two traits
when a shade-tolerator dies, it will be replaced by a pioneer which can grow quickly in the gap
when a pioneer dies, it will be replaced by a shade tolerator, because there will already be shade-tolerant saplings growing in the light shade underneath the pioneer
the balance between these species will be determined by their lifespans
what are the different kinds of antagonistic interactions?
predation
the prey (-) is killed by the predator (+)
predators attack many prey during their lifetime
parasitism
the host (-) is harmed by the parasite (+) which lives in/on it
only part of the host is consumed
one or very few hosts are consumed by each parasite
parasitoids
the host (-) is killed by the parasitoid (+) which lives in/on it
the parasitoid consumes only one host during its lifetime
herbivory
the resource individual is a primary producer and has tissue removed by the consumer
the herbivore consumes only part of each resource individual
what is an example of a trophic cascade, classical biological control, and human impacts on population patterns?
trophic cascade- overhunting of sea otters:
= increase in sea urchins
= decrease in kelp
= decrease in all marine organisms dependent on kelp
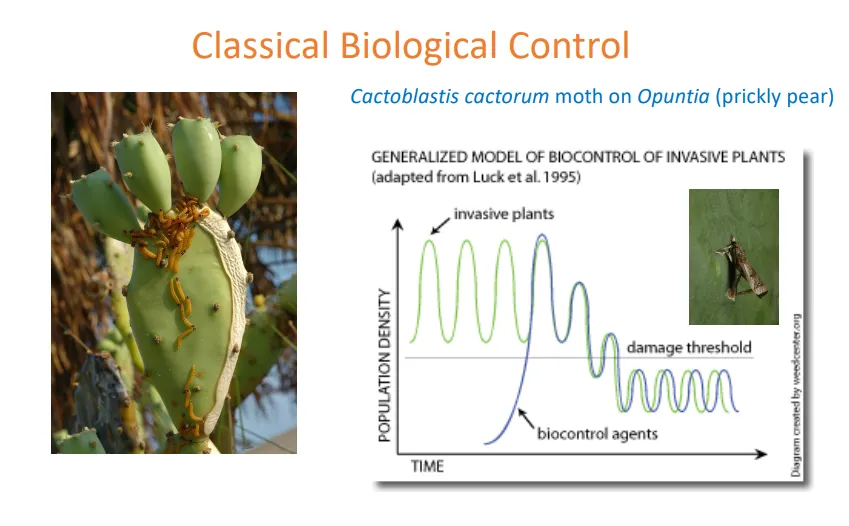
classical biological control- cactoblastis cactorum moth on opuntia (prickly pear):
the invasive prickly pear population was surviving above a damage threshold in australia
the moth was introduced as a biocontrol agent, which brought down the prickly pear population
human impacts: lago guri reservoir, venezuala:
the area was flooded for a hydroelectric dam
this produced many small islands, which couldn’t support populations of large predators
this released their prey from density dependence patterns, so their populations increased massively eg. rodents, howler monkeys, iguanas, leaf cutter ants
this had a severe trophic cascade effect because there was no top-down regulation by predators
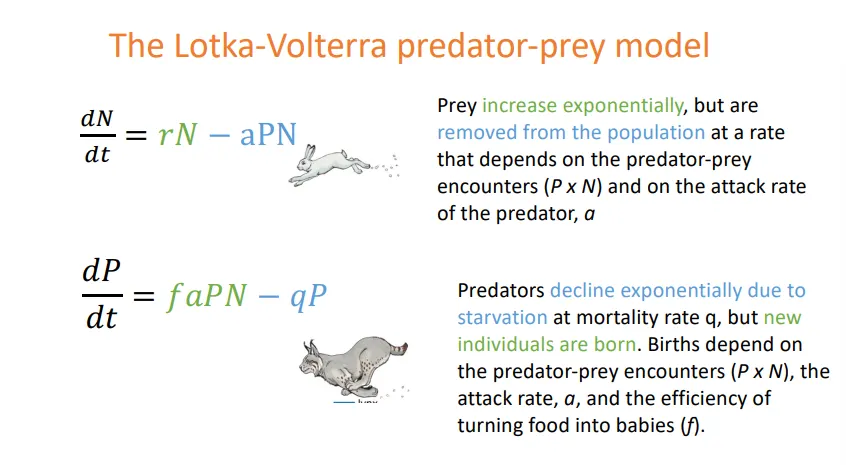
what is the lotka-volterra predator-prey model?
P is the population of the predator
N is the population of the prey
if you set both equations to 0, you can rearrange to find out the combinations that are needed to achieve constant population sizes of each (zero isoclines)
prey zero isocline = r/a
predator zero isocline = q/fa
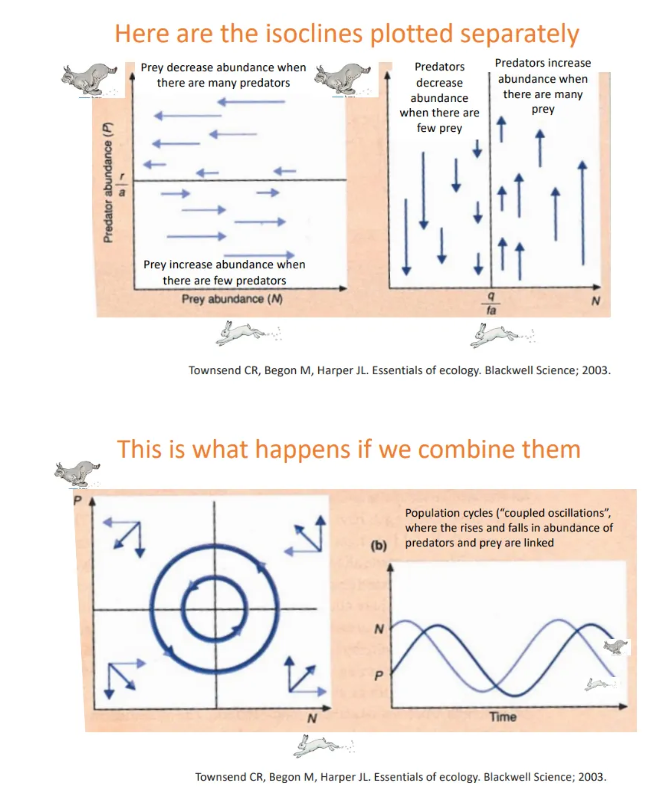
what are the plots of the zero isoclines for predator-prey interactions?
the isocline is the tipping point line in the centre of the graph
the size of the arrows represents the change in population size that we expect to see in the prey/predator (left/right graph)
closer to the line, smaller changes in population are expected = shorter arrows
plotting the two graphs together results in a cyclical graph
this shows how population sizes result in coupled oscillations, where the rises and falls in prey and predator abundance are linked
eg. snowshoe hare and lynx
this classical model is often not observed because predators eat multiple prey species, and prey are eaten by multiple predator species
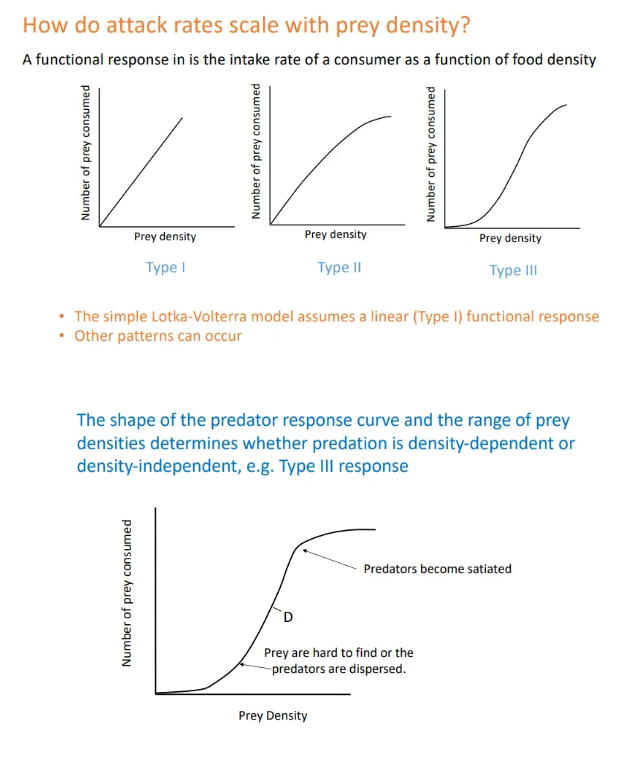
what is a problem with the lotka-volterra model?
the model assumes a linear relationship (type I functional response) between prey density and predator intake rate
however type II (hyperbolic) or type III (s-shaped) patterns can occur
at low prey populations, prey are hard to find and dispersed, and at high populations, the predators are satisfied, so a lower gradient is observed
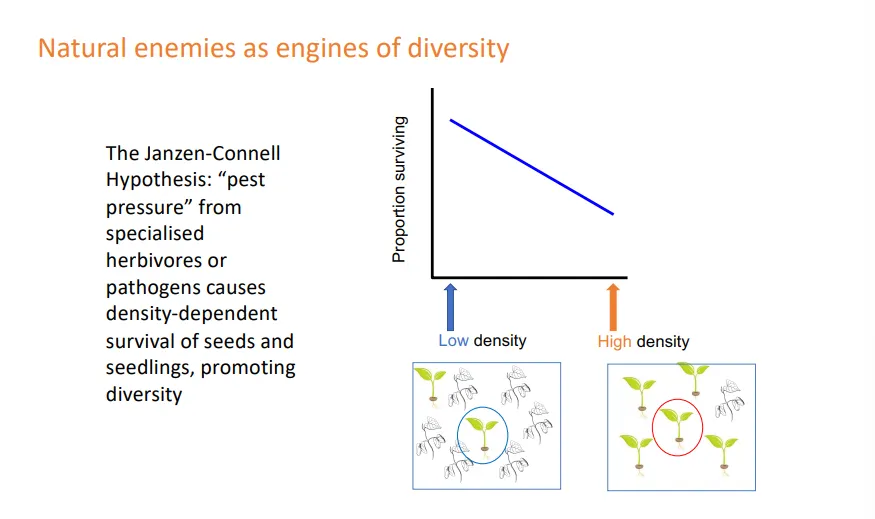
what is the janzen-connell hypothesis?
natural enemies drive diversity
the janzen-connell hypothesis: “pest pressure” from specialised herbivores or pathogens causes density-dependent survival of seeds/seedlings of abundant species
this promotes diversity because it means no one species can dominate, because other species will evolve to control it, so more species can exist
how does metapopulation dynamics inform conservation efforts?
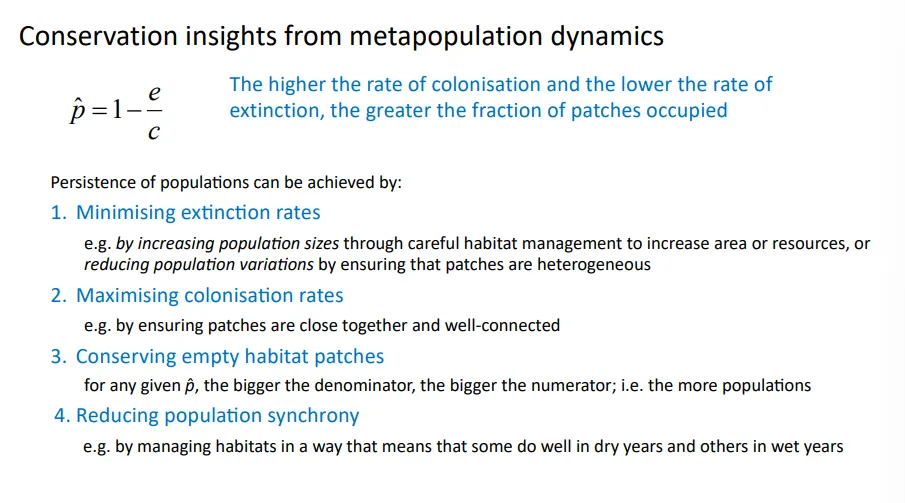
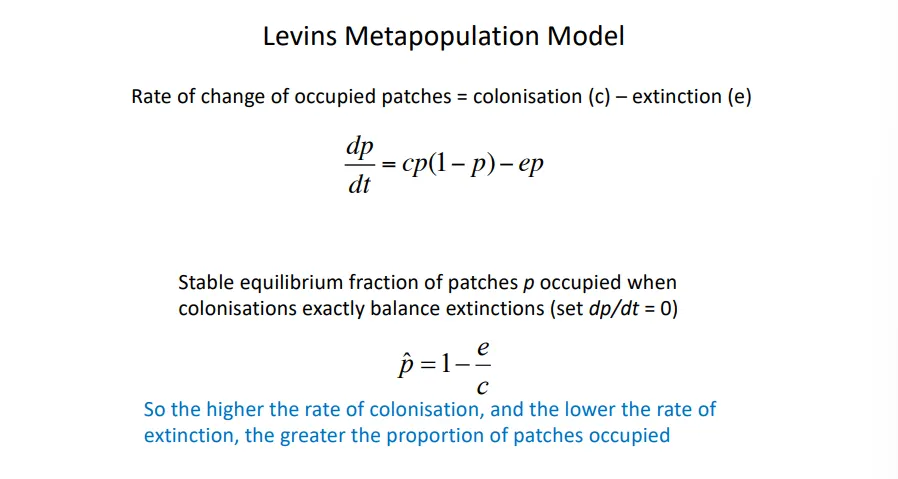
what is the lewis metapopulation model?
in fragmented ecosystems, the population of a species is controlled by the rate at which it colonises new patches and the rate of local extinction in patches
high colonisation + low extinction = a greater proportion (p) of patches occupied
colonisation rates change in a quadratic model, whereas extinction rates change in a linear model
this is still a semi-theoretical model, as it must be relatively rare, but still possible, for individuals to move between patches (without really affecting the population size, unless establishing a new population), and they must still be extinction-prone
otherwise it is just a mainland-island model, as one patch can still support a large, stable popualtion
why are fragmented populations more extinction-prone?
the fragmentation of habitats (anthropogenic or natural) leaves small patches of habitats with incomplete resources
these patches have much smaller carrying capacities and small existing populations, making species extinction-prone, because they are more susceptible to:
environmental stochasticity
demographic stochasticity
genetic effects (drift)
allee effects
what are the different kinds of fragmented populations? include examples
metapopulation- a population continually colonises patches and goes locally extinct, at relatively equal rates eg. the glanville fritillary butterfly lives in meadow fragments in an archipelago in finland
panmictic population- like a metapopulation, but the extinction rate is much lower than the colonisation rate, so patches are rarely not occupied eg. holly leafminer are very able to move between holly bushes
mainland-island- peripheral patches are periodically colonised by individuals from the large, stable mainland population, and can go extinct eg. edith’s checkerspot butterfly which needs serpentine grassland
source-sink- the sink is only occupied because the population is being continually topped up by immigration from the source population exporting individuals eg. sea rocket (source = beach, sink = dunes)
what is the comparative method?
the comparative method is a way of deducing the reasons for different adaptations by comparing traits across different species
this method must be modified to consider:
shared ancestry using phylogeny and ancestral state reconstruction, to not include instances of non-independent evolution
multiple hypotheses must be considered to prevent the acceptance of ‘just-so stories’
ecological variables have to be quantified
it is just observational, not experimental, so correlation vs causation must be considered