Chapter 6 Normal Distributions & Sampling
1/20
There's no tags or description
Looks like no tags are added yet.
Name | Mastery | Learn | Test | Matching | Spaced | Call with Kai |
|---|
No analytics yet
Send a link to your students to track their progress
21 Terms
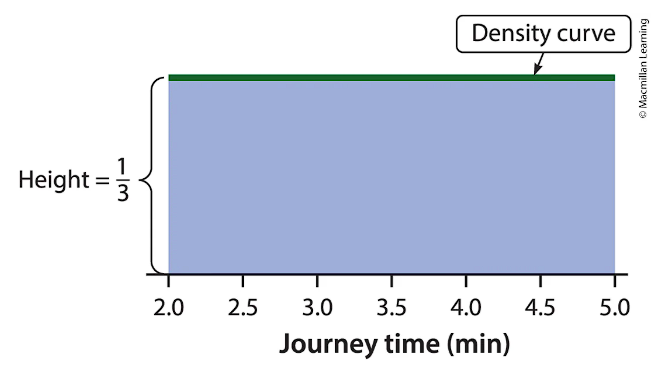
Density Curve
Models the probability distribution of a continuous random variable with a curve that:
1) is always on or above the x-axis, and
2) has an area of exactly 1 underneath
Equal-Areas Point
The median of a density curve; it is the point that divides the area under the curve in half
Normal Distribution
Described by a symmetric, single-peaked, bell-shaped density curve called a Normal Curve
What 2 characteristics completely specify a Normal Dsitribution?
The mean “μ”
The standard deviation “σ”
T/F: The mean “μ” of a Normal Distribution is located at the midpoint and is the same as the median
True
The Empirical Rule
States that in any normal distribution about 68% of values fall within 1σ, about 95% fall within 2σ, and about 99.7% fall within 3σ of the mean.
Standard Normal Distribution
The normal distribution with mean 0 and standard deviation 1, which can be used to find areas under any normal curve
Statistic
A number that describes some characteristic of a sample
Parameter
A number that describes some characteristic of the population
The value of a _____ is usually unknown. To estimate its value, we use _____ calculated from a random sample.
Parameter; Statistic
Sampling Distribution
The distribution of values taken by the statistic in all possible samples of the same size from the same population
Sampling Distribution of the Sample Proportion (p̂)
Describes the distribution of values taken by the sample proportion (p̂) in all possible samples of the same size from the same population
To determine is the Sample Proportion (p̂) provides convincing evidence, we need to know the _________________.
Sampling distribution of the sample proportion (p̂)
How to calculate the Mean of the Sample Proportion (μp)
μp = p
How to calculate the Standard Deviation of the Sampling Distribution (σp)
σp = sqrt((p(1-p)/n)
What are 4 identifying facts about the Sample Proportion (p̂)
The sample proportion (p̂) is an unbiased estimator of the population proportion (the mean “μp” is equal to the population proportion “p”)
The standard deviation of the sampling distribution of p̂ describes the typical distance between p̂ and the population proportion “p”
The sampling distribution of p̂ is less variable for larger samples
The formula for the standard deviation σp requires that the observations are independent
Large Counts Condition
Says that the sampling distribution of p̂ will be approximately normal when np >= 10 and n(1-p) >= 10
Sampling Distribution of the Sample Mean (x̂)
Describes the distribution of values taken by the sample mean x̂ in all possible samples of the same size from the same population
When sample data are quantitative, we use the ____ ____ to estimate the mean “μ” of a population
Sample Mean (x̂)
How to calculate the Mean of the Sampling Distribution (μx)
μx = μ
How to calculate the Standard Deviation for the Sampling Distribution (σx)
σx = σ/sqrt(n)