Topic 2: Market interventions
1/39
There's no tags or description
Looks like no tags are added yet.
Name | Mastery | Learn | Test | Matching | Spaced | Call with Kai |
|---|
No analytics yet
Send a link to your students to track their progress
40 Terms
Government interventions usually alter market outcomes
Note: a perfectly competitive market leads to an efficient outcome, maximising the aggregate surplus generated by the production and consumption of a good —> the best government policy would be to let markets function without interference provided they are competitive and don’t suffer from any other of the forms of market failure.
Taxes - why do governments tax goods?
To raise the revenue needed to pay public expenditures
What two kinds of taxes are there?
Specific tax: a fixed dollar amount that must be paid on each unit bought or sold
Ad valorem tax: a tax that is stated as a percentage on the good’s price
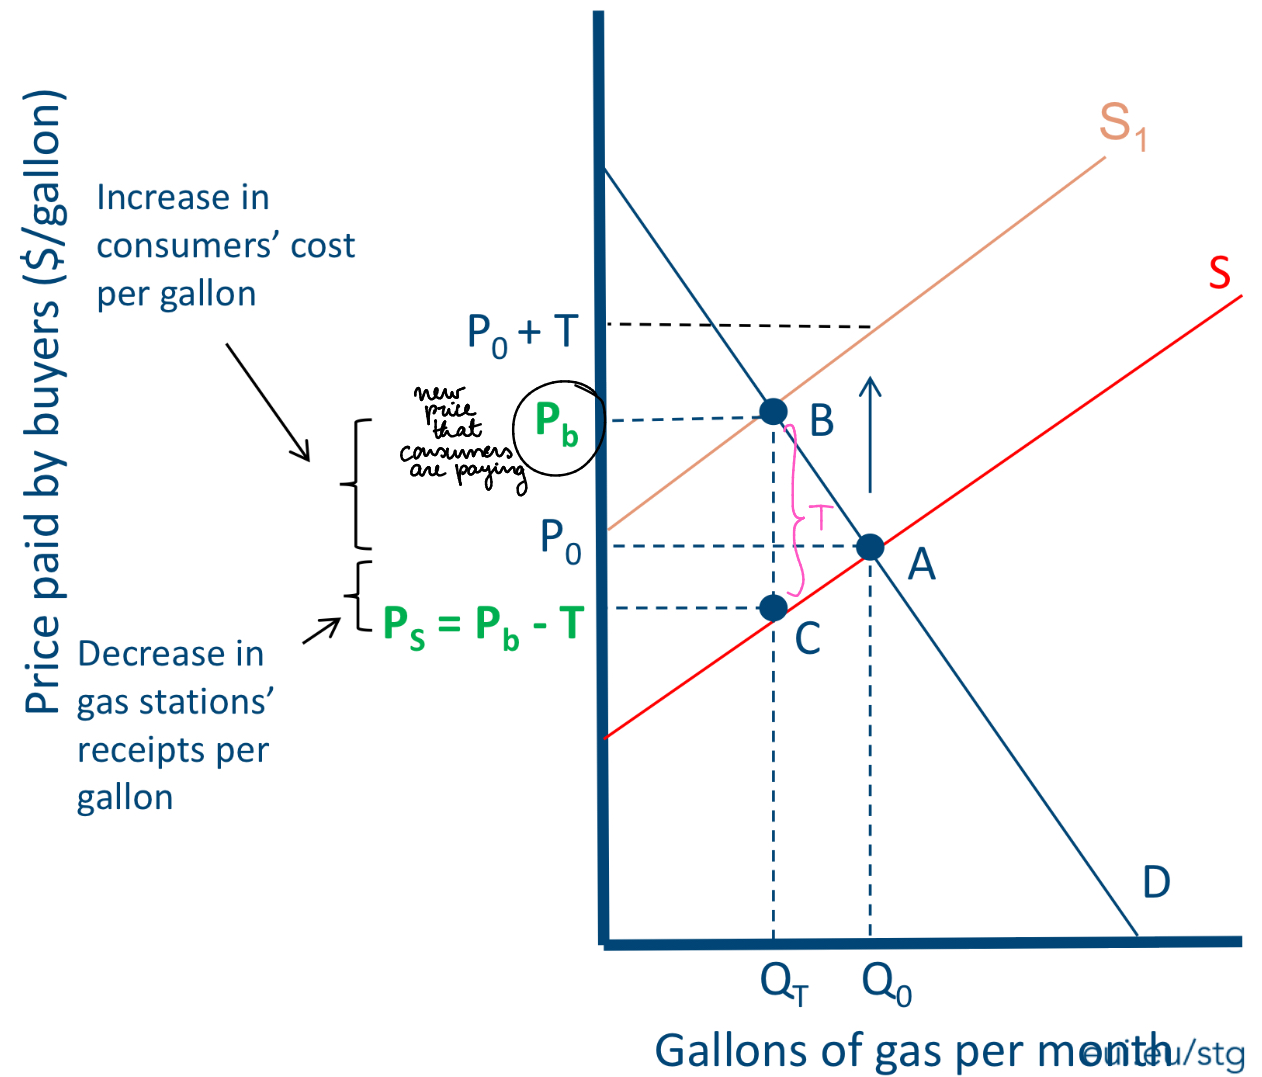
Effects of a specific tax (on producers)
Upwards shift of the market equilibrium
Increase in consumer’s price paid (due to the tax)
Decrease in the price received by producers due to the tax
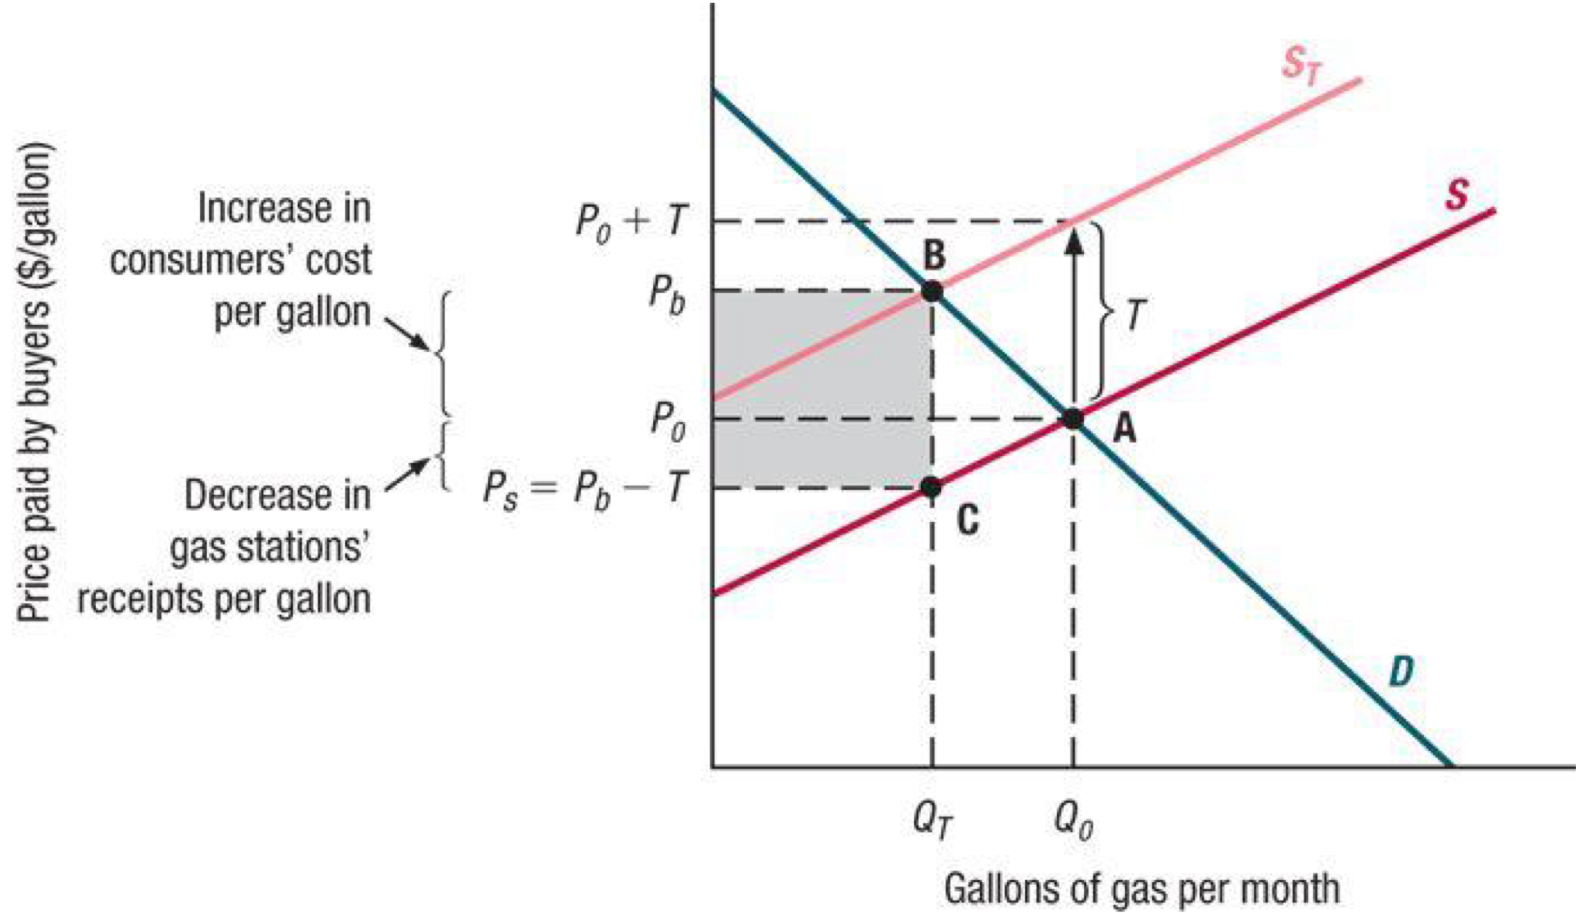
What do we mean by the incidence of a specific tax?
How much of the tax burden is borne by various market participants
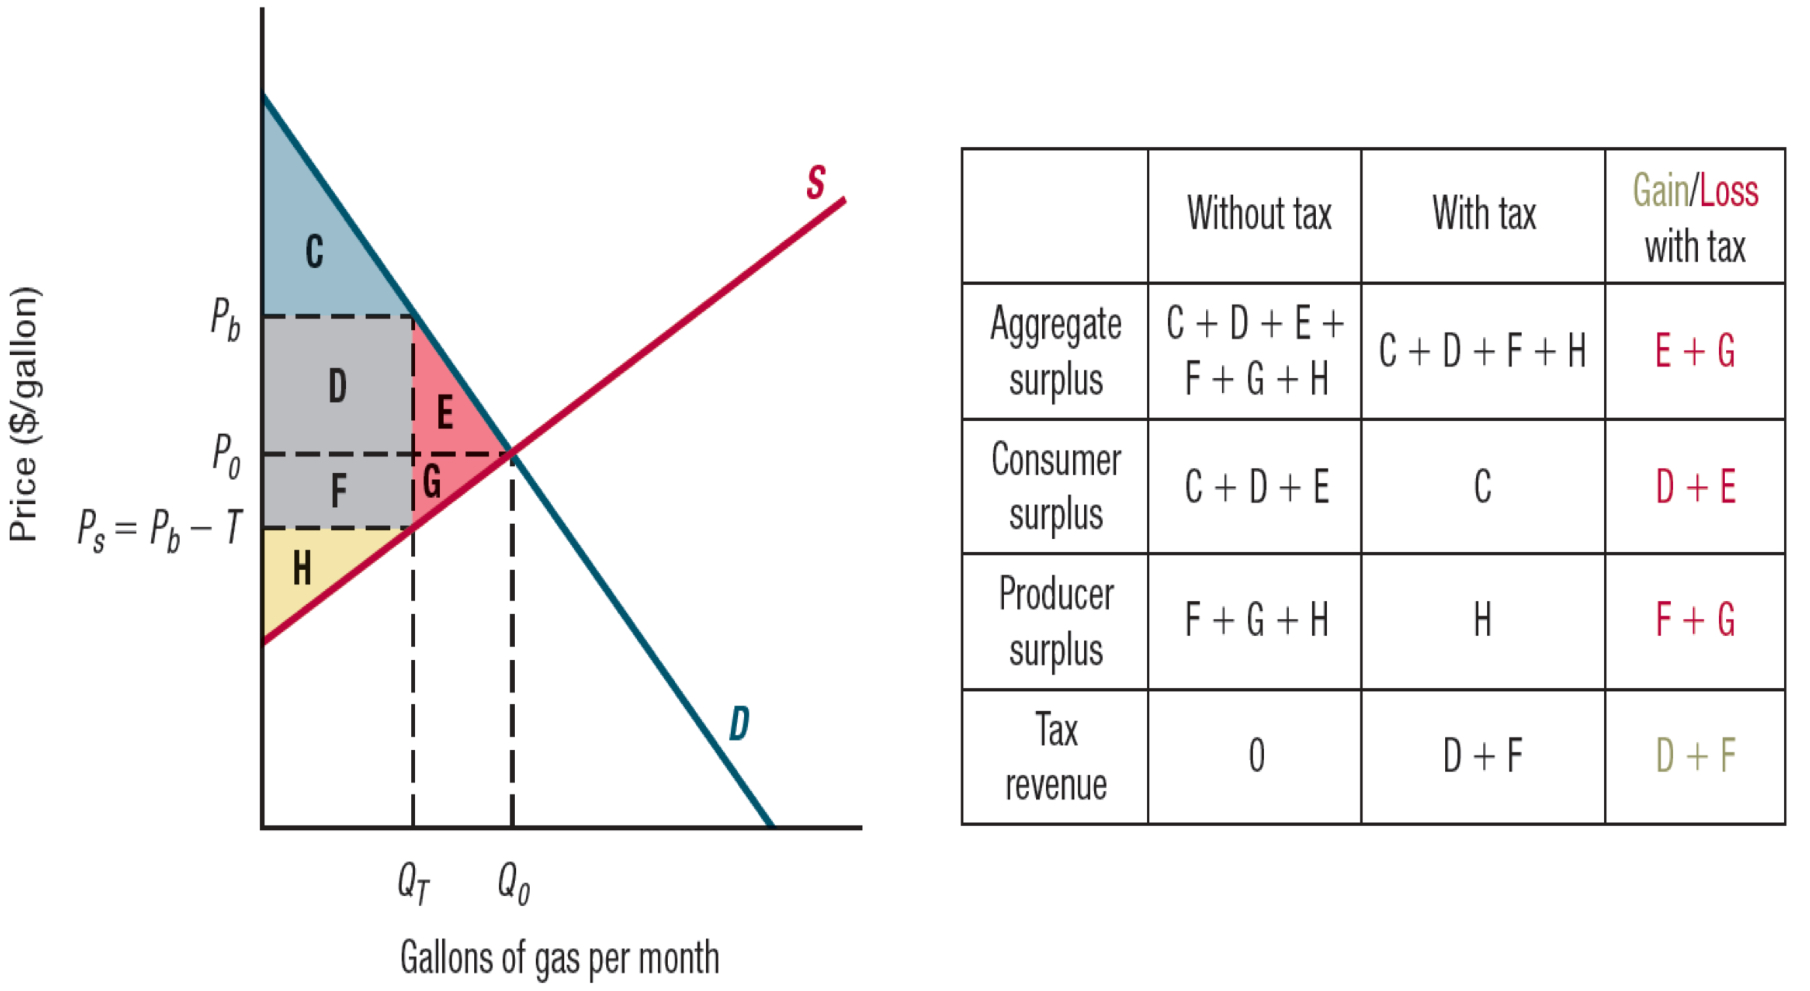
How do we calculate (and visualise) tax revenue?
Tax revenue: TxQ(with the tax) —> gray area
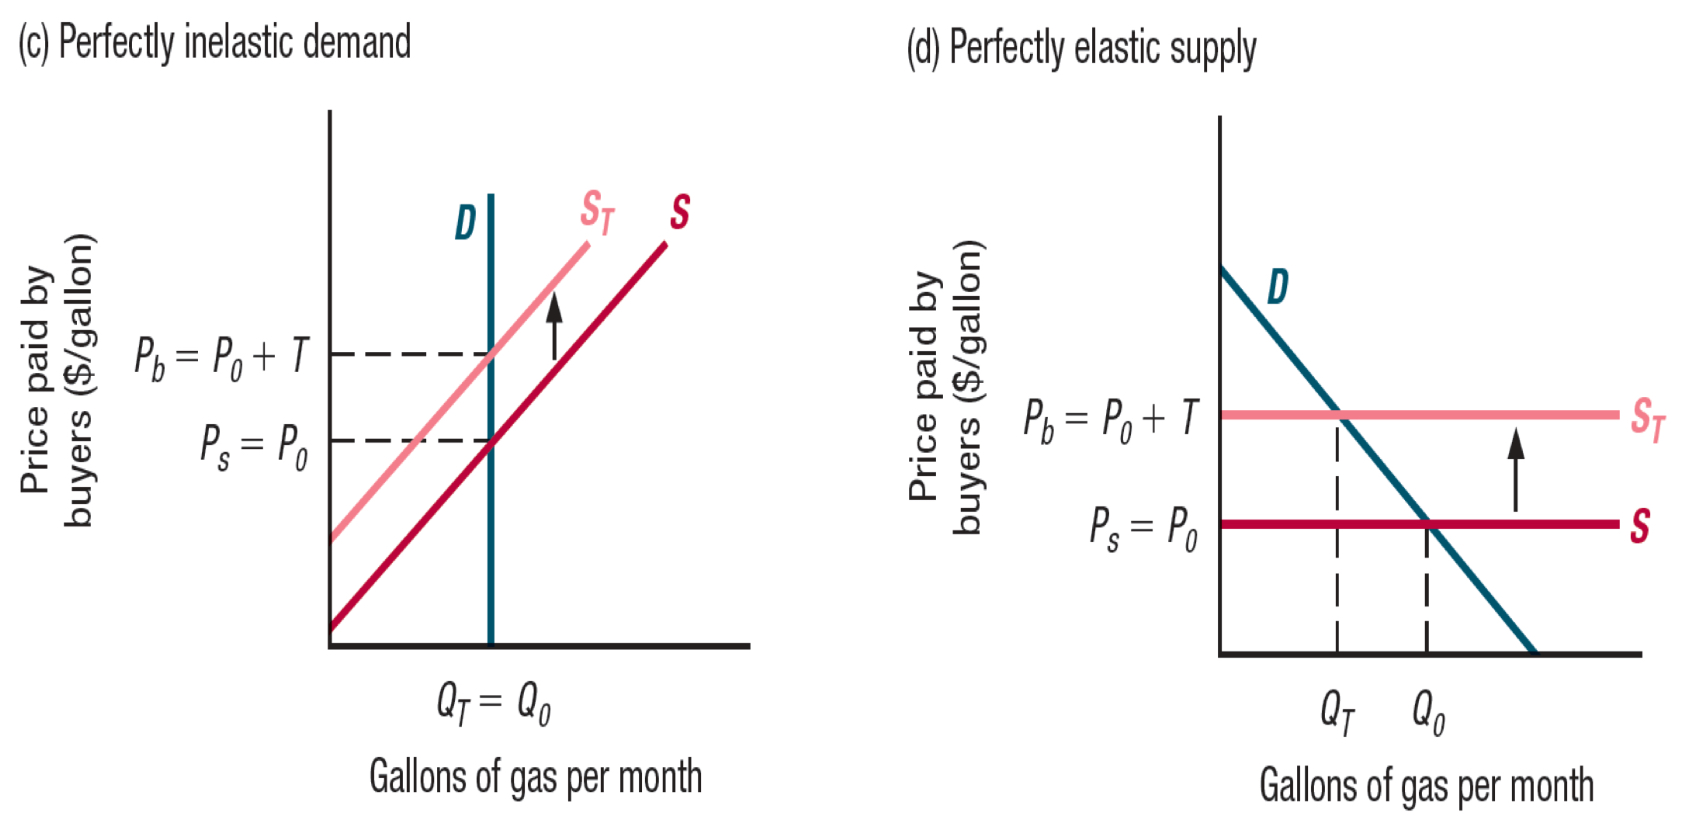
How do elasticity and tax incidence work together?
The more elastic demand is, and the less elastic supply is, more of the tax is borne by seller
Buyers’ share for small taxes
E(supply)/ E(supply) - E(demand)
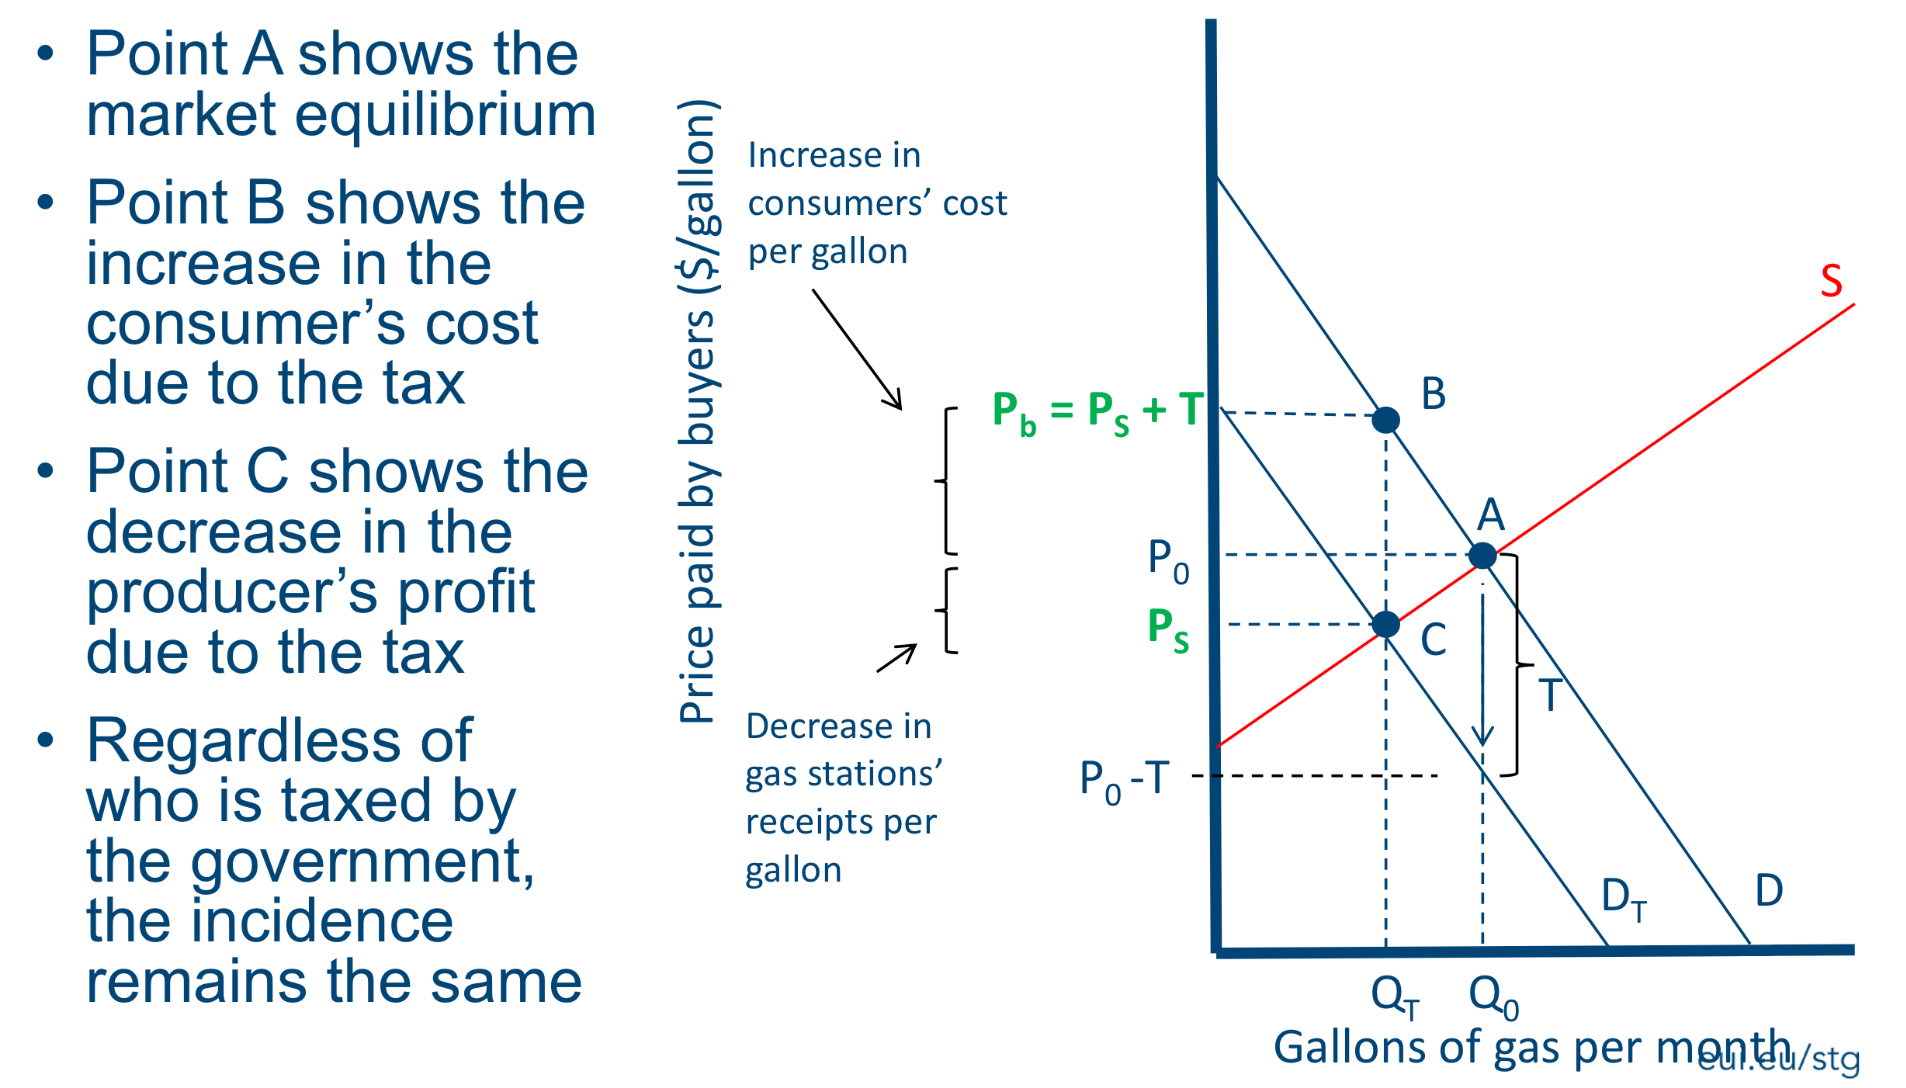
Effects of a specific tax: shifting the demand curve
Welfare effects of a specific tax: DWL of taxation
Deadweight loss of taxation: lost aggregate surplus due to a tax
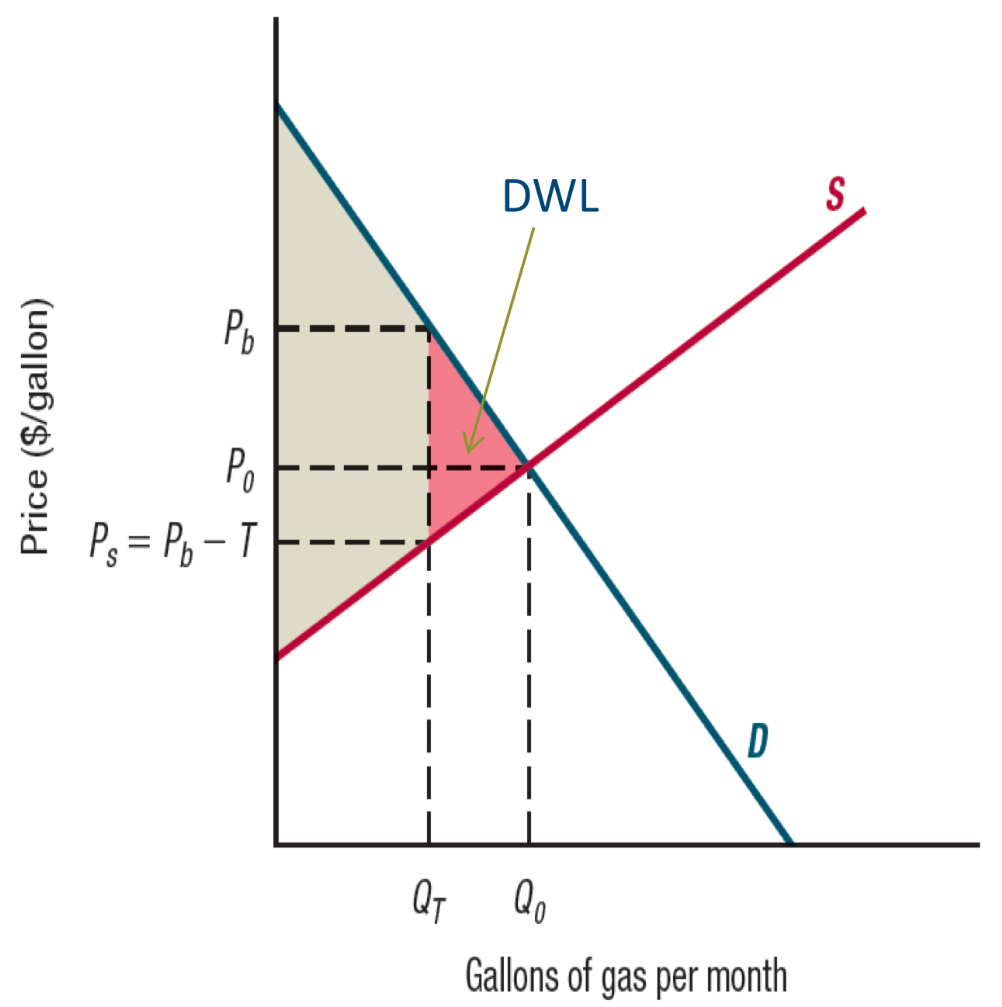
Visualising welfare effects of a specific tax
Incidence of a specific tax (on producers) - Sellers bear the entire burden of the tax
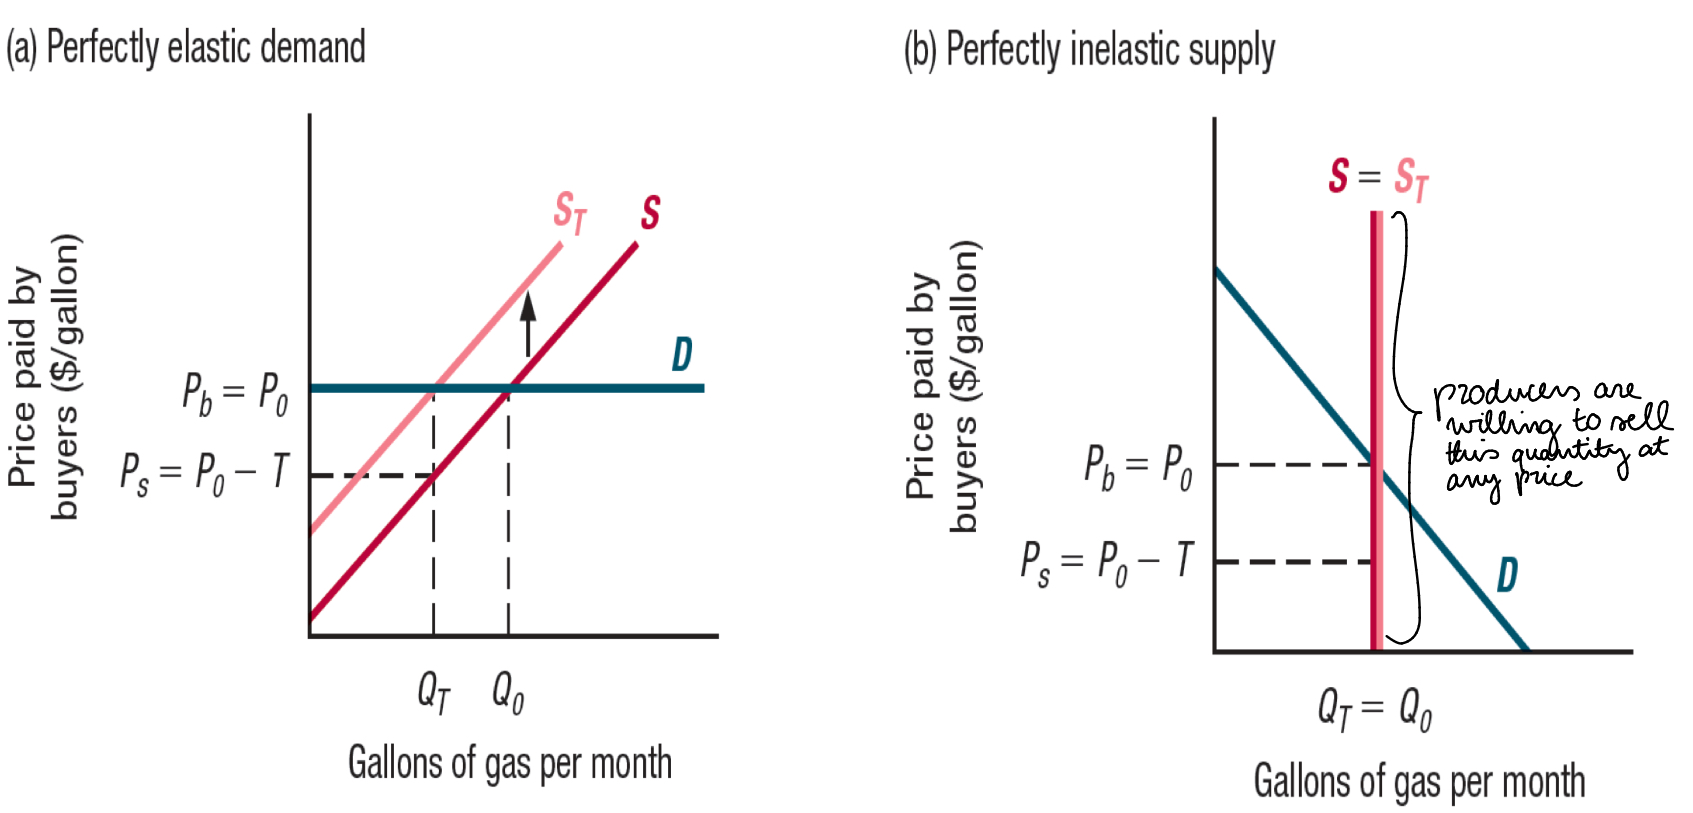
Incidence of a specific tax (on producers) - Buyers bear the entire burden of the tax
Review
The effects of a tax are independent of who is legally required to pay it (whether buyers or sellers)
The economic incidence of a tax depends on the elasticities of demand and supply: the more elastic demand is, and the less elastic supply is, the smaller the share of the tax is borne by consumers
Policies designed to raise, or lower, competitive prices create DWL
Wrapping up: effects of a tax
Willingness to pay decreases —> demand decreases
Reservation price increases —> supply increases
—> A subsidy works in the opposite way: lower prices, higher quantity (Pb goes down, and Ps goes up)
So, which goods should the government tax?
Goods for which the deadweight loss of taxation will be low (i.e. goods whose demand or supply curve is very inelastic)
In some circumstances, governments offer subsidies —> what do they do?
This payment reduces the amount that buyers pay for a good or increases the amount that sellers receive
What do subsidies often result from?
From extensive lobbying efforts on behalf of the beneficiaries, for example the US:
subsidises the production and use of ethanol in gasoline (increasing the incomes of ethanol producers, gasoline refiners, and the farmers who grow the corn that is its primary input)
subsidises home mortgage loans (increasing the well-being of home buyers and sellers, firms who build those houses, and the real-estate agents)
Unlike taxes…
Subsidies increase sales of the subsidised good
Like taxes, however…
They cause deadweight losses
What is subsidies’ effect in competitive markets?
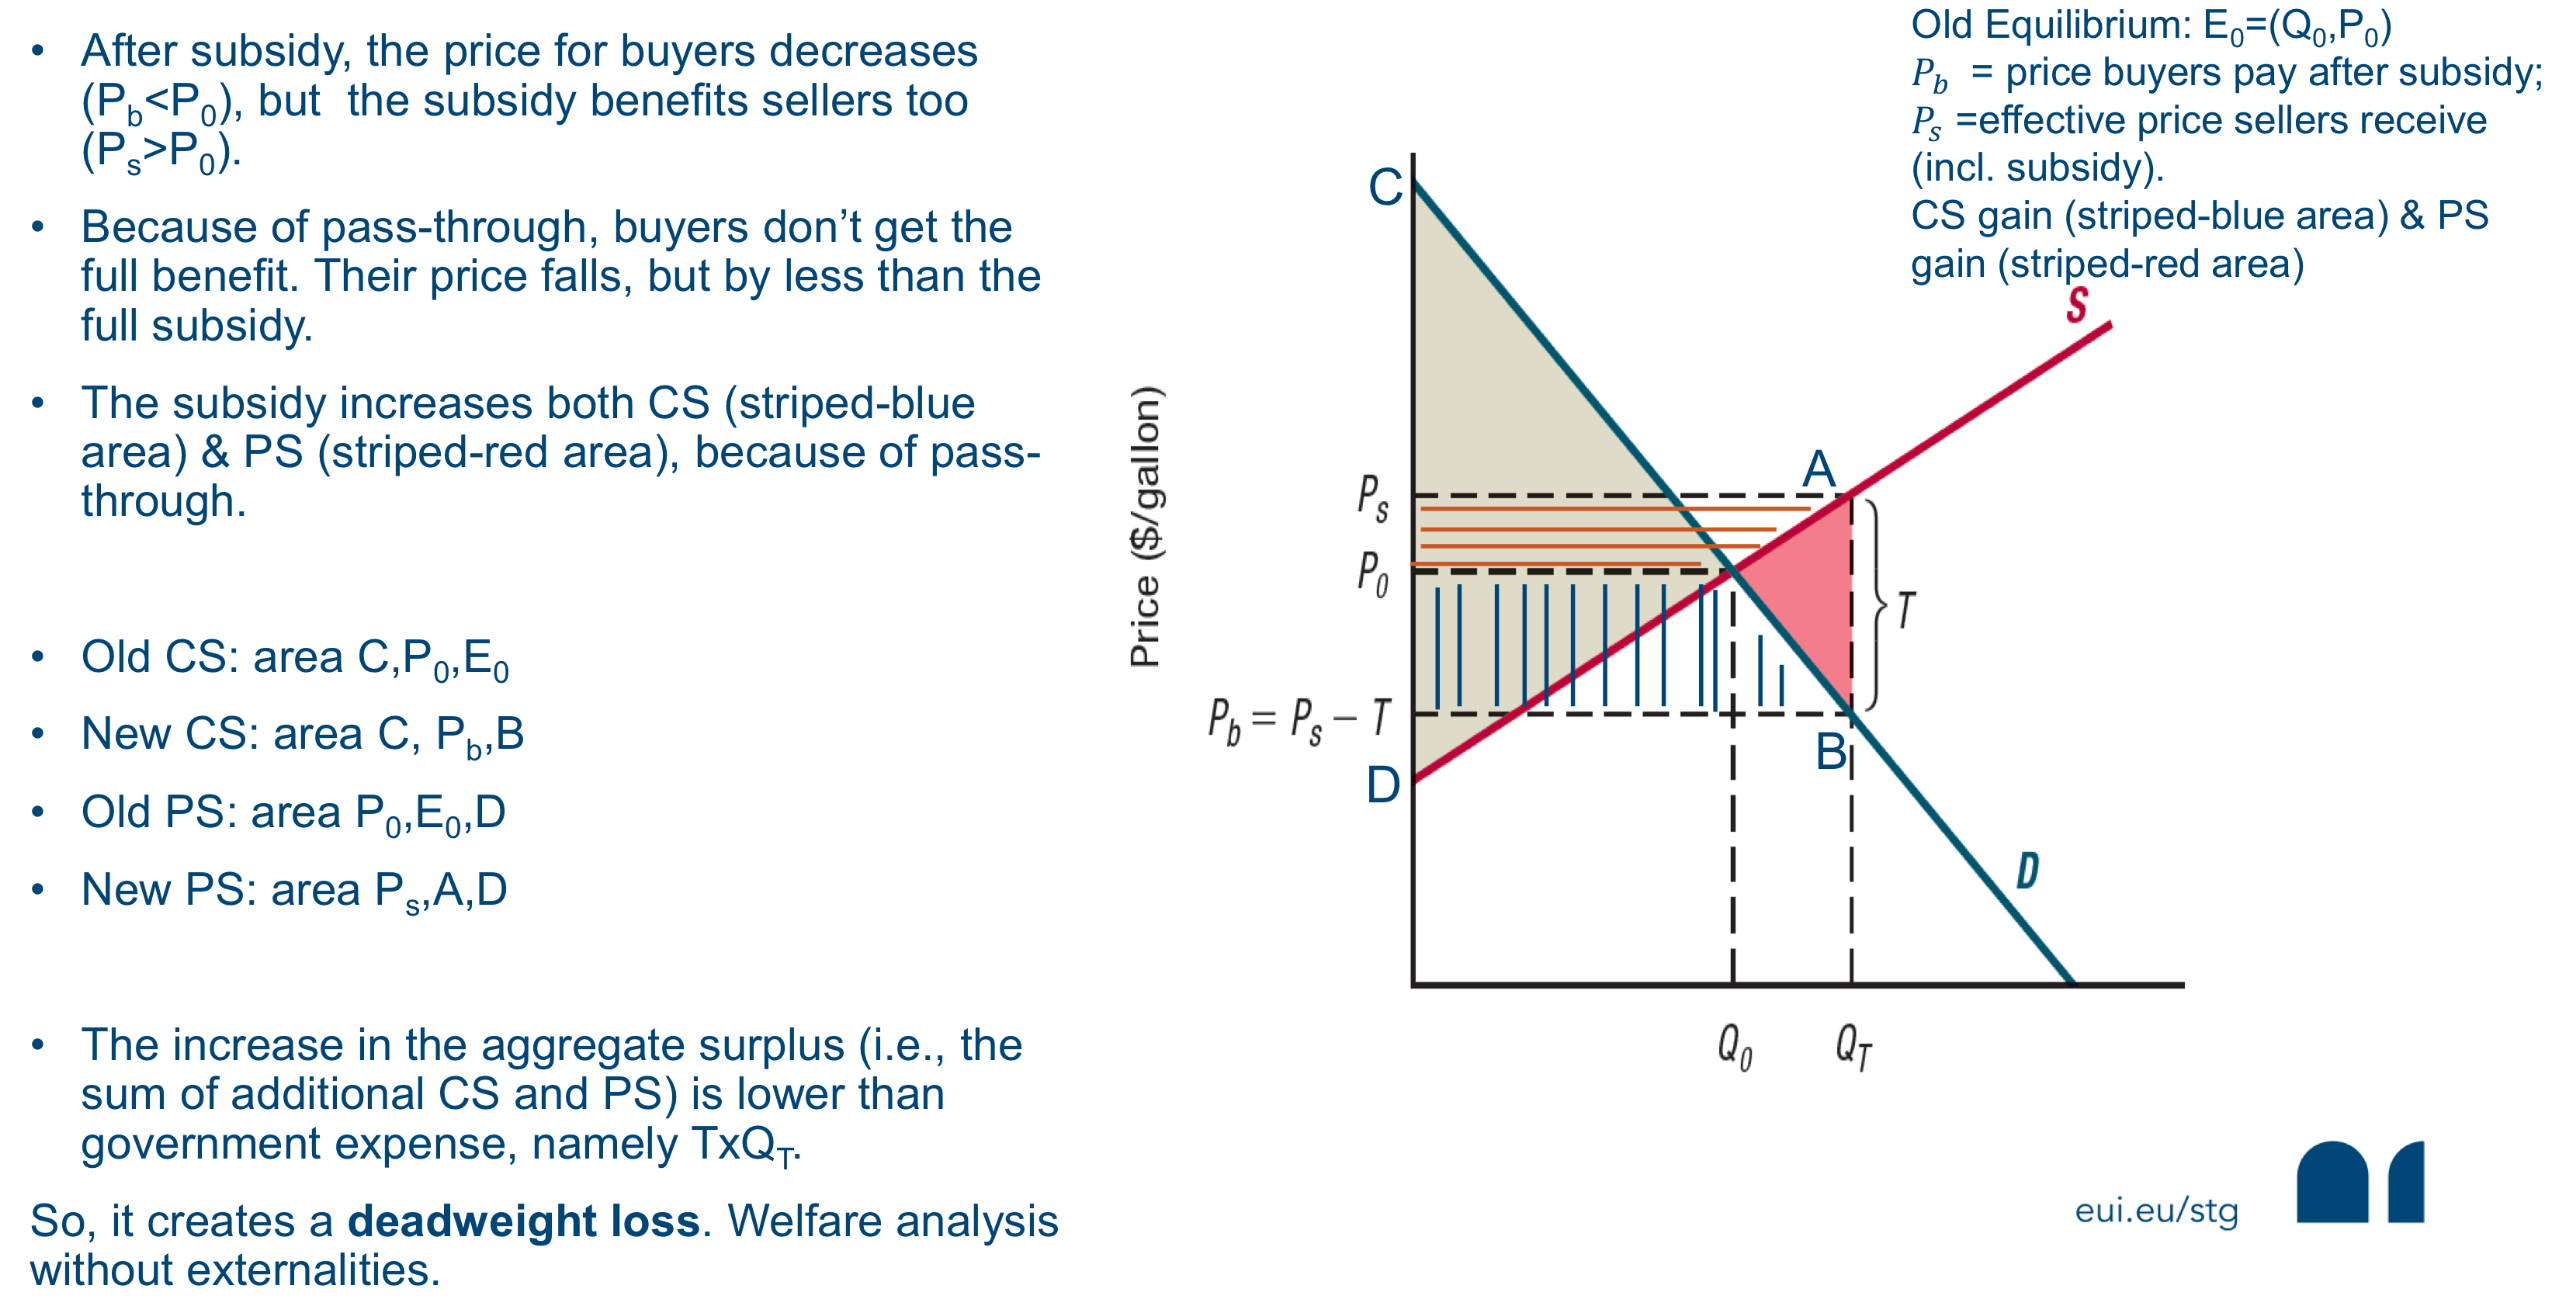
They increase Consumer & Producer Surplus (CS & PS) but they create DWL (because the increase in the aggregate surplus is lower than government expense, namely TxQt)
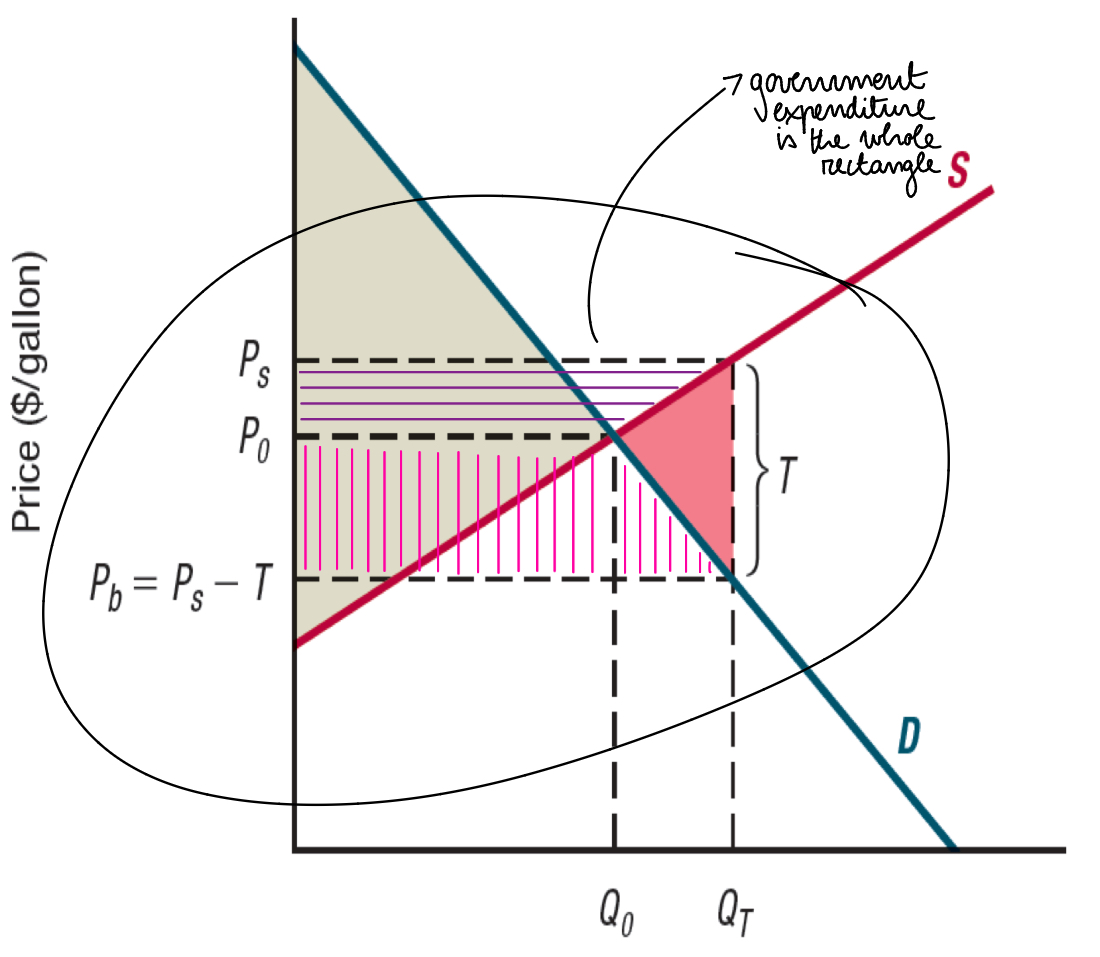
The theory of Subsidies
Take-home message
Subsidies lower buyers’ price, raise sellers’ effective price and increase Q
Subsidies benefit both consumers and producers
Pass through refers to buyers not enjoying the full subsidy (they don’t pay P0-T) because sellers adjust
Given that government expense is larger than welfare gain —> DWL
What are four policies that raise prices?
Price floors
Price supports
Production quotas
Voluntary production reduction
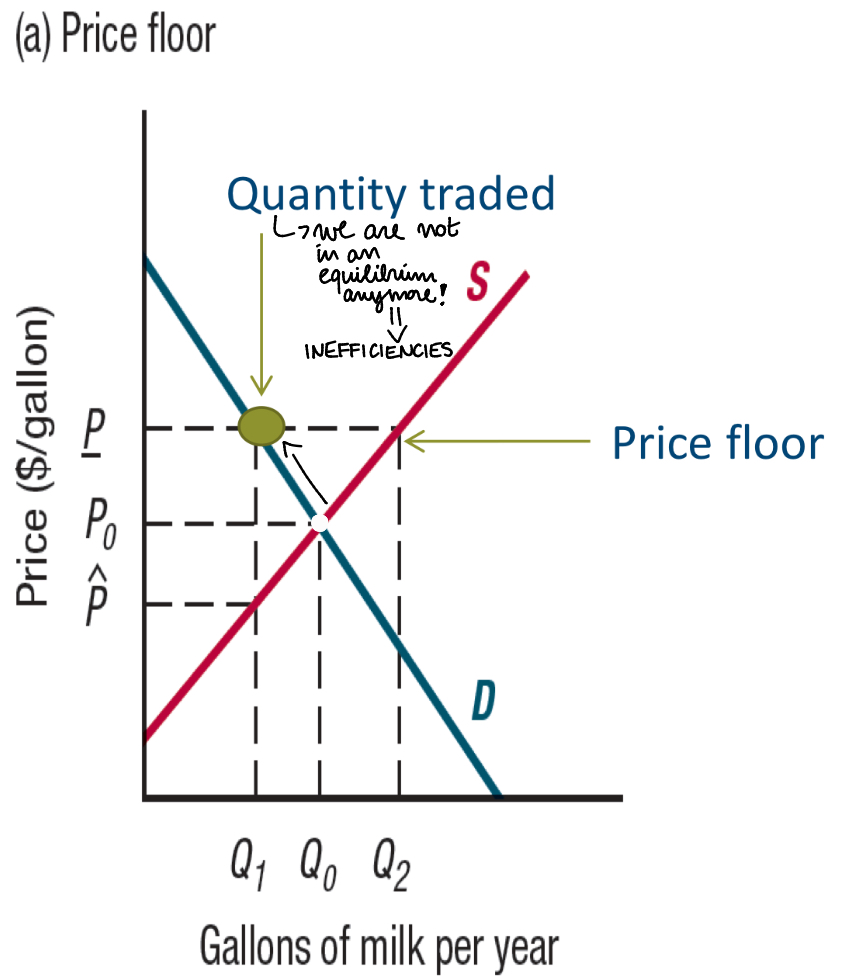
Price floors —> what do they establish?
=establishes a minimum price that sellers can charge (higher market price)
What are examples of price floors?
minimum prices for milk
minimum wage laws, etc.
Who do price floors support?
Producers
Visualising price floors in a graph
When the government imposes a price floor of P, Q1 gallons are bought and sold.
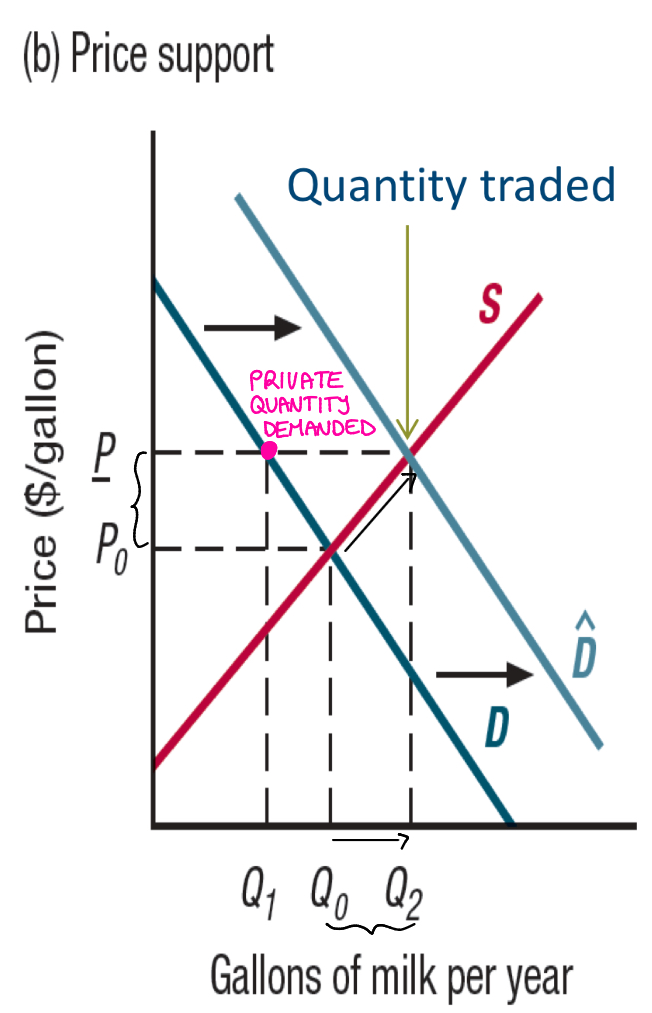
Price supports —> what do they do?
They raise the market price by making purchases of the good (increasing demand —> increasing price + quantity)
A practical example of price supports
A traditional policy of EU gvts. and the US: raising prices for many agricultural crops
Visualising price supports in a graph
When the government implements price supports, it may end up buying a lot of the good for which it may have little or no use at al (Q2 - Q1 gallons a year)
Total sales of milk are Q2 gallons, of which Q1 gallons are bought by private buyers
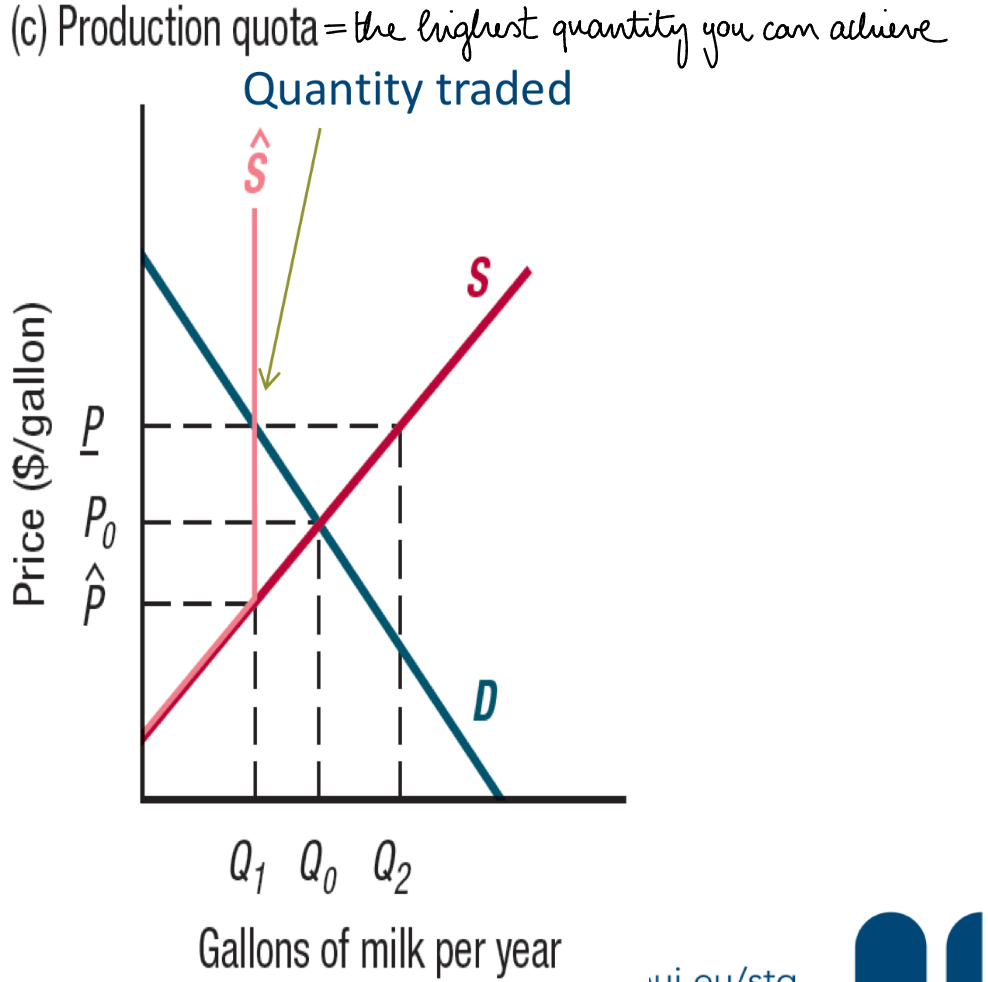
Production quotas —> another way of?
Another way of raising prices without causing overproduction (as with a price support program)
How do production quotas work?
Rather than raising demand, the government restricts supply by imposing limits on the quantity that individual firms can produce (—> setting a quota on production)
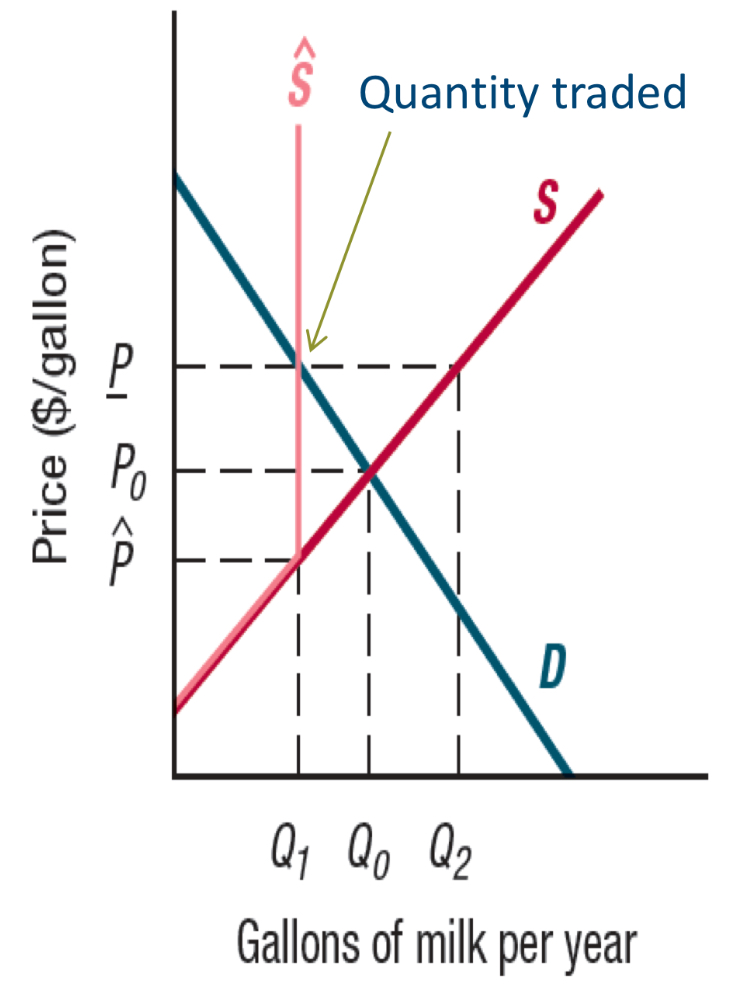
Visualising production quotas in a graph
The government reduces the supply by convincing farmers to limit their production to Q1 gallons per year, either by imposing a production quota or by instituting a voluntary production reduction program
Voluntary production reductions —> what do they offer firms?
They offer firms inducements to reduce their production voluntarily
Visualising production reductions
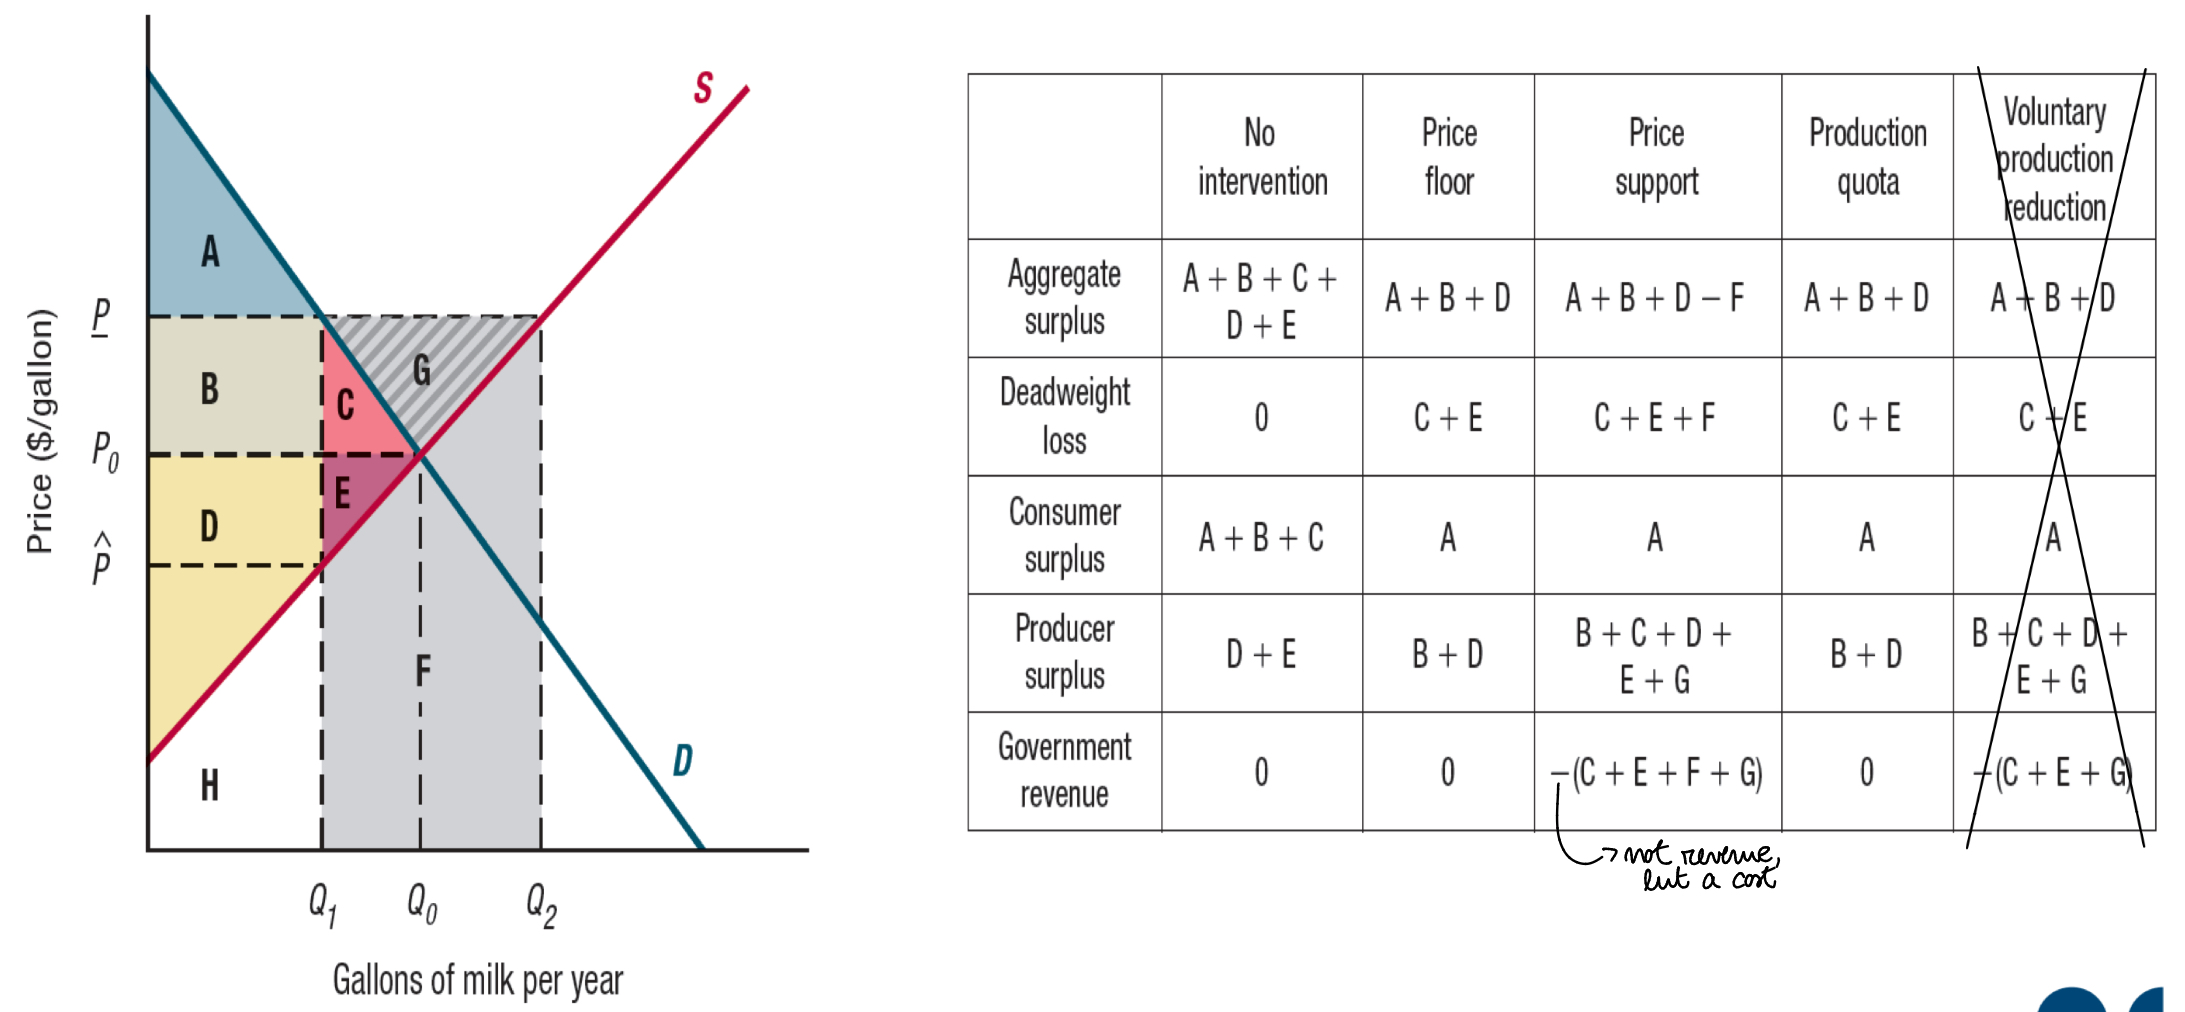
Policies that raise prices and their welfare effects: visualisation
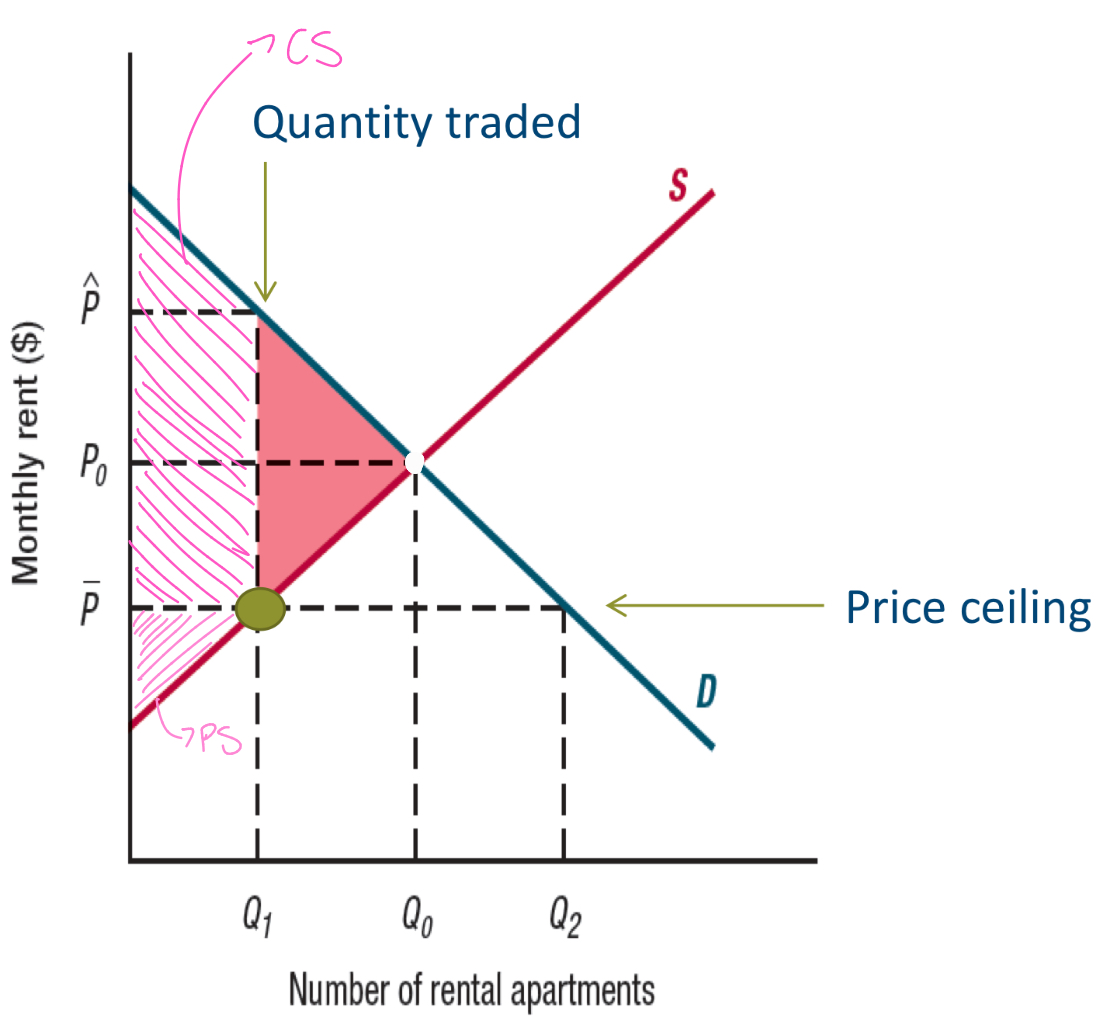
Price ceiling —> what does it establish?
=establishes a maximum price that sellers can charge
What does a price ceiling do?
It increases Consumer Surplus (CS)
Visualising a price ceiling in a graph
If the government imposes a price ceiling on apartment rents equal to P (upper dash), the number of available (so rented) apartments falls from Q0 to Q1
—> The resulting DWL is the red-shaded area