Chapter 11 Technology, Production, Costs
1/64
There's no tags or description
Looks like no tags are added yet.
Name | Mastery | Learn | Test | Matching | Spaced | Call with Kai |
|---|
No analytics yet
Send a link to your students to track their progress
65 Terms
supply curves are upward sloping because ___________
marginal cost increases as firms increase the quantity of a good they supply
basic activity of a firm
use inputs to supply outputs
technology
the processes used to turn inputs into outputs
technological change
when a firm can produce a different number of outputs using the same amount or fewer inputs
examples of positive technological change
changing layouts, hiring more skilled workers
examples of negative technological change
hiring less skilled workers, damage to machinery
turnover
when a firm sells out all of its inventory
stockouts
sales being lost because products the consumer wants are not on the shelf
in the _________________ at least one of the firms inputs is fixed
short run
in the ___________ all inputs are variable
long run
total cost
cost of all inputs the firm uses to produce its outputs
variable change
the costs that change as output changes
fixed cost
cost that remain constant as output changes
typical variable costs
electric bill, labor costs, raw materials cost
typical fixed costs
lease payments for property, insurance costs,
total cost formula
TC= VC + FC
opportunity cost
highest value alternative that must be given up to engage in an activity
explicit cost
a cost that requires actual money
implicit cost
a nonmonetary opportunity cost
economic depreciation
the cost of a good at the time of purchase minus what it is worth now
explicit costs are sometimes called ________________
accounting costs
economic costs
include both implicit and explicit costs
the relationship between the inputs a firm uses and the maximum amount of outputs it can produce with that amount of inputs
production function
average total cost
total cost divided by the quantity of output produced
marginal product of labor
additional output a firm produces as a result of hiring one more worker
law of diminishing returns
at some point, adding more variables inputs into a fixed labor will eventually stop producing as many more outputs
average product of labor
total output produced by a firm divided by the number of workers
whenever the marginal product of labor is greater than the average product of labor _________________
the average product of labor must be increasing
marginal cost
the change in a firms total cost from producing one more unit of a good or service
marginal cost formula
MC= Total cost / quantity
when the marginal product of labor is rising _________________
the marginal cost of output is falling
when the marginal product of labor is falling _________
the marginal cost of output is rising
when marginal cost is above average ___________
average total cost will rise and vice versa
in the long run, all costs are ___________
variable
there are no _______________ in the long run
fixed costs
long run average cost curve
a curve that shows the lowest cost at which a firm is able to produce a given quantity of output in the long run, when no inputs are fixed
economies of scale
the situation when a firms long run average costs falls as it increases the quantity of output it produces
constant returns to scale
the situation where average cost of input will stay the same when the quantity produced increases
minimum efficient scale
the lowest average cost you can currently produce (lowest point on chart)
diseconomies of scale
the situation in which a firms long run average costs rise as it increases input
Which of the following are sometimes called accounting costs?
explicit
curve 2
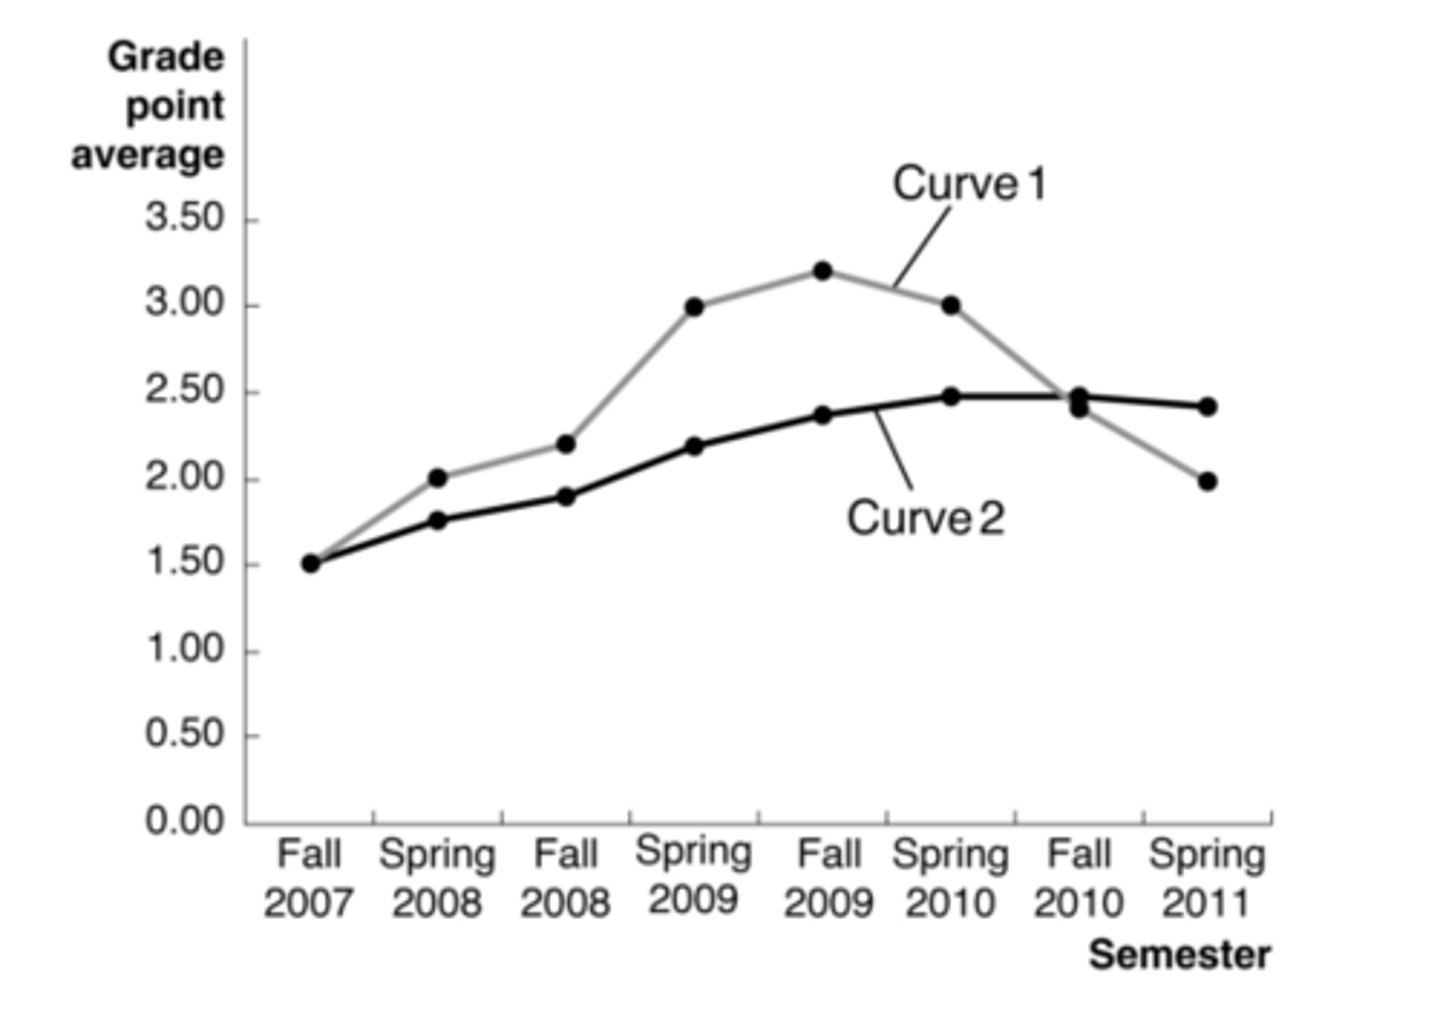
Based on the relationship between average total cost and marginal cost, which of the curves appears to be average total cost?
Which of the following is known as the highest-valued alternative that must be given up in order to engage in an activity?
oppurtunity cost
What is the name for the additional output that a firm produces as a result of hiring one more worker?
marginal product of labor
20,000 units
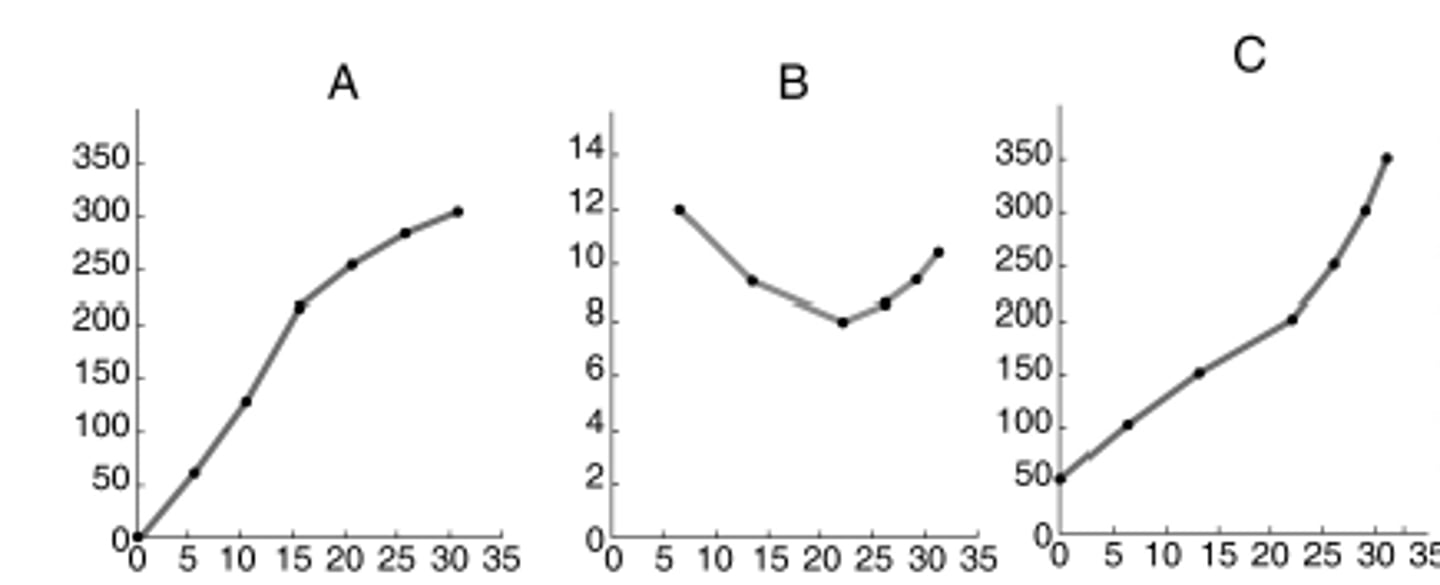
According to the graph, which level of output represents the minimum efficient scale in bookselling?

curve b
Which graph is representative of a typical average total cost curve?
Minimum efficient scale is the level of output at which:
all economies of scale have been exhausted
in the short-run, the cost that is independent of the amount of output produced is called __________.
fixed cost
diminishing returns
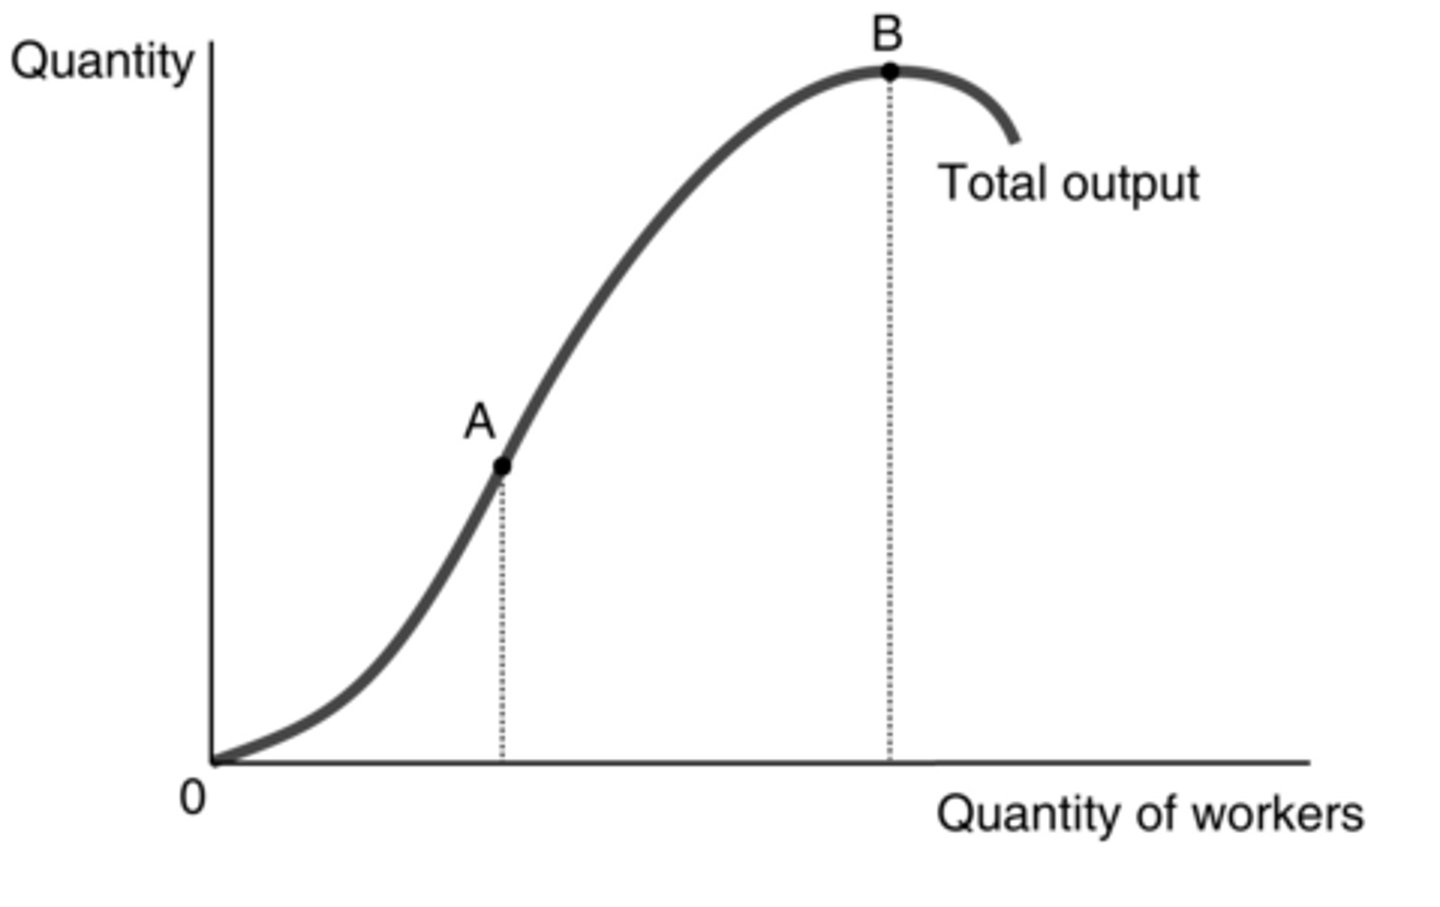
According to the graph, which of the following is more likely to occur when moving from point A to point B?
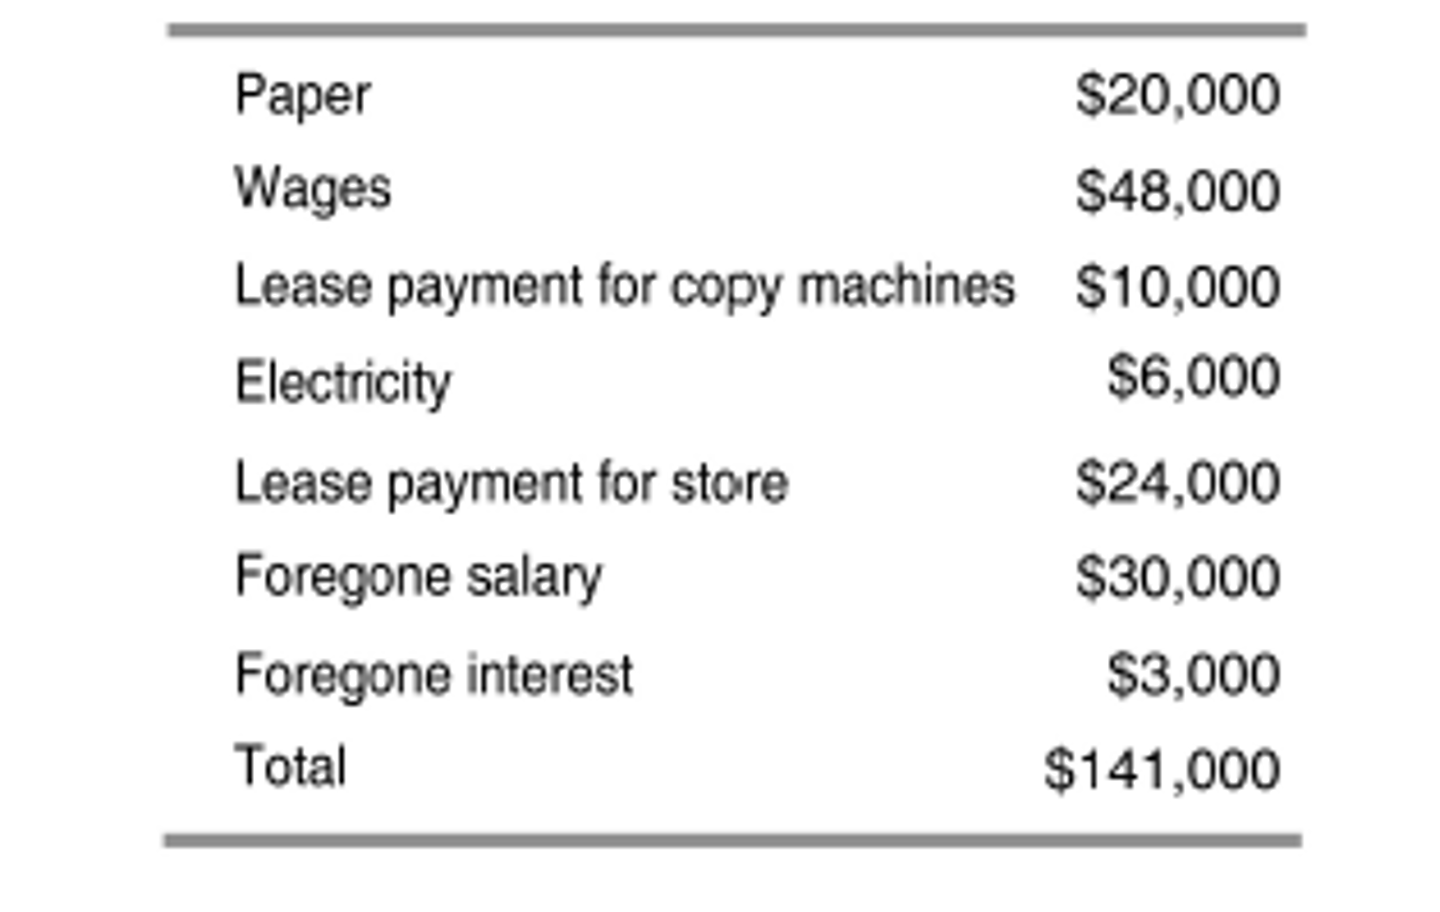
If the number of people in a publishing company does not go up or down with the quantity of books it publishes, then how should we categorize the salaries and benefits paid to these employees?
as part of fixed cost
Which of these costs are affected by the level of output produced?
variable costs
foregone salary and forgone interest
According to the table, which of the following are implicit costs?
When the marginal product of labor is greater than the average product of labor, then the average product of labor must be:
increasing
The relationship between the inputs used by the firm and the maximum output it can produce is known as the:
production function
from 1,000 to 20,000
According to the graph, which change in output represents economies of scale in bookselling?
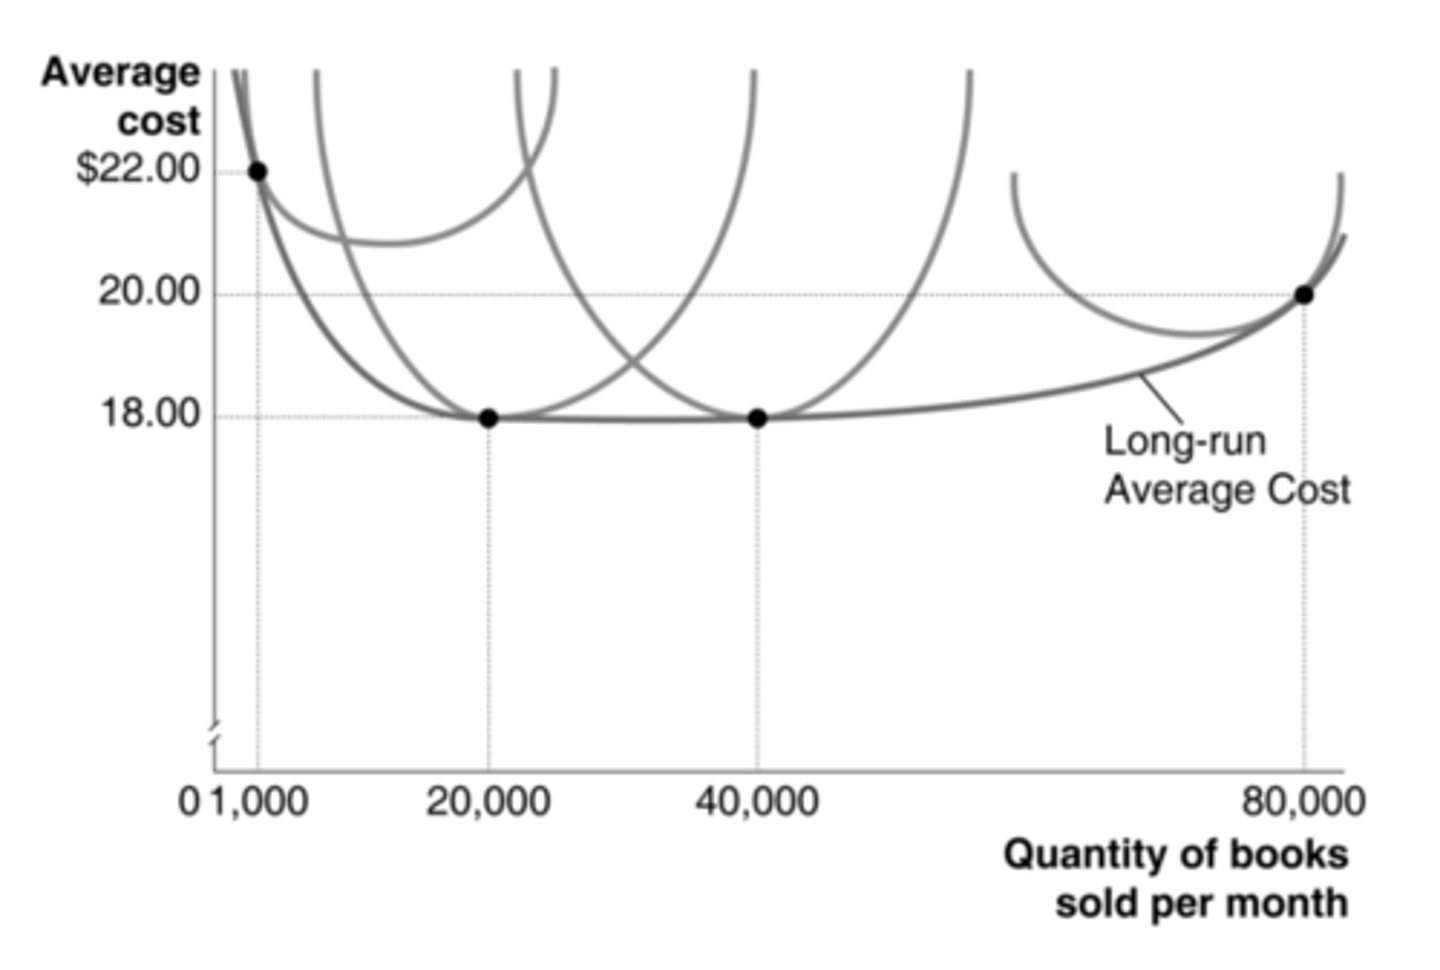
bookstores that sell over 80,000
According to the graph, what size bookstore is more likely to experience diseconomies of scale?

In the short-run, the cost that is independent of the amount of output produced is called __________.
fixed cost
When graphing a conventional short-run production function, we place __________ on the horizontal axis and __________ on the vertical axis.
the variable input, output
The short run is a period of time where __________ while the long run is a period of time where __________.
at least one input is fixed, all inputs are variable
The downward sloping part of the long run average total cost curve is where the firm is achieving:
economies of scale
output increases at an increasing rate
What is occurring from the origin up until point A in this graph?

from 20,000 to 40,000
According to the graph, over what range of output do we find constant returns to scale in bookselling?

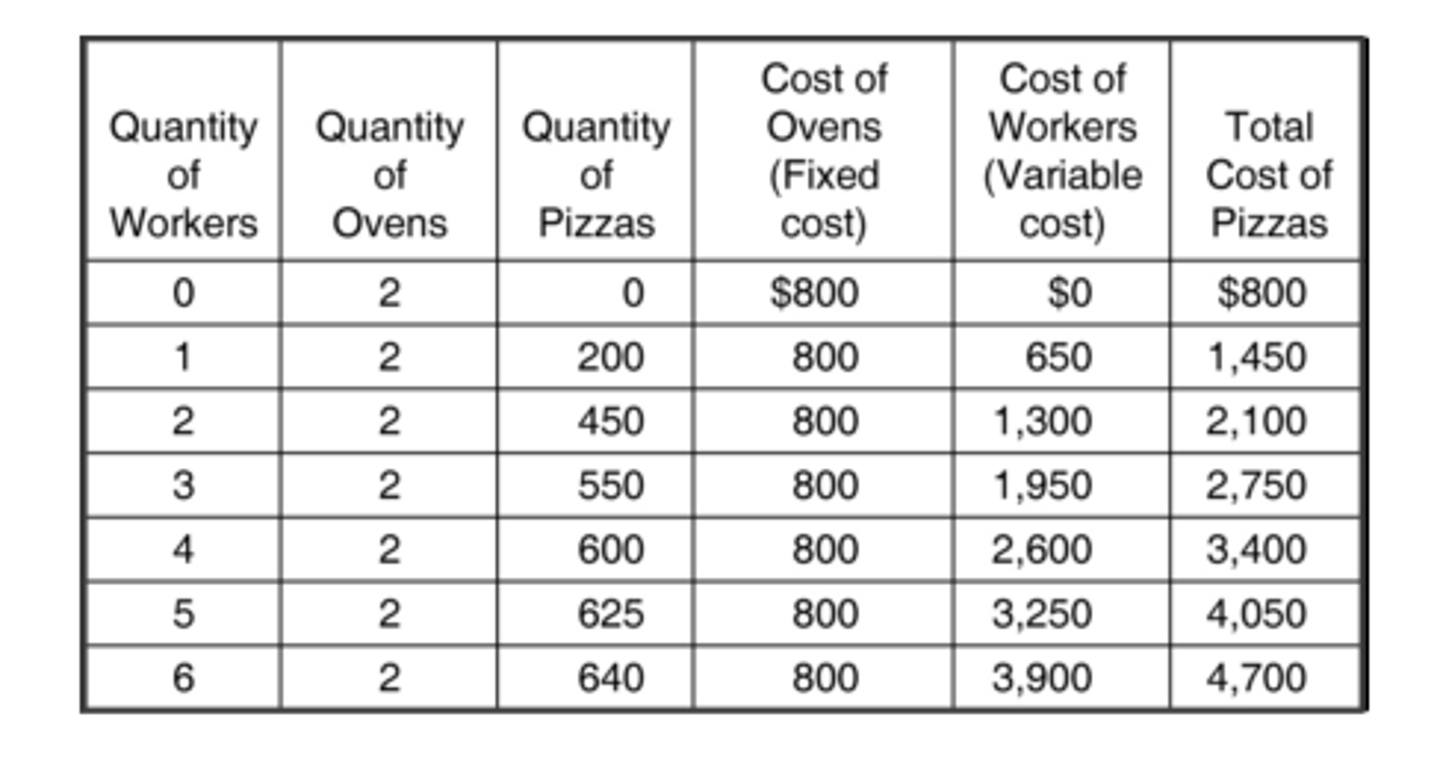
$43.33
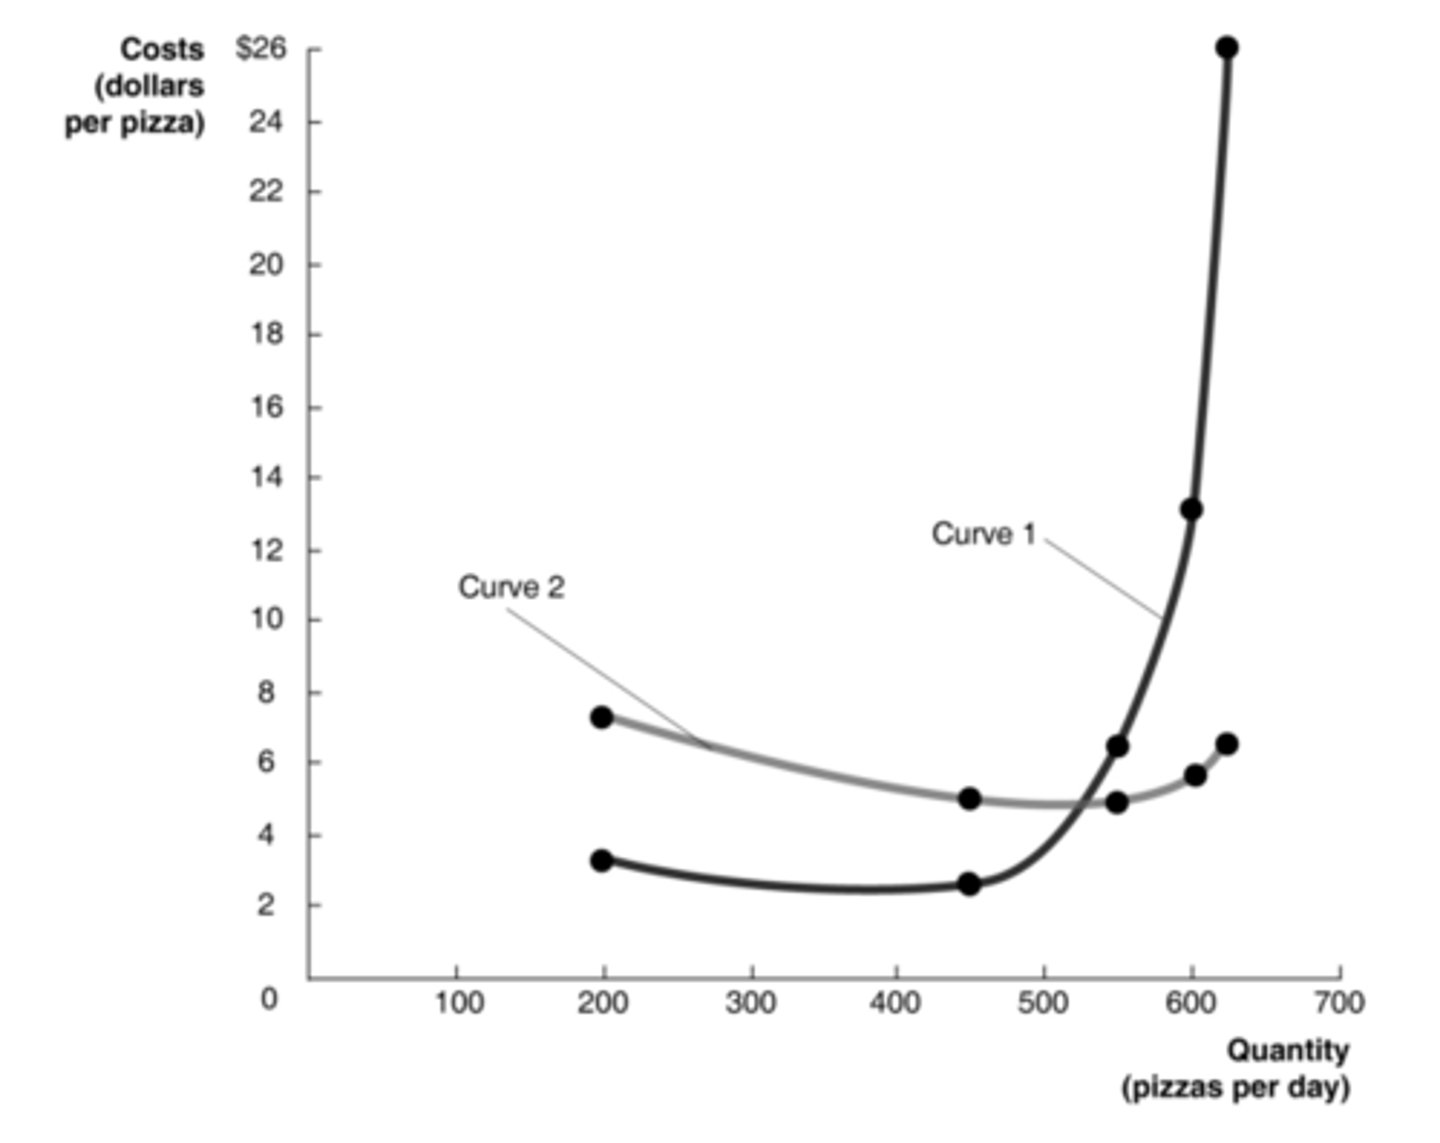
According to the data in the table, what is the marginal cost of producing the 640th pizza?
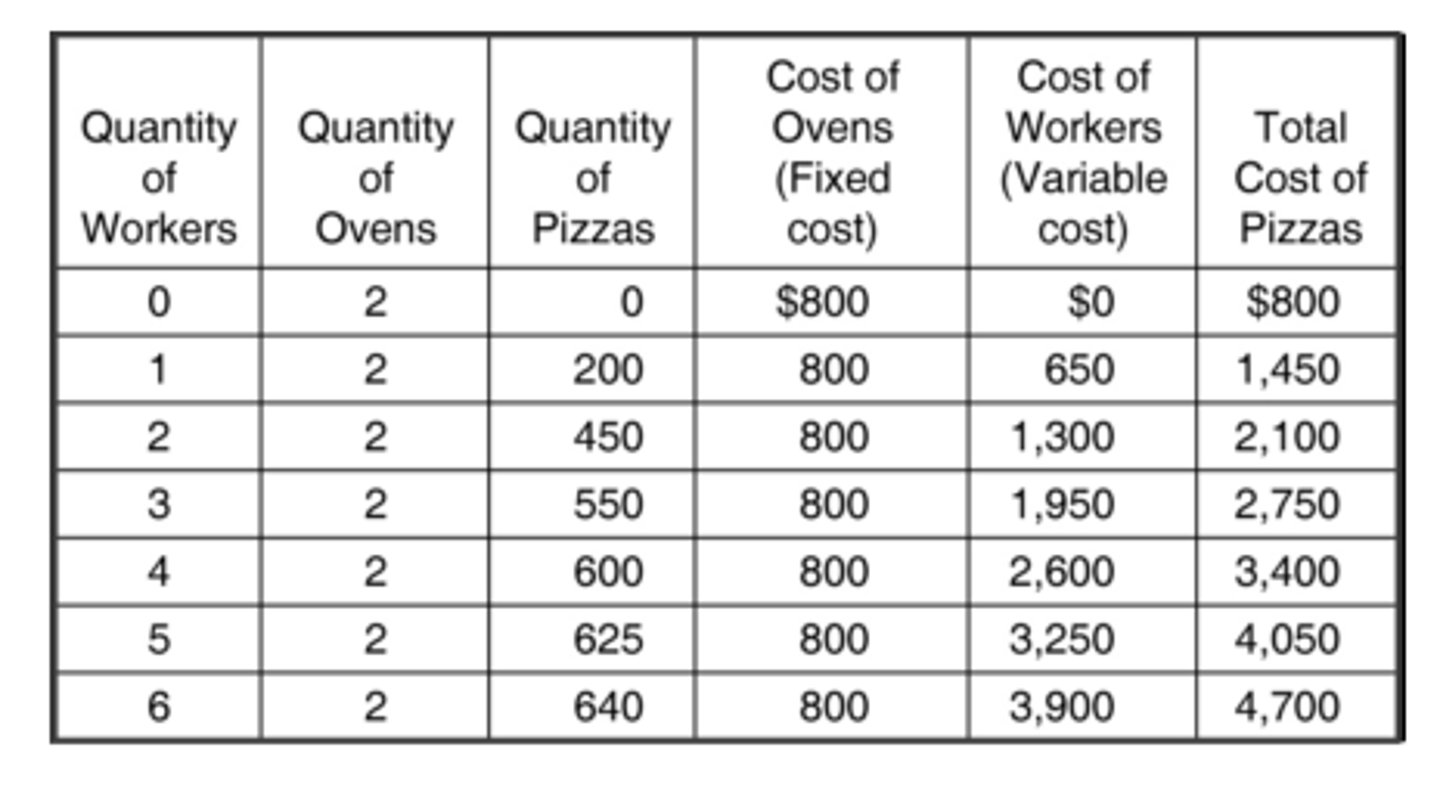
$5.00
According to the table, what is the average total cost of producing 550 pizzas?
curve 2
Based on the relationship between marginal and average product, which curve appears to be the average product curve?