Lecture 17 - Interpretation of financial statements
1/113
There's no tags or description
Looks like no tags are added yet.
Name | Mastery | Learn | Test | Matching | Spaced | Call with Kai |
|---|
No analytics yet
Send a link to your students to track their progress
114 Terms
What are the main components of an annual report?
Primary financial statements accounting policies notes and non-financial information
What key questions does analysis answer?
How the business performed what risks exist and what future performance may be
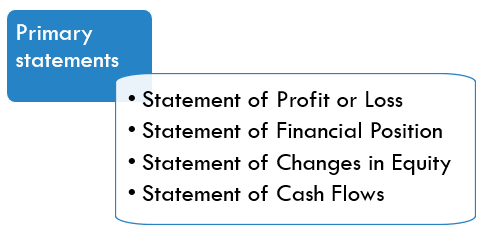
What are the primary financial statements?
Statement of profit or loss
Statement of financial position
Statement of changes in equity
Statement of cash flows
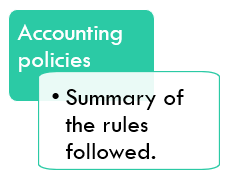
What are accounting policies?
A summary of the rules and methods used in preparing financial statements
What are notes to the accounts?
Additional detailed explanations supporting the financial statements

What are the main components of an annual report?
Financial statements accounting policies notes and non-financial information
What is non-financial information?
Information about governance strategy and business operations
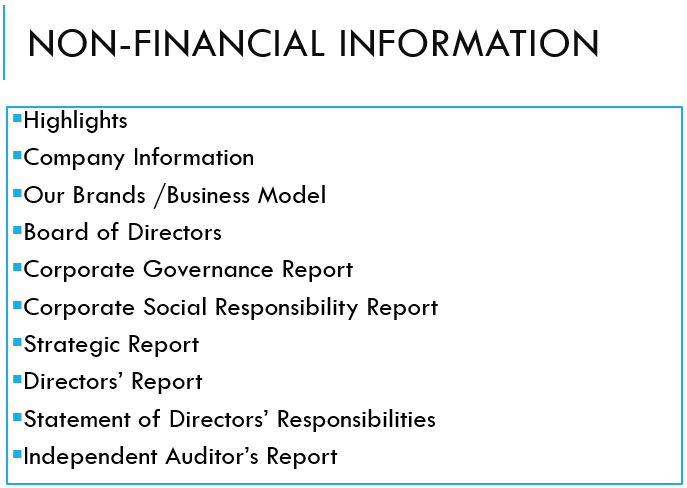
Why is non-financial information useful?
It provides context beyond the numbers
What assets are often excluded from financial statements?
Intangible assets without measurable cost
Give examples of excluded assets?
Brand value
Internally generated goodwill
Staff expertise
Why are these assets excluded?
They do not have a reliable historical cost
(And can’t be measured reliably)
What is historic cost accounting?
Recording assets at their original purchase value
What is an advantage of historic cost accounting?
It is simple objective and verifiable
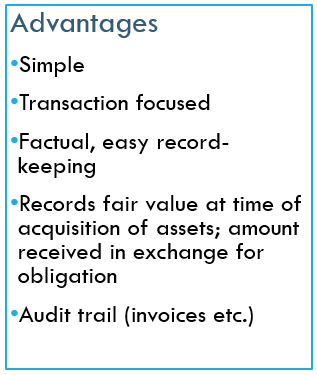
What is another advantage?
It provides a clear audit trail

What is a disadvantage of historic cost accounting?
Asset values may become outdated

What is another disadvantage?
It does not reflect current market value
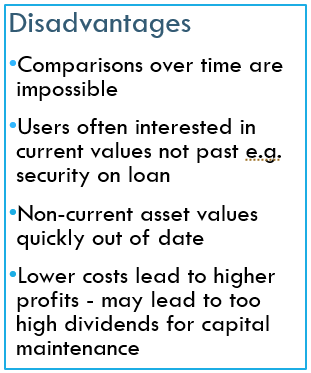
What is another issue?
It can lead to overstated profits and dividends
Why can profits be overstated?
Lower recorded asset values reduce expenses
Why must financial statements be interpreted carefully?
They contain limitations and may not reflect true performance

What is the purpose of financial statement interpretation?
To assess past performance and predict future performance
Why is a single year’s profit not enough?
It lacks context and comparison
Why should multiple years be analysed?
To identify trends and patterns
What is the risk of analysing one period only?
It may reflect unusual or temporary events
What are the four main analysis techniques?
Vertical analysis
Horizontal analysis
Trend analysis
Ratio analysis
What is vertical analysis?
Analysing financial statement items as a percentage of a base figure
What is the base in the income statement?
Sales
What is the base in the balance sheet?
Total assets or capital
What does vertical analysis show?
Cost structure and financing structure
What is horizontal analysis?
Analysing percentage changes over time
What does horizontal analysis show?
Trends across periods and growth
Why is it useful?
It highlights increases or decreases
What is trend analysis?
Evaluating performance over multiple periods
Why is trend analysis important?
It provides context for interpreting performance
What does it help identify?
Long-term growth decline or stability
Why is a single profit figure not enough?
It lacks context and comparison
What is ratio analysis?
Comparing financial statement items to evaluate performance
What does a ratio represent?
Relationship between two financial variables
What are the main types of financial ratios?
Profitability
Efficiency
Liquidity
Gearing/Leverage
Investor ratios
What is gross profit margin? (profitability ratio)
Gross profit divided by sales multiplied by 100
What does gross profit margin measure?
Profitability of core operations
What is operating profit margin?
Operating profit divided by sales multiplied by 100

What does operating margin measure?
Operating efficiency
What is the operating profit percentage/margin?

What does PBIT mean?
Profit before interest tax
What is ROE (ROSF)?
Profit after tax divided by equity
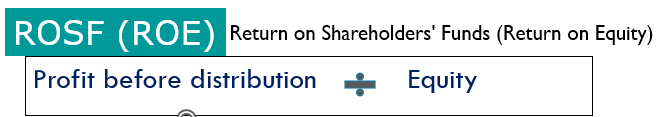
What does ROE measure?
Return to shareholders
What is ROCE?
Profit before interest and tax divided by capital employed
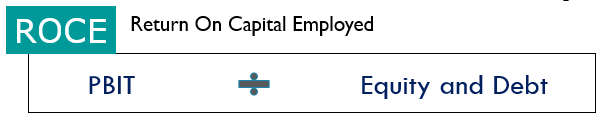
What does ROCE measure?
Overall return on capital used
What is asset turnover? (efficiency ratios)
Sales divided by net assets
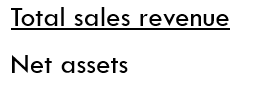
What does asset turnover measure?
Efficiency of asset use
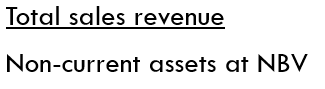
What is non-current asset turnover?
Sales divided by non-current assets
What is inventory holding period?
Average inventory divided by cost of sales multiplied by 365
(the lower the better)
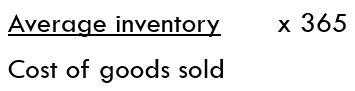
What does it measure?
Number of days inventory is held
What is receivables collection period?
Average receivables divided by credit sales multiplied by 365
(the lower the better)
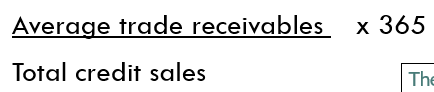
What does it measure?
Time taken to collect cash
What is payables payment period?
Average payables divided by credit purchases multiplied by 365
(the higher the better)
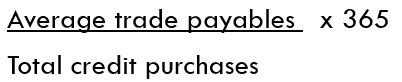
What does it measure?
Time taken to pay suppliers
What is the working capital cycle?
Inventory days plus receivables days minus payables days
(the lower the better)

What does the cash conversion cycle look like?
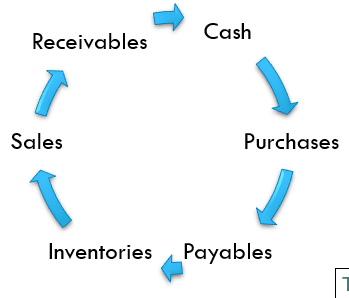
What does it measure?
Time to convert resources into cash
What is the current ratio? (liquidity ratio)
Current assets divided by current liabilities
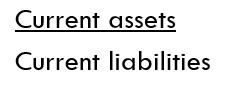
What does it measure?
Liquidity
(E.g. a typical supermarkets current ratio = 0.65times)
What is the acid test ratio?
Current assets minus inventory divided by current liabilities

What are the determinants of the lequidity ratios?
The’re not as simple as “the higher the better” - there is no right answer here
Why exclude inventory?
It is less liquid
Is a higher liquidity ratio always better?
No there is no single optimal level
What is gearing ratio?
Debt divided by total capital multiplied by 100
(As a %)
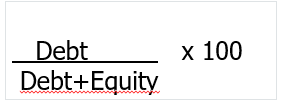
What is the alternative gearing ratio equation?
As a %

What does gearing measure?
Financial risk - if too high, there’s a danger of over-commitment to pay interest
What is interest cover?
Profit before interest and tax divided by interest expense

What does it measure?
Ability to pay interest

What happens if gearing is too high?
Risk of financial distress increases
What is dividend cover? (investor ratio)
Profit after tax divided by dividends

What does it measure?
Ability to sustain dividends
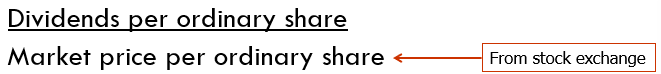
What is dividend yield?
Dividend per share divided by share price
What is earnings per share?
Profit after tax divided by number of shares

What is price earnings ratio?
Share price divided by earnings per share

What does a high PE ratio indicate?
Possible overvaluation or high growth expectations
What does a low PE ratio indicate?
Possible undervaluation
What are yardsticks?
Benchmarks used to compare performance
Why are yardsticks used in analysis?
Past performance
Competitors
Industry averages
Budgets
Why must companies be compared carefully?
Different industries and policies affect results
What are sources of noise in accounting information?
Business cycles accounting policies and estimates
Why analyse earnings over a full business cycle?
To identify normalised performance
What is lack of comparability?
Differences between firms that distort comparisons
Why do accounting policies matter?
They affect reported figures
What should be checked in accounting policies?
Consistency over time
What areas commonly vary?
Depreciation
Inventory valuation
Revaluation
What is retrospective adjustment?
Adjusting past figures after policy changes
What is accounts manipulation?
Adjusting figures to influence results
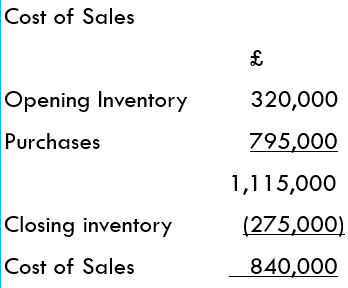
How can inventory be used to manipulate profit?
Higher closing inventory increases profit
Why is this important?
It can distort performance
Why should exceptional items be considered?
They distort underlying performance
What are exceptional items?
Large unusual transactions affecting profit
Where are exceptional items reported?
In profit or loss before interest
What is adjusted profit?
Profit excluding exceptional items
Why use adjusted profit?
To assess core performance
What is EBITDA?
Earnings before interest tax depreciation and amortisation
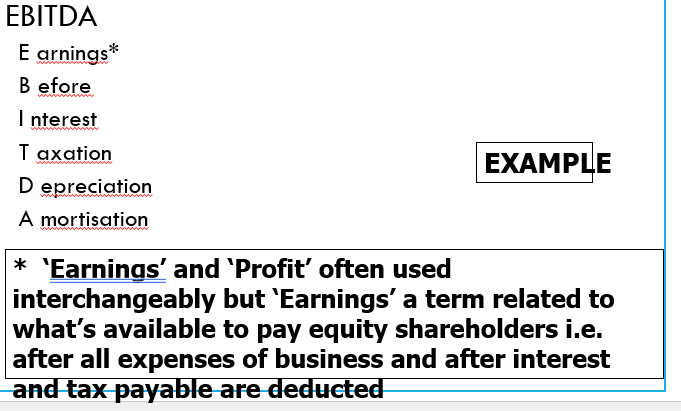
Depreciation vs Amortisation
Amortisation applies to intangibles whole depreciation applies to tangible
Why use EBITDA?
To compare operating performance