Week 3- Fixed .vs. random effects; Effect size
1/17
Earn XP
Description and Tags
10/10/24
Name | Mastery | Learn | Test | Matching | Spaced | Call with Kai |
|---|
No analytics yet
Send a link to your students to track their progress
18 Terms
Detecting effects
Raising the sample size we increase the statistical power of a test to detect an effect
Fixed vs random effects- ANOVA decided
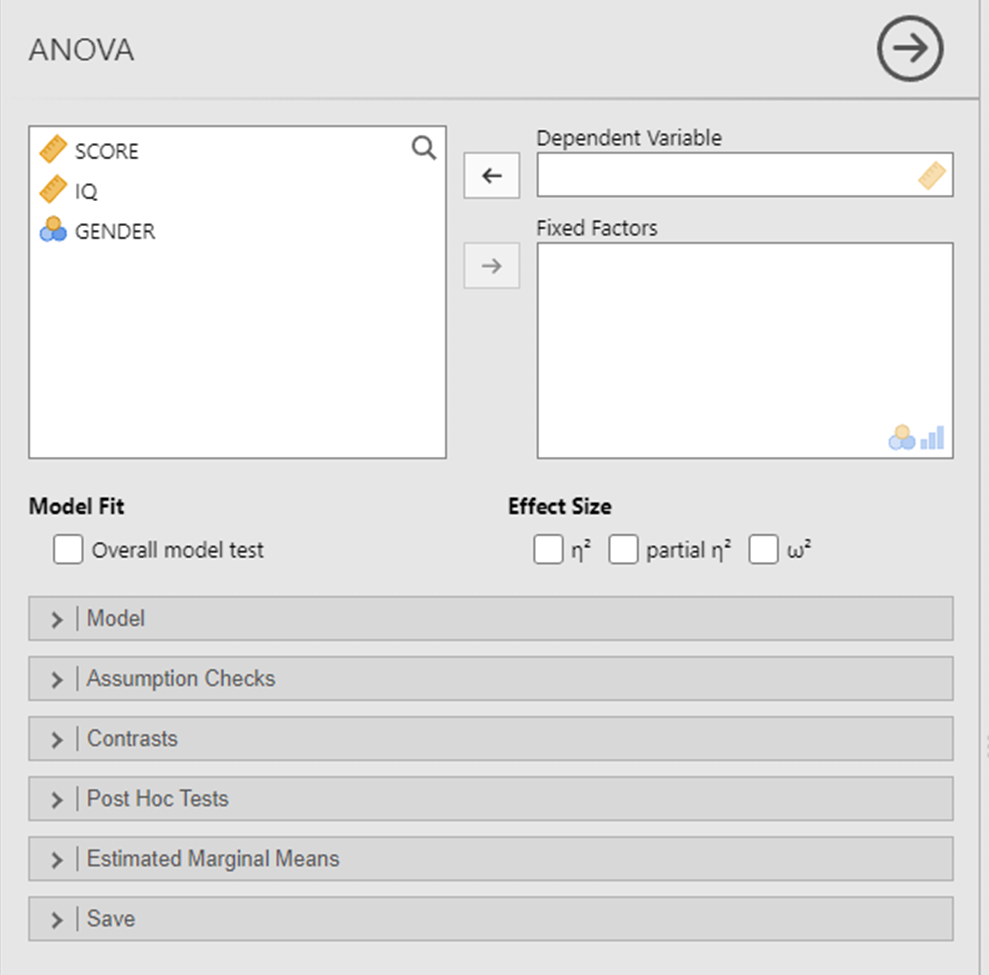
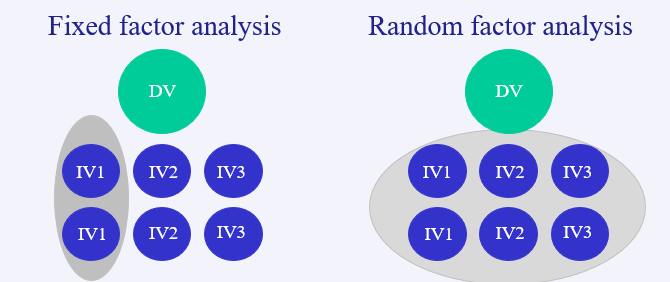
Fixed effects
Fixed effects analyses are used when you want to know whether the individual and precise conditions tested have an effect on performance
we are only interested in the specific levels of the IV featured in the dataset
F-ratio calculation takes the error term from within those groups/conditions defined by that specific IV
Random effects
Random effects analyses are used when the values of the experimental conditions have been sampled at random from a wider population of different
We want to generalise the observed effect to other possible levels of the IV
F-ratio calculation takes the error term from the whole sample (i.e. all groups/conditions defined by all IVs in the design)
For Random effects, the concern is more with the effects of varying the dimension under investigation than with the specific values tested in the study
Random effects- issue
Jamovi looks at all participants in all possible conditions for the F ratio, and so the error term is larger
A bigger error term represents more signal noise , and so a random effect test is less likely to be significant due to worse signal/noise ratio.
This is because we are trying to generalize findings here to variables we haven’t even tested
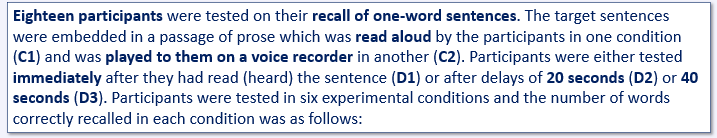
Fixed or random effect example
C1 and C2 fixed as the different forms of presentation are unlikely to have been sampled at random from a list of different possibilities
D1-3 may be random if the delay values were chosen randomly to just see how delay affects performance, and could be changed to any values
Fixed if they’re interested in the effects of those specific delay values, based on a theoretical or experimental reason
Random .vs. fixed effect uses
Random is often used when testing something brand new e.g. when MSM was being developed
Fixed effects have an advantage as they’re more likely to be significant
However, fixed cannot be generalised beyond the levels chosen
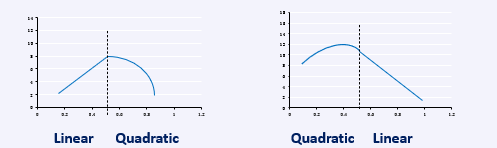
Random effects issue- assumptions
Assumes that the relationship between the IV and the DV is consistent throughout the full range of possible values of the IV
The relationship may only be consistent for part of its range or have 2+ distinct relationships that are consistent within particular ranges
Fixed .vs. random examples
Gender: male vs female vs non-binary- Fixed
Treatment: CBT vs Mindfulness vs No therapy- Fixed
Primed condition: Aggressive vs Friendly vs No prime- Fixed
Location: London vs Liverpool vs Exeter- potentially both (specific locations- fixed, regional- random)
Age: 5yrs vs 11yrs vs 16yrs (if we were interested in UK school stages)- both (specific age- fixed, key stage- random)
Age: 5yrs vs 10yrs vs 15yrs (if we were interested in general development)- both (specific age- fixed, development period- random)
Participants are…
Almost always treated as a random effect- want to generalise results from a specific person to a general population
Effect size and statistical power
The power of a statistical test is the chance that it will allow you to declare the existence of a main effect (or interaction) that is genuinely there in the data
Statistical power
Expressed in terms of a probability value-
Power = 1.0 implies that there is 100% chance that the test will detect the effect (if it does exist). In psychology, 80% is our benchmark
Power = 0.0 means that there is absolutely no chance of detecting the effect
Effect size
Reflects the strength of the influence of the IV on the DV
Larger effect size means bigger differences in DV between groups defined by the IV
Larger effects are more visible, easier to detect
Effect size .vs. significance
Effect size is the magnitude of the observed effect, while significance only tells us that an effect exists
Power and effect size
More powerful analyses allow you to detect smaller effect sizes
Large effect sizes only need relatively low power analyses to detect them
Small effect sizes need more powerful analyses to detect them- more data points in each group, the more powerful the analysis
Up statistical power → up sample size (reduces error variance, but if there’s nothing to find then this obviously won’t work)
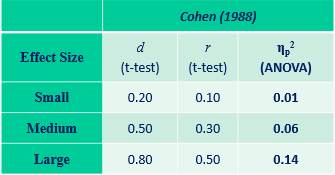
Different effect size measures- interpretation
General estimates, but they are arbitrary and we accept different effect sizes in different disciplines (e.g. pharmaceuticals see small effect sizes as large as in general, their sizes are small)- we will use partial eta squared and we always need to include effect size
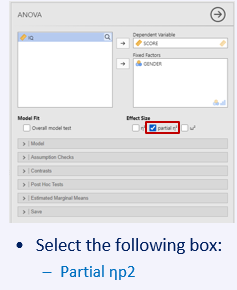
Calculating effect size in Jamovi
Partial eta squared (ηp2) is reported after the p-value
Standard formula: F(1,8) = 12.82, p = .007, ηp2 =.62 (large- above 0.14)
Calculating power using Jamovi
Using G*Power- separate from Jamovi, a free software to install
Allows power estimates for complex study designs (not going to assessed this year, but will be used later in our course)