Reintroducing Inferential Statistics
1/34
There's no tags or description
Looks like no tags are added yet.
Name | Mastery | Learn | Test | Matching | Spaced | Call with Kai |
|---|
No analytics yet
Send a link to your students to track their progress
35 Terms
p: Assume Dr. Null is correct and there was zero
relationship between our variables in the
population, p is the probability we would obtain a
random sample with a relationship between
variables that’s at least as strong as the relationship
we found in the current sample.
More concisely: If there is zero effect in the
population, we would find the observed effect (or a
larger effect) in [p*100]% of random samples.
What’s the ppint of inferential stats?
To use sample data to make a conclusion (an inference) about the entire population
To get research published, the p values for you effect needs to be?
p < .05
ONE-SAMPLE T-TEST
When do we use it?
Is the sample mean significantly different from a set, pre-determined number?
Examples…
1. Is the mean NU-psych IQ significantly higher than the population mean IQ of 100?
Is the mean high school GPA of NU students significantly different from the nationwide (population mean) high school GPA of 2.8?
Can the average person hold their breath for more than 30 seconds?
INDEPENDENT-SAMPLES T-TEST
When to use it?
For some numeric variable, is the mean among Group 1 significantly different from the mean Group 2?
Examples…
When it’s time for a meal, who takes longer to decide to what to eat, men or women?
Is the importance of your favorite musicians’ authenticity (1=NOT-IMPORTANT to 7= EXTREMELY-IMPORTANT) significantly different between hardcore Drake fans and hardcore Kendrick Lamar fans?
3. Is the mean number of Instagram followers significantly different between people over 50 and people under 25?
Paired-samples t-test aka DEPENDENT-MEASURES, REPEATED MEASURES,WITHIN GROUPS
Paired, they depend, you need to repeat, groupies
When to use it?
Scenario 1: is a “before” score significantly different from an “after”?
Examples…
When people have a headache, will they report reduced pain symptoms 30 minutes after (vs before) taking an ibuprofen?
Do people average more car accidents during the year before (vs during the year after) they complete a defensive-driving course?
Do people with ADHD perform better on an attention test after they take adderall, compared to on a day when they haven’t taken addreall?
Paired-samples t-test aka DEPENDENT-MEASURES, WITHIN-GROUPS
Scenario 2: Test for differences between two similarly-scored variables
Examples…
Do NU students score significantly higher on the ACT math section, compared to the ACT reading section? (Both scored out of 36 total)
All else equal (eg. looks, income, etc) is the perceived attractiveness of a flat-earther significantly different than the perceived attractiveness of a STEM major? (both scored on a scale from 1=unattractive to 5= attractive)
Bivariate Correlation & Line Regression Analyses
When to use it?
As numeric variable #1 increases, deos numeric variable #2 tend to increase or decrease?
Examples…
As people get older do they tend to become more conscientious?
As people exercise more hours per week, do they tend to have fewer depressive symptoms?
As people give more high fives per day, do they tend to report higher levels of life satisfaction?
Context non-specific definition of p…
If the null hypothesis were true, we would find the effect we found - or a larger effect in p of random samples from the population
Null Hypothesis
The hypothesis that there is no significant difference between specified populations, any observed difference being due to sampling or experimental error
Chi-sqaure (χ²) test for independence
When to use it?
Given categorical variable A-vs-B and categorical variable X-vs-Y… When people are members of category A (vs B), is it more likely that they’re also members of category Y (vs X)?
Examples…
If you prefer dogs (vs cats), are you more likely to be an extravert (vs introvert)?
If you are a STEM major (vs not) are you more likely to be a frequent video gamer (vs not)?
If you enjoy cooking (vs don’t) are you more likely to have a BMI <30 (vs BMI>30)?
One-way Analysis of Variance (ANOVA)
When to use it?
For numeric variable, is the mean among Group 1 significantly different from the mean among Group 2 (vs Group 3, vs Group 4, etc.)?
ANY situation where you can use independent-samples t-test, you can also use one-way ANOVA
→If testing between 3 or more groups, you can use one-way ANOVA but NOT independent-samples t-test
Examples…
Is the average IQ different between Democrats, Republicans, or Independents?
Is GPA different between psych, BNS, or engineering majors?
Alcohol consumption different between 1st, 2nd, 3rd, 4th years?
2×2 Factorial ANOVA
When to use it?
Assessing how a numeric variable differs between two different 2-level categorical variables
Examples…
Factor 1: ADHD (yes vs no)
Factor 2: Adderall (20mg vs placebo)
Outcome variable: Attention Test score
Above, did ADHD (present vs not) influence attention scores?
Or, did Adderall (20mg vs not) influence attention scores?
Factor 1: pre-bed screentime (yes vs no)
Factor 2: pre-6pm cardio exercise (20 min vs none)
Outcome variable: time elapsed between sleep attempt and sleep onset
Factor 1: alcohol drinker vs not
Factor 2: male vs female
Outcome variable: Autobiographical History of Violence Score
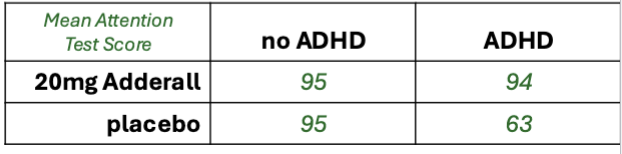
What can 2×2 Factorial ANOVA tell you?
Whether there was an INTERACTION EFFECT
aka MODERATION
INTERACTION EFFECT: When the effect of one independent variable on a dependent variable changes depending on the value of another independent variable
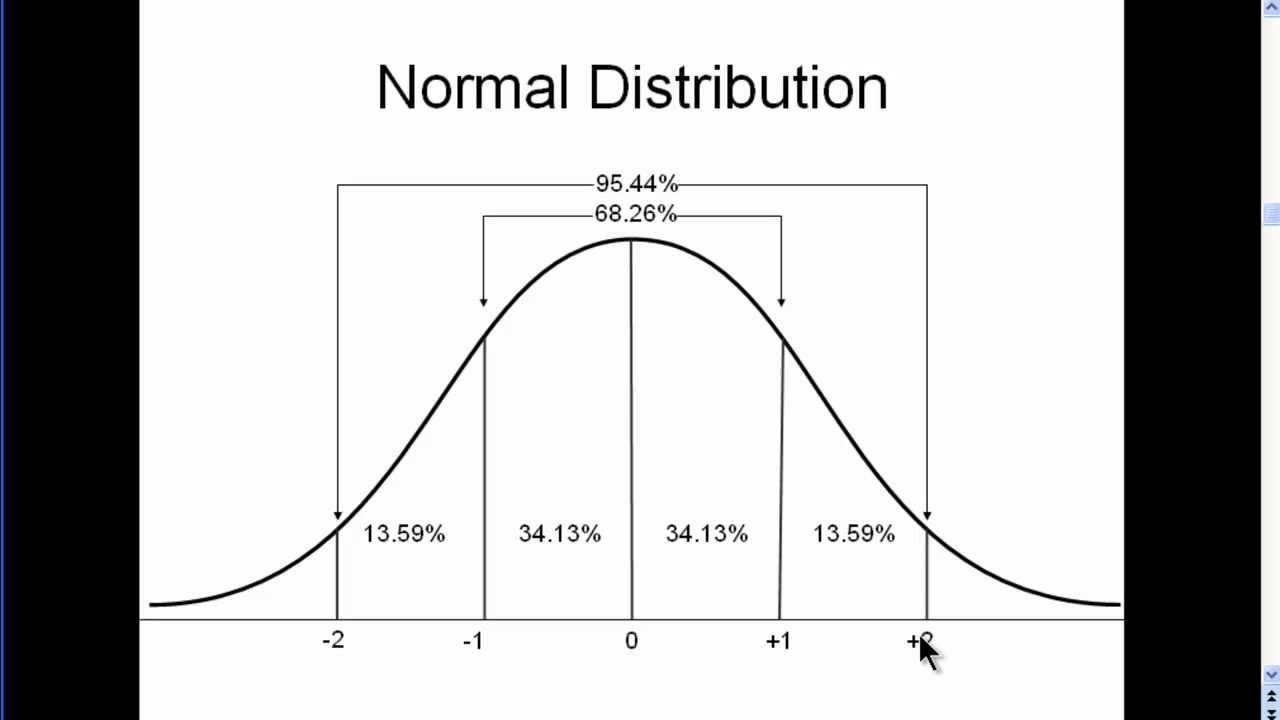
Z-scores helpful vs when they’re limited
As a tool for understanding where a score falls within a normal distribution, z-scores are helpful
When, however, is the utility of z-scored limited?
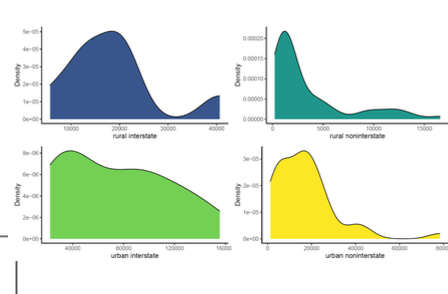
They don’t work with non-normal distributions
Normal distribution
Bell-shaped curve where most data points cluster around the mean, and the frequency of values tapers off symmetrically toward the tails
Non normal Distribution
Data that doesn’t follow the symmetrical, bell-shaped curve of a normal (or Gaussian) distribution
Inferential Statistics
Use patterns of data within a sample to make probabilistic about patterns of data within the entire population
i.e they use data from a few dozen people (or more) to make conclusions about millions!
CENTRAL LIMIT THEOREM (secret sauce of inferential stats)
For a given variable, even when the distribution of raw data is non-normal, the sampling distribution of several sample means will always approach normality
In other words, you’ll ALWAYS end up with a normal distribution if you make a histogram of a crap-ton of sample means for a variable
CENTRAL LIMIT THEOREM DETAILS
More sample means → closer to a normal distribution of means
higher N per sample mean → closer to a normal distribution of sample means
higher N per sample mean → a narrower distribution of sample means
Why/how is CLT the “secret sauce” of inferential stats?
Because we know the distribution of sample means is always normal… once we have one sample mean, we can make confident, probabilistic predictions about the population mean
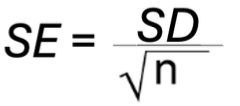
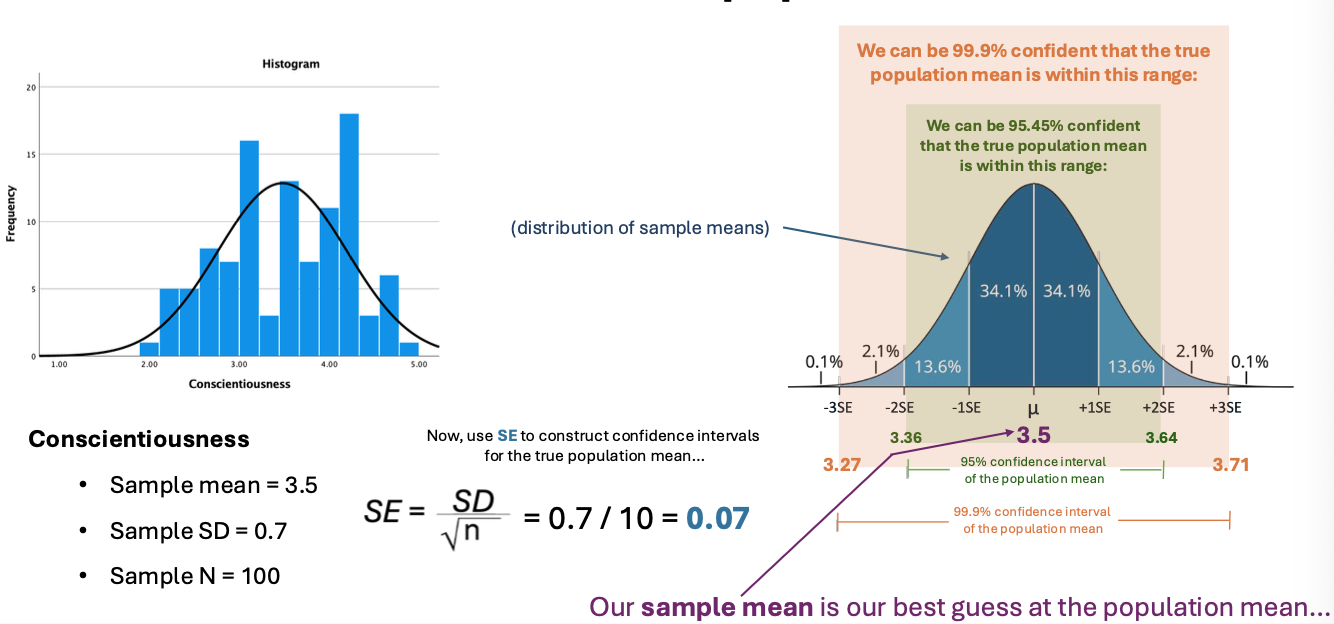
Standard Error of the Mean
(SE) = the standard deviation of sample means
Per CLT, there is always a normal distribution, so the z-score rules always apply!
SE is rarely truly knowable or known.. but…
To estimate (“calculate”) SE:
SE = SD/square root nx
Using CLT, SE, and the sample mean to make an inference about the population mean
What is the Central Limit Theorem? What are the “extra details”?
Central limit theorem states that for a given variable, even when the distribution of raw data is non-normal, the distribution of several sample means will always approach normality
Detailes:
More sample means → closer to a normal distribution of means
higher N per sample means → closer to a normal distribution of sample means
higher N per sample means → a narrower distribution of sample mean s
What is Standard Error of the Mean (SE)?
Standard deviation of all possible sample means that could be drawn from a population
it estimates the range within which a population mean is likely to fall
SE equals SD over the square root of n
How are CLT and SE used to make an inference about the population mean from the known sample mean, SD, and N?
CLT: sampling distribution of mean is (ˉx) is ~normal if n is large, centered at μ (population mean)
SE: Se = S/square root of n; measures variability of sample mean
Standard notation for expressing the probability of an outcome is…
p(outcome) = ____ ← (the blank is a decimal between 0.0 → 1.0)
Formula for probability is…
p(outcome) = (number of independent results that would qualify as outcome) / (number of possible outcomes for the event)
Ex. p(random item from my pocket is a phone) = ¼ (4 being phone or kets or mint or chapsticks) = 0.25
CONVERTING PROBABILITY INTO PERCENTAGE…
MULTIPLY BY 100: 0.25 → 0.25×100 → 25% chance
Mutually exclusive
Two outcomes are mutually exclusive if it would be impossible for both outcome to happen
For example
A coin can’t land on both head and tails
A football team can’t both win and lose
OR (add) vs AND (multiply)
When calculating the probability of MUTUALLY EXCLUSIVE outcome1 OR outcome2, ADD (+)…
Example: What’s the prpbabiltiy of rolling 2 OR 4 OR 6?
p(2 or 4 or 6) = 1/6 + 1/6 + 1/6 = 3/6 = 0.5
For p of MUTUALLY EXCLUSIVE outcome1 AND THEN ALSO outcome2, MULTIPLY (*)….
Example: What’s the probability of rolling 2 AND THEN 4 AND THEN 6?
p(2, and then 4, and then 6) = p(2) x p(4) x p(6) = 1/6 × 1/6 × 1/6 = 1/216
Gamblers Fallacy
Our tendency to assume a certain independent outcome is “due”, because this outcome has not occurred for several prior identical independent event
Hot-Hand Fallacy
Tendency to assume that a certain independent outcome is “on a roll”, because it was the result of several prior independent events
Expected Value
If you could make the bet 10-trillion times, what would be the avg outcome?
EV= [value of outcome1] x [p(outcome1)] + [value of outcome2] x [p(outcome2)]
(same formula written more concisely) EV = o1 x p1 + o2 + p2
Examples
Flip a coin. If it’s heads, you win $2. If it’s tails, you lose $1
EV = [$2 × 0.5] + [=$1 x -.5] = $1 + [-$0.50] = $0.50
P-value
How likely it is to get same results by random chance
If p is less than 0.05, you reject the null hypothesis