Inference!
Confidence Interval Formula
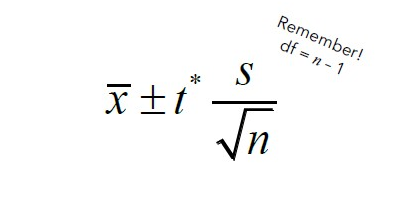
One-sample t-interval for μ
Inference!
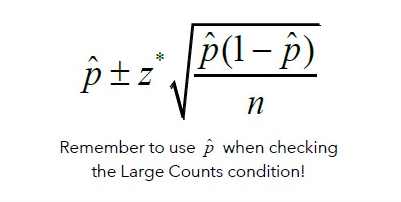
Confidence Interval Formula
One-sample z-interval for p
Inference!
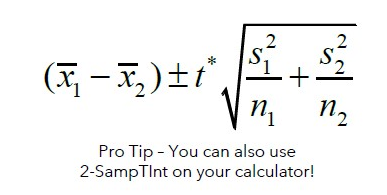
Confidence Interval Formula
Two-sample t-interval for
μ1– μ2
Inference!
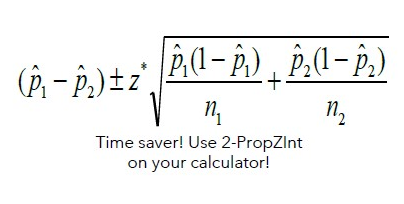
Confidence Interval Formula
Two-sample z-interval for
p1– p2
Inference!
Test Statistic Formula
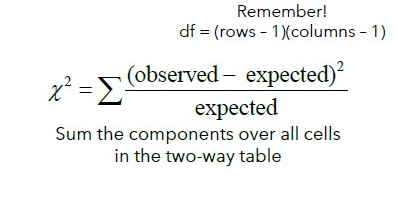
Chi-Square Test for
Homogeneity/Independence
Inference!
Test Statistic Formula
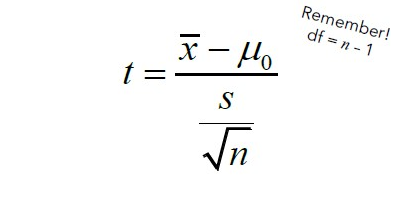
One-sample t-test for μ
Inference!
Test Statistic Formula
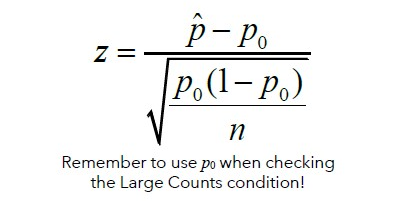
One-sample z-test for p
Inference!
Test Statistic Formula
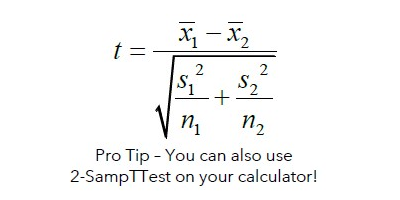
Two-sample t-test for
μ1– μ2
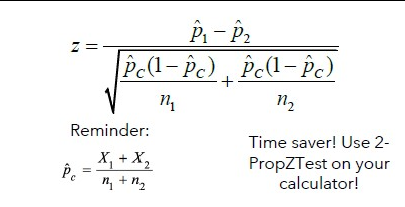
Inference!
Test Statistic Formula
Two-sample z-test for
p1– p2
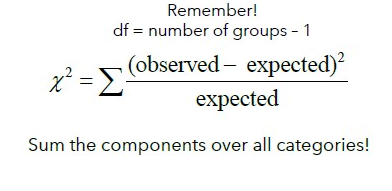
Inference!
Test Statistic Formula
Chi-Square Test for
Goodness of Fit
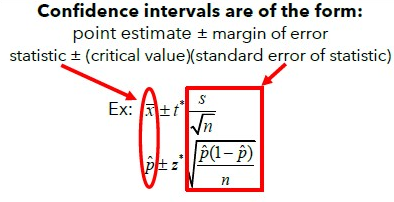
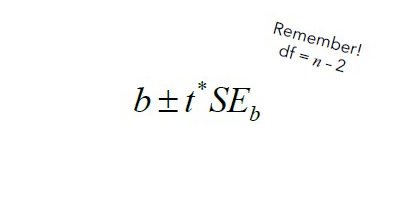
Inference!
CI Formula
t-interval for slope
Inference!
Point Estimate and
Margin of Error
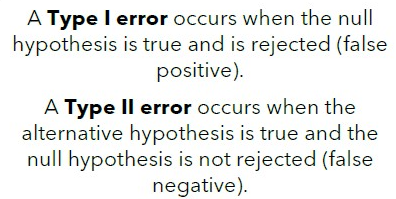
Inference!
Type I and Type II error
Inference!
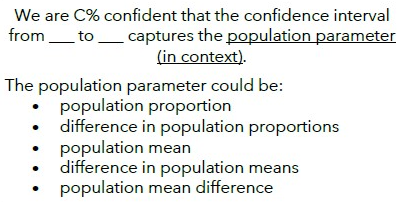
Interpret the confidence
interval
Inference!
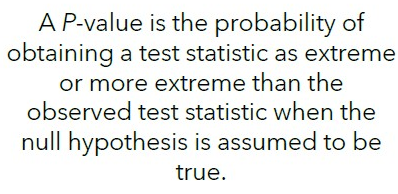
Interpret the P-value
Inference!
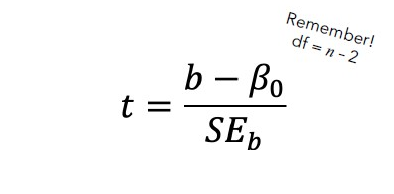
Test Statistic Formula
t-test for slope
Inference!
How to find the point
estimate and margin of
error given a confidence
interval
Suppose a confidence interval is (A, B).
The point estimate is the average of A and B.
The point estimate is the exact center of the
confidence interval!
To find the margin of error, subtract the point
estimate from the upper bound of the
confidence interval!
margin of error = B – (the point estimate)
Inference!
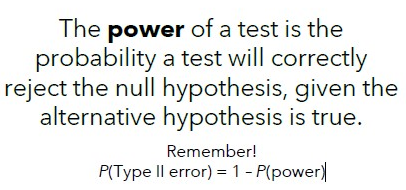
Power
Inference!
Interpret the confidence
level
In repeated random sampling with the same
sample size, approximately C% of confidence
intervals created will capture the population
parameter.
The population parameter could be:
• population proportion
• difference in population proportions
• population mean
• difference in population means
• population mean difference
Inference!
What is an unbiased
estimator?
When estimating a population
parameter, a statistic is unbiased if,
the center of the sampling
distribution for the statistic is equal
to the population parameter.
Inference!
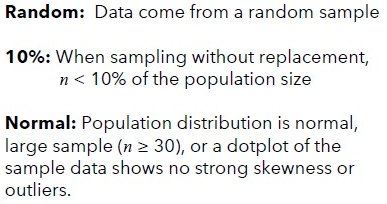
Conditions for a one-sample
t-test and t-interval for μ
Inference!
Conditions for a two-sample
t-test and t-interval for μ1– μ2
Random: Data come from independent random
samples or 2 groups in a randomized experiment.
10%: when sampling without replacement:
n < 10% of the population size for both samples.
Normal: For both populations, either the
population distribution is normal, large sample
(n ≥ 30), or a dot plot of the sample data shows no
strong skewness or outliers.
Inference!
Conditions for
a chi-square test
Random: Data from a random sample, separate
random samples, or groups in a randomized
experiment.
10%: when sampling without replacement: n < 10% of the population size for all samples.
Large Counts: All expected counts must be at least 5.
Inference!
Why do we check the
Random, 10%, and
Normal/Large Sample
conditions?
Random - so we can generalize to the population from
which the sample was selected.
10% condition - so sampling without replacement is
OK and we can use the stated formula for standard
deviation.
Normal/Large Sample - so the sampling distribution is
approximately Normal.
Inference!
What is the difference between
the population distribution, the
sample distribution, and the
sampling distribution?
The population distribution is the distribution of
responses for every individual of the population.
The sample distribution is the distribution of
responses for a single sample.
The sampling distribution is the distribution of
values for the statistic for all possible samples of a
given size from a given population.
Inference!
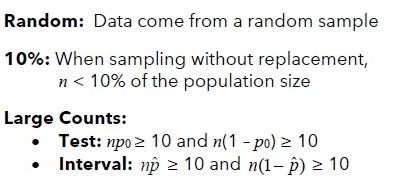
Conditions for
a one-sample
z-test and z-interval for p
Inference!
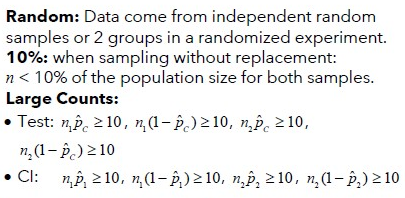
Conditions for a
two-sample z-test and
z-interval for p1– p2
Inference!
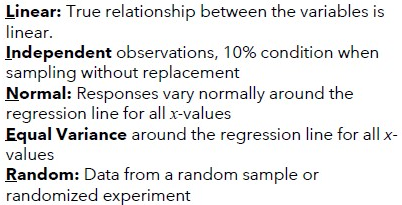
Conditions for a
t-test or t-interval for slope
Inference!
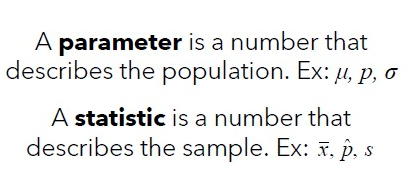
What is the difference
between a parameter and a
statistic?
Inference!
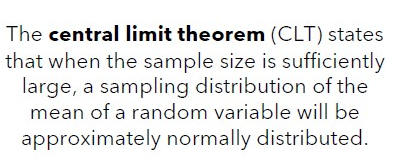
What is the Central Limit
Theorem?
Inference!
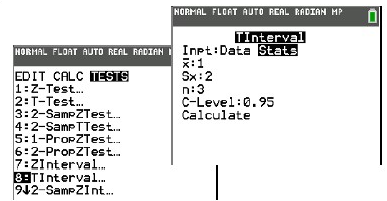
What calculator function is
used for a one-sample
t-interval for μ?
Inference!
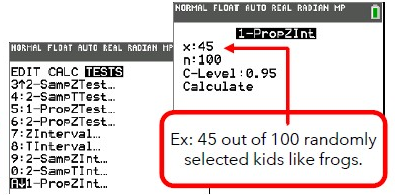
What calculator function is
used for a one-sample
z-interval for p?
Inference!
What factors affect the
width of a confidence
interval?
Inference!
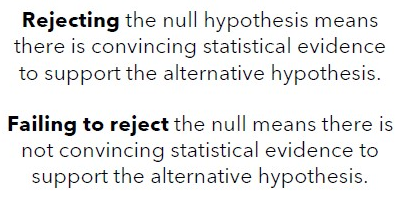
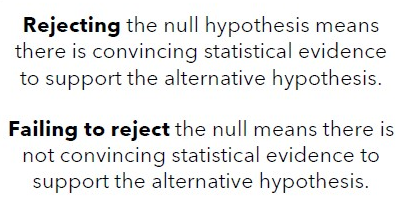
What does it mean if we
reject (or fail to reject) the
null hypothesis?
Inference!
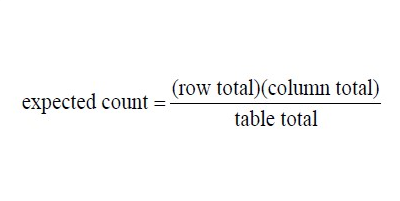
How to calculate expected
counts in a chi-square test for
homogeneity/independence
Inference!
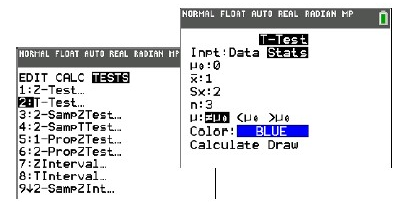
What calculator function is
used for a one-sample
t-test for μ?
Inference!
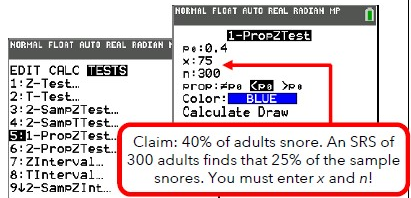
What calculator function is
used for a one-sample
z-test for p?
Inference!
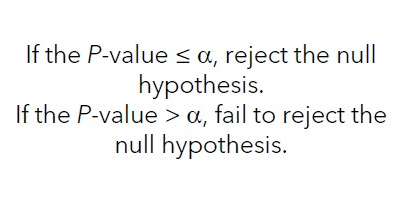
How do I make a decision
based on a P-value?
Inference!
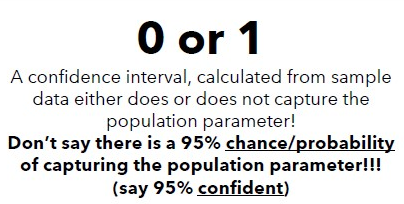
What is the probability that
a specific confidence
interval captures the
population parameter?
Inference!
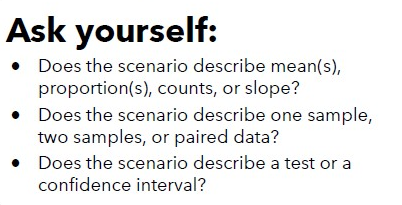
How to choose the right
inference procedure?
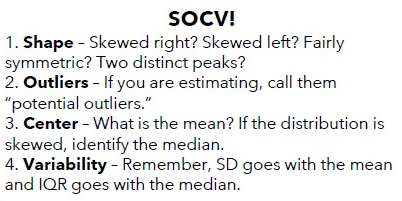
Exploring Data!
Describe a Distribution
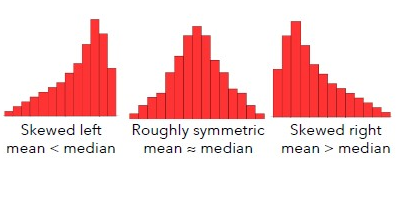
Exploring Data!
How can we use a graph to
compare the mean and the
median?
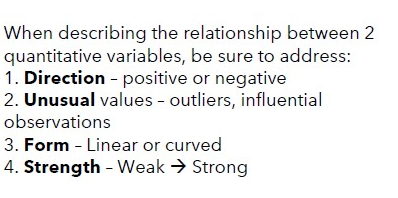
Exploring Data!
How do we describe the
relationship between two
variables (like in a
scatterplot)?
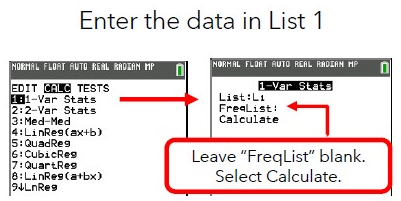
Exploring Data!
How to find the mean, SD,
and 5-number summary
using a graphing calculator
Exploring Data!
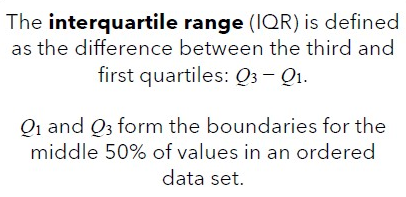
What is the IQR?
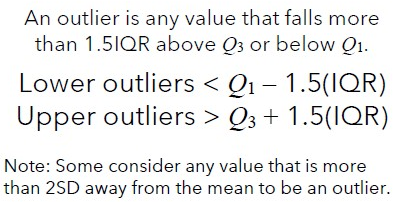
Exploring Data!
Outlier Rule
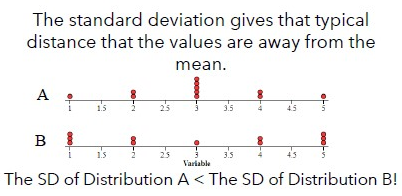
Exploring Data!
Interpret the standard
deviation
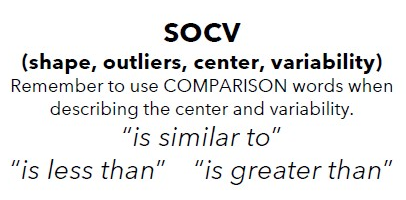
Exploring Data!
Compare two distributions
Exploring Data!
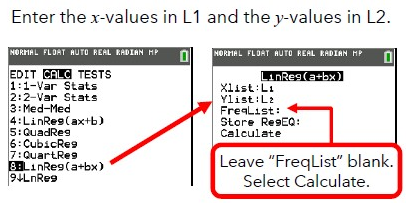
How to calculate a Least Squares Regression Line (LSRL)
using a graphing calculator.
Exploring Data!
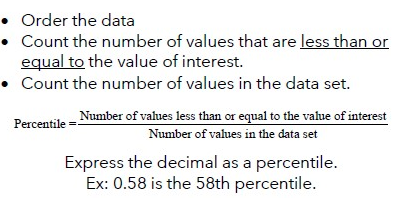
How do I calculate the
percentile of a particular
value in a data set?
Exploring Data!
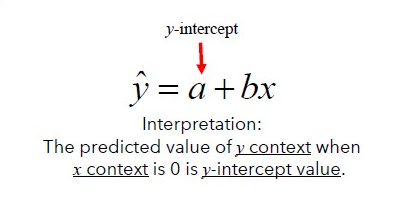
Interpret the y-intercept of
the Least Squares
Regression Line
Exploring Data!
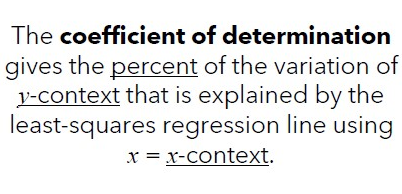
Interpret the coefficient of
determination
r2
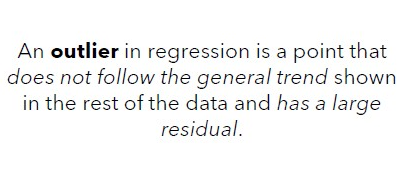
Exploring Data!
Regression Outlier
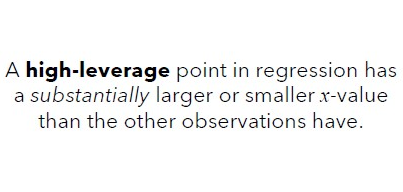
Exploring Data!
High-Leverage Point
Exploring Data!
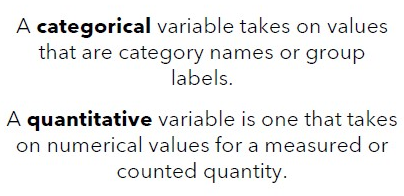
What is the difference
between categorical and
quantitative variables?
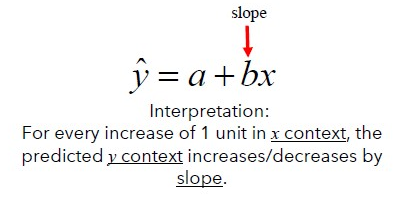
Exploring Data!
Interpret the slope of the
Least Squares Regression
Line
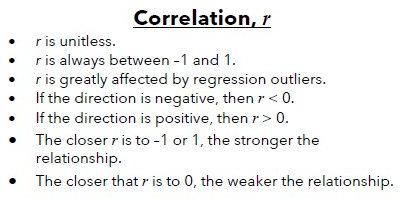
Exploring Data!
Properties of
correlation r
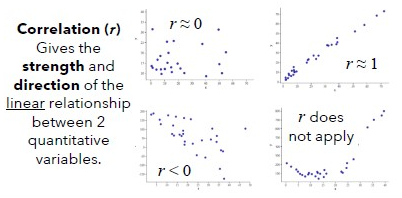
Exploring Data!
Correlation
r
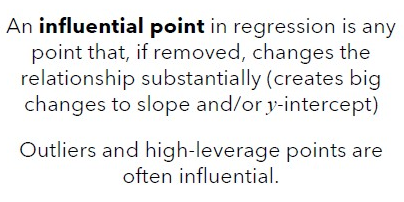
Exploring Data!
Influential Point
Exploring Data!
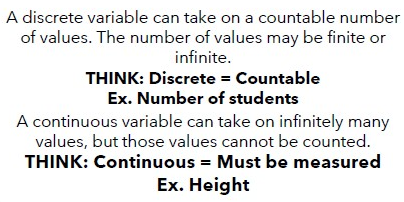
What is the difference
between discrete and
continuous variables?
Sampling/Experiments!
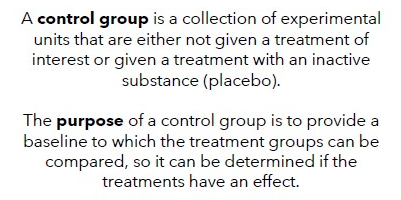
What is a control group?
What is the purpose of a
control group?
Sampling/Experiments!
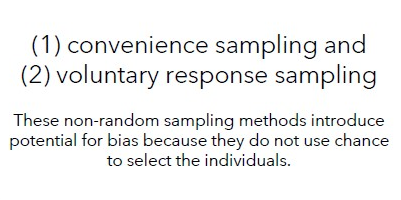
What are two poor
sampling methods?
Sampling/Experiments!
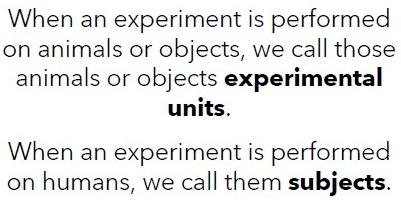
Experimental Units
Subjects
Sampling/Experiments!
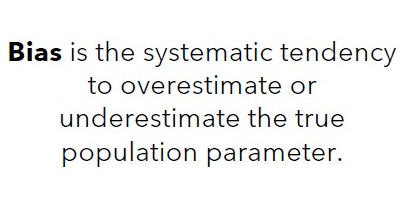
What is bias?
Sampling/Experiments!
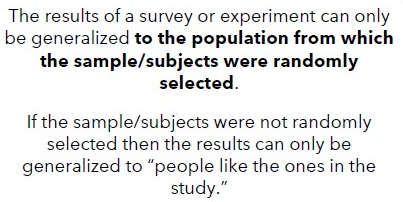
Can the results be
generalized to a larger
population?
Sampling/Experiments!
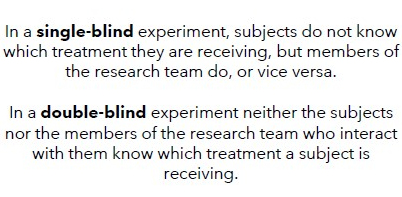
What is single blind and
double blind?
Sampling/Experiments!
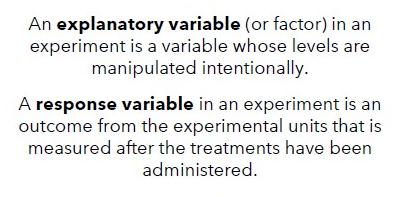
Explanatory Variable
Response Variable
Sampling/Experiments!
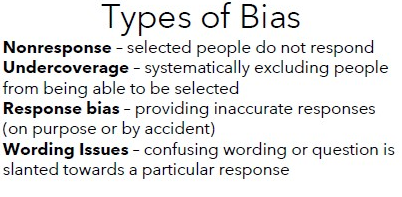
Types of Bias
Sampling/Experiments!
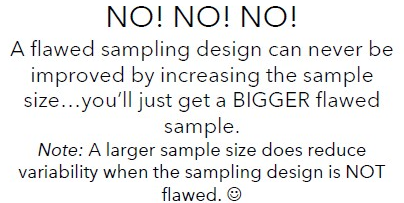
Can increasing the sample size
correct issues that arose from a
biased sampling method?
Sampling/Experiments!
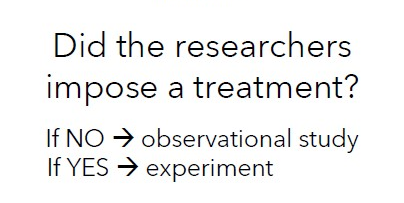
What is the difference
between an observational
study and an experiment?
Sampling/Experiments!
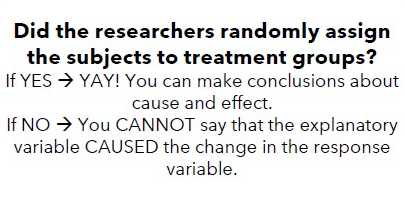
When can we make
conclusions about
cause and effect?
Sampling/Experiments!
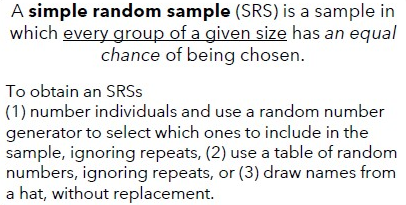
Simple Random Sample
(SRS)
Sampling/Experiments!
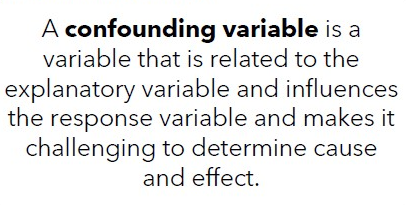
Confounding Variable
Sampling/Experiments!
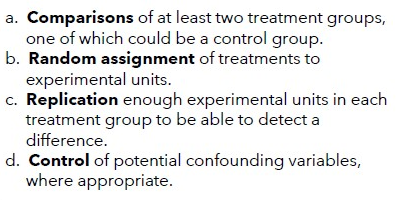
What should a well designed
experiment
include?
Sampling/Experiments!
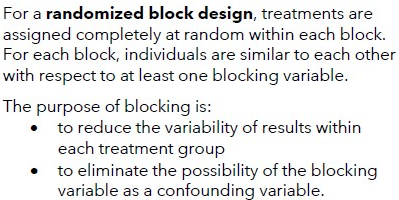
What is a randomized block
design and what is the
purpose?
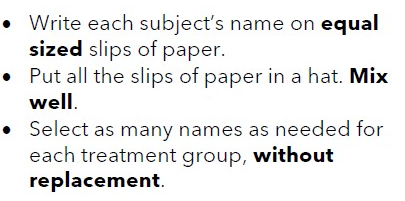
Sampling/Experiments!
How to carry out a random
assignment by selecting
from a hat
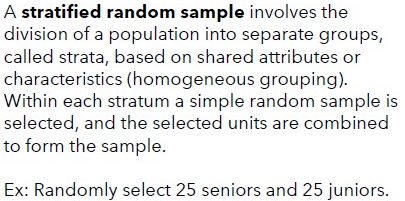
Sampling/Experiments!
Stratified random sample
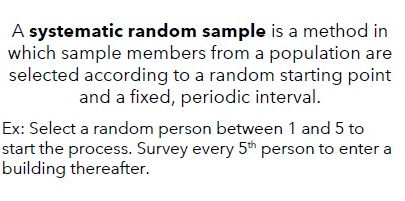
Sampling/Experiments!
Systematic random sample
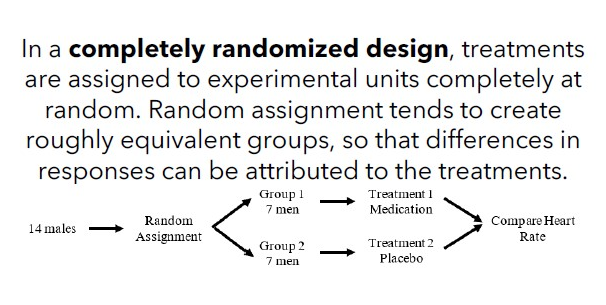
Sampling/Experiments!
Completely Randomized
Design
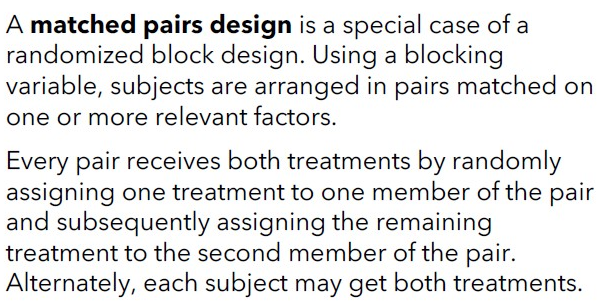
Sampling/Experiments!
Matched Pairs Design
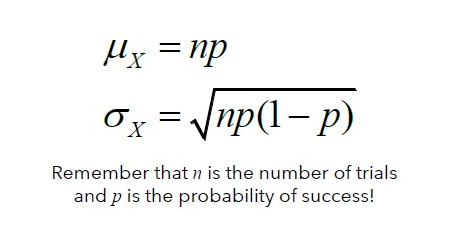
Probability!
Mean and Standard
Deviation of a Binomial
Distribution
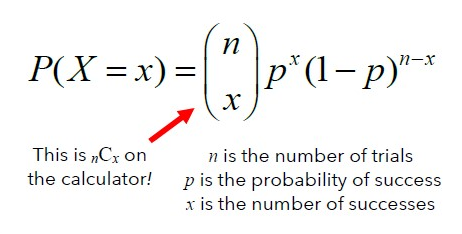
Probability!
Formula for the Binomial
probability P(X = x)
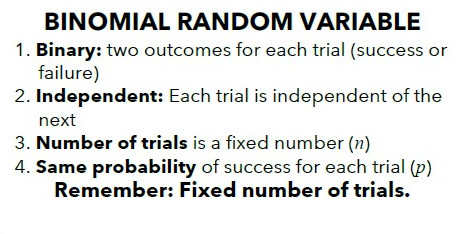
Probability!
Conditions for a Binomial
Random Variable
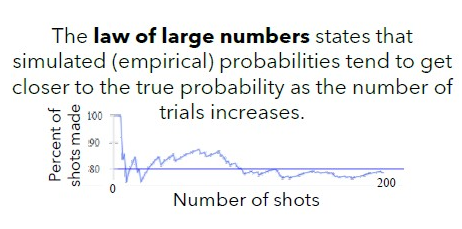
Probability!
What is the Law of Large
Numbers?
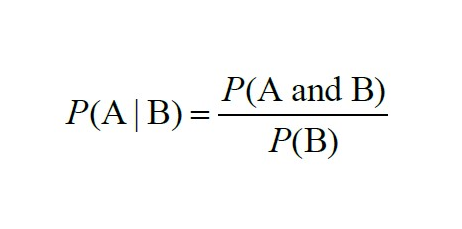
Probability!
How do I calculate a
conditional probability (given)?
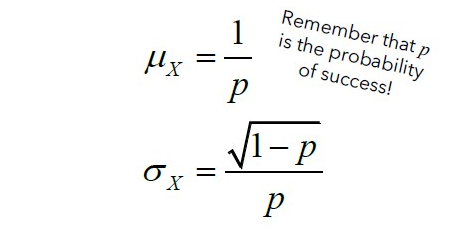
Probability!
Mean and Standard
Deviation of a Geometric
Distribution
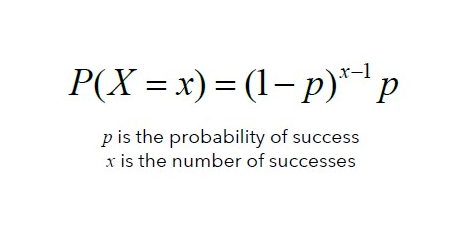
Probability!
Formula for the Geometric
probability P(X = x)
Probability!
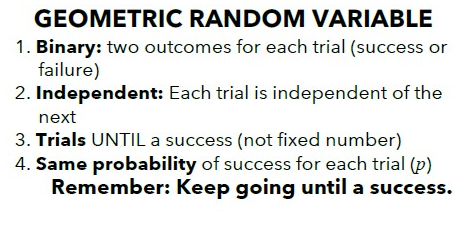
Conditions for a Geometric
Random Variable
Probability!
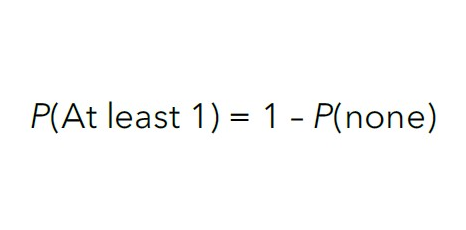
How do I calculate the
probability of “at least 1”?
Probability!
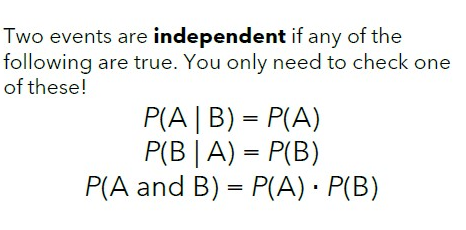
How can I tell if two events
are independent?
Probability!
Mean and Standard
Deviation of the Sum of 2
Independent Random
Variables
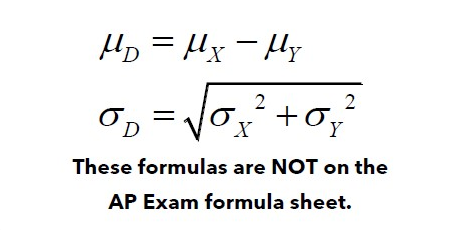
Probability!
Mean and Standard
Deviation of the Difference
of 2 Independent Random
Variables
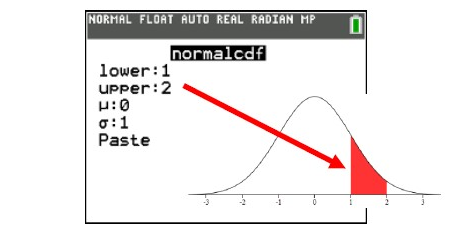
Probability!
Calculator function to find
the area under a Normal
distribution
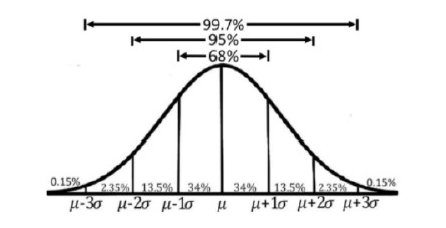
Probability!
What is the empirical rule?
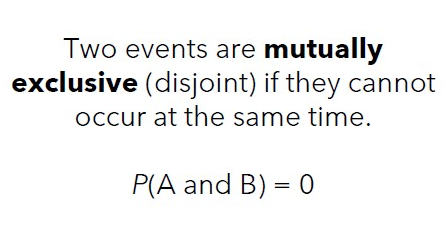
Probability!
Mutually Exclusive Events
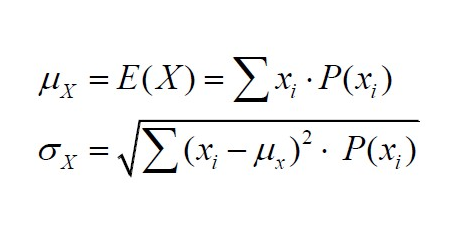
Probability!
Mean and Standard
Deviation of a Discrete
Random Variable
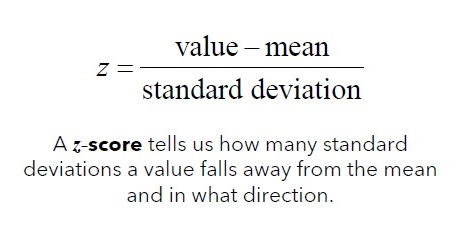
Probability!
Formula and interpretation of a
z-score
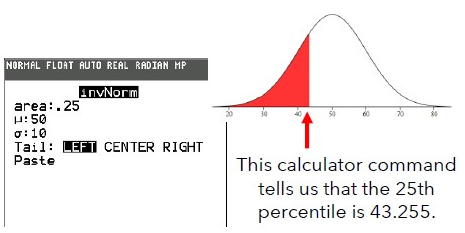
Probability!
Calculator function to find a
value from a given area
under a Normal distribution
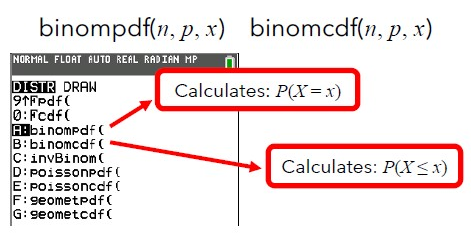
Probability!
What is the difference
between binompdf and
binomcdf?
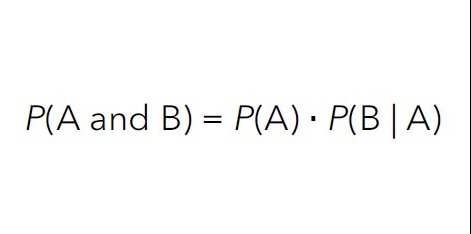
Probability!
How do I calculate
P(A and B)?